
Back to Journals » Journal of Asthma and Allergy » Volume 18
A Detailed Characterization of Asthma Manifestations and Their Associations with Dietary Intakes in a Singapore Cohort of Young Chinese Adults: A Cross-Sectional Study
Authors Lim JJ  , Huang ZX , Loo EXL, Liu MH, Chew FT
Received 3 May 2025
Accepted for publication 9 September 2025
Published 14 October 2025 Volume 2025:18 Pages 1399—1412
DOI https://doi.org/10.2147/JAA.S538254
Checked for plagiarism Yes
Review by Single anonymous peer review
Peer reviewer comments 4
Editor who approved publication: Dr Luis Garcia-Marcos
Jun Jie Lim,1,* Zong Xun Huang,1,* Evelyn Xiu Ling Loo,2 Mei Hui Liu,3 Fook Tim Chew1
1Department of Biological Sciences, National University of Singapore, Singapore, Singapore; 2Singapore Institute for Clinical Sciences (SICS), Agency for Science, Technology and Research (A*STAR), Singapore, Singapore; 3Department of Food Science & Technology, National University of Singapore, Singapore
*These authors contributed equally to this work
Correspondence: Fook Tim Chew, Email [email protected]
Purpose: Asthma is a heterogeneous disease with phenotypic variations potentially influenced by dietary factors. This cross-sectional study aimed to estimate the prevalence of current allergic asthma (AA), characterize its phenotypic variants, and examine dietary associations with asthma manifestations among young Chinese adults in Singapore.
Patients and Methods: We assessed 10,544 young Chinese participants (mean age 22.3 ± 5.5 years; male: female = 0.74) using a standardized, investigator-administered questionnaire adapted from the International Study of Asthma and Allergies in Childhood. Current AA was defined as a history of doctor diagnosis with symptoms in the past 12 months and having allergic sensitization to common house dust mites. Dietary intake across 16 food groups was assessed using a semi-quantitative food frequency questionnaire. Multivariable logistic regression, adjusted for sociodemographic and lifestyle factors, examined dietary associations with AA outcomes.
Results: The prevalence of current AA was 5.24%. Among those with current AA, 67.0% (370/552) had mild, 21.7% (120/552) moderate, and 11.2% (62/552) severe asthma. Asthma was well-controlled in 60.7% (319/552), partly controlled in 39.3% (217/552), and poorly controlled in 2.9% (16/552). Common phenotypes included cough-variant (57.6%), wheezy variant (55.1%), and exercise-induced asthma (31.5%), with overlapping symptoms. Frequent intake (most or all days) of pulses (Adjusted odds ratio [AOR]: 0.65; 95% confidence intervals [CI]: 0.47– 0.89; p < 0.001), probiotic drinks (AOR: 0.69; 95% CI: 0.50– 0.94; p < 0.001), fruits (AOR: 0.47; 95% CI: 0.31– 0.71; p = 0.001), and vegetables (AOR: 0.58; 95% CI: 0.35– 0.99; p = 0.003) was associated with protective odds of current AA. Pulses were also associated with reduced odds of exacerbated and wheezy AA, while occasional (once or twice per week) intake of probiotic drinks was associated with reduced odds of cough-variant and wheezy AA.
Conclusion: While certain plant-based foods and probiotic drinks were associated with reduced odds of AA and its phenotypes, these findings should be interpreted with caution given the cross-sectional design. Longitudinal or interventional studies are needed to clarify causality and underlying mechanisms.
Keywords: associations, asthma, asthma phenotypes, dietary intake, epidemiology
Introduction
Asthma is a chronic inflammatory disease characterized by reversible airway obstruction, and recurrent respiratory symptoms, including wheezing, coughing, breathlessness, and chest tightness. Globally, asthma affects an estimated 262 million people, with prevalence ranging from 1% to 29% across regions.1 Despite advancements in diagnostic methods, underdiagnosis and misclassification remain significant challenges.2
Asthma is now recognized as a clinically heterogeneous disease comprising distinct phenotypes, such as exercise-induced asthma, cough-variant asthma, and wheezy asthma. These phenotypes differ in symptom patterns, triggers, severity and response to treatment, making phenotype-specific characterization essential for improving clinical outcomes.3 However, limited research has examined how modifiable factors, particularly dietary intake, influence these individual asthma phenotypes, beyond general associations with asthma risk.
Diet is increasingly recognized as a modifiable factor in asthma research. Evidence from observational studies suggests that consumption of fruits and vegetables may reduce systemic inflammation and influence gut-lung axis, potentially lowering asthma risk and severity.4–6 Beyond this, other dietary components – including saturated fats, omega-3 fatty acids, fish, fast food, and probiotics – have also been implicated. Probiotics may also reduce asthma symptoms and exacerbation frequency through gut microbiota modulation.7 Maternal fish consumption has been associated with lower risk of childhood wheeze and allergy.8 In contrast, frequent fast food intake was associated with increased asthma exacerbations.9 High saturated fat intake may promote airway inflammation, whereas omega-3 fatty acids exert anti-inflammatory effects.10 Despite these insights, few studies have assessed how intake of specific food groups relates to distinct asthma phenotypes in young adults, a period when lifestyle habits may shape long-term disease trajectories.11 A clearer understanding of these association between asthma manifestations and habitual food intake is needed to identify phenotype-specific associations and inform prevention strategies.
Therefore, this study aims to update asthma prevalence in Singapore and provide a detailed phenotypic characterization of asthma manifestations in a large, independent, clinically well-characterized cohort of Asian Chinese individuals from the Singapore/Malaysia Cross-sectional Genetics Epidemiology Study (SMCGES).12–14 Using the standardized International Study of Asthma and Allergies in Childhood (ISAAC) protocol,15 we examined asthma phenotypes and their clinical presentations, including severity (mild vs moderate-severe), persistence (recovered vs current), exacerbation status (well-controlled vs partly-to-poorly controlled), and symptom-specific variants. Building on our previous epidemiological work,14 this study explores detailed associations between dietary intake frequency of key food groups and specific asthma phenotypes, offering updated insights into the dietary modulation of clinically relevant asthma phenotypes.
Methods and Materials
Participants and Data Collection
Participants were recruited randomly from the National University of Singapore between 2005 and 2023, with no strict selection criteria other than the requirement that individuals could only participate once in the study. The study was conducted as per the Declaration of Helsinki and Good Clinical Practices. In accordance with local regulations, written informed consent from a parent or legal guardian was obtained for participants below 21 years of age, reflecting the legal age of adulthood in Singapore. This study reports the data from Singapore only (n = 14,002) and data from Malaysia will be analyzed and reported separately as asthma prevalence patterns in Malaysia differ from those in Singapore due to potential regional factors that remain poorly understood. Detailed information on the SMCGES cohort had been previously published.12–14,16–19
A validated investigator-administered questionnaire, adapted from the standardized protocol of the ISAAC, was used to collect data on demographics, income level (SGD), personal lifestyle habits (smoking and alcohol intake), dietary intake, anthropometric measurements (body mass index (BMI)), and personal medical and atopic histories.20 Of the initial cohort of 14,002 participants recruited from Singapore, exclusions were made for the following reasons: missing or invalid data on age and sex (n = 87), non-Chinese ethnicity (n = 1832), skin pick test (SPT) results (n = 96), BMI (n = 1143), and income information (n = 324). After these exclusions, a total of 10,544 participants (22.3 ± 5.5 years) were included in the final analysis (Figure 1). This exclusion was made to ensure a more homogenous study population, as asthma prevalence can vary across ethnic groups. Given that most Singapore’s population is of Chinese ethnicity,21 focusing on Chinese also allows for greater population homogeneity, which helps to reduce variability due to ethnic differences and facilitate clearer interpretation of associations. While this approach may limit generalizability, it minimizes confounding from ethnic-specific factors, supporting more targeted hypothesis generation within the largest ethnic subgroup.
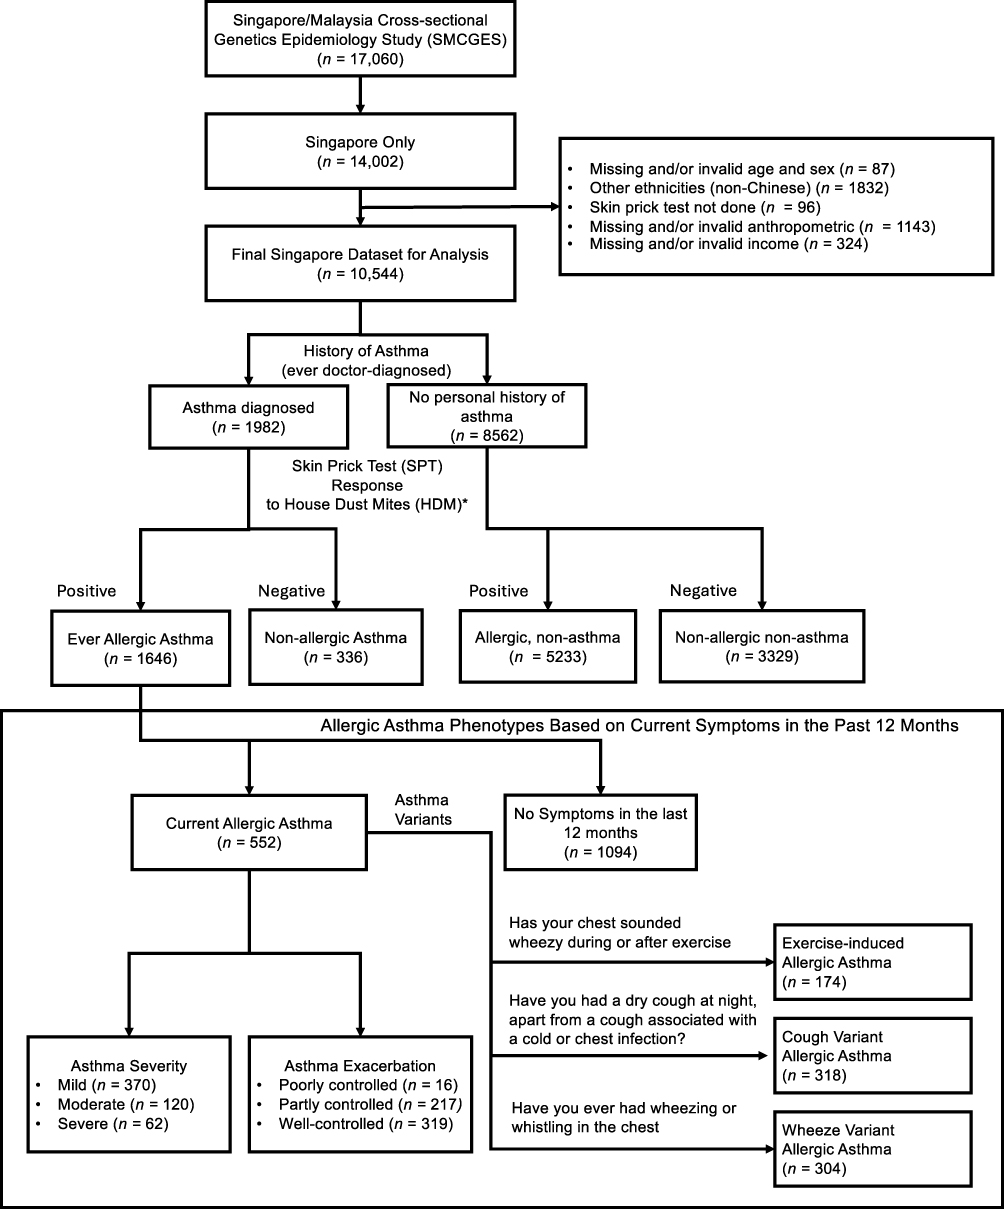 |
Figure 1 Flowchart depicting the classification of asthma phenotypes in a cohort of young adults from Singapore. Asthma variants are not mutually exclusive and participants may present with more than one variant concurrently. * Skin prick test (SPT) responses were assessed for Blomia tropicalis and Dermatophagoides pteronyssinus. Participants with a wheal diameter ≥3 mm compared to the negative saline control were classified as allergic-sensitized (SPT positive). |
Definition and Classification of Atopy, Asthma and Its Phenotypes
Atopy is a key immunological criterion in defining allergic asthma (AA), reflecting a predisposition to develop immunoglobulin E (IgE)-mediated responses to environmental allergens.22 In this study, atopy was assessed using SPT responses to Blomia tropicalis and Dermatophagoides pteronyssinus – the most prevalent and clinically relevant house dust mite (HDM) allergens in Singapore’s tropical environment.23–25 A positive SPT result was defined as a wheal diameter ≥3 mm larger than the negative saline control in response to either HDM allergen, with histamine as the positive control.
HDM sensitization was selected as the primary indicator of atopy based on three key considerations: (1) its high local prevalence;23–25 (2) its strong correlation with elevated serum allergen-specific IgE levels;26 and (3) its ability to capture the majority of atopic individuals, many of whom also exhibit co-sensitization to other allergens, including pollens and molds.27
Previous studies in this population have examined sensitization to other common indoor and outdoor allergens such as Elaeis guineensis (oil palm pollen), Curvularia spp. (fungus spores), as well as dog and cat dander – but found significantly lower sensitization rates and minimal contribution to AA risk.27 The SPT protocol followed previously validated methodologies.16–19 Among the 10,544 participants, 6879 (65.2%) were SPT-positive and 3665 (34.8%) were SPT-negative.
Asthma classification followed the standardized ISAAC protocols and the validated Global Initiative for Asthma (GINA) guidelines.20,28,29 Ever asthma (n = 1982) was defined via the question “Have you ever had asthma?” in capturing a history of doctor-diagnose asthma. Investigators were trained to confirm that participants had received a formal diagnosis from a Western-trained healthcare provider, thereby minimizing misclassification from self-diagnosis or symptom misinterpretation. This method is consistent with large-scale epidemiological practices and aligns with global standards, enhancing comparability across studies and clinical relevance.2,15,20 Among 1982 participants with ever asthma, allergic sensitization status was further used to differentiate AA (SPT-positive; n = 1646) from non-allergic asthma (SPT-negative; n = 336). To define current AA, we identified individuals who reported asthma symptoms in the past 12 months based on the question: “Have you had wheezing or whistling in the chest in the last 12 months?”. Of the 1646 ever AA individuals, 552 (33.5%) were classified as having current AA.
Individuals with no personal history of doctor-diagnosed asthma (n = 8562) were stratified based on allergic sensitization status into two control subgroups: (1) non-allergic, non-asthma controls (n = 3329) and (2) allergic non-asthma individuals (n = 5233). The non-allergic non-asthma group served as main reference group for examining associations with AA phenotypes.
To characterize asthma more precisely, we further examined asthma phenotypes and severity among individuals with current AA. Phenotypes were defined as follows: (1) wheezy AA variant (n = 304): reported wheezing or whistling in the chest, (2) cough AA variant (n = 318): dry coughing at night unrelated to a cold or chest infection and (3) exercise-induced AA (n = 174): wheezing during or after exercise.
Asthma severity was assessed by three indicators experienced in the past 12 months: (1) number of wheezing attacks, (2) frequency of sleep disturbances due to wheeze, and (3) speech limitations due to wheezing. Based on these, severity was classified as mild, moderate, or severe, consistent with respiratory epidemiology standards.28–30
Finally, we assessed asthma control and exacerbation status using an investigator-administered questionnaire adapted from core components of validated asthma control tools such as the Asthma Control Test and the Asthma Control Questionnaire.31,32 Participants were asked about the presence and frequency of asthma symptoms and management indicators in the past 12 months: (1) daytime or nighttime asthma attacks, (2) school absenteeism due to asthma, (3) increased healthcare utilization (clinic visits, emergency department visits, hospital admissions), (4) use of rescue medication (eg, salbutamol/Ventolin), (5) experience of shortness of breath and (6) overall perception of asthma control. Those who reported none were classified as having well-controlled AA (n = 319), those reporting occasional for any symptoms (1–2 episodes) were classified as partly controlled (n = 217), and those reporting frequent symptoms (≥3 episodes) were classified as poorly controlled AA (n = 16). Full details of the asthma outcome distributions are summarized in Supplemental Table 1.
Dietary Habits Assessment
Dietary intake was assessed using a semi-quantitative food frequency questionnaire (FFQ) adapted from the ISAAC Phase III study,33 a standardized and widely adopted tool in large-scale epidemiological research on asthma and allergic diseases. The FFQ evaluated the habitual frequency of consumption across 16 commonly consumed food groups using predefined response categories to ensure consistency, facilitate comparability, and reduce respondent burden. A 12-month reference period was used to capture long-term habitual intake, minimizing the influence of short-term dietary fluctuations. To enhance data quality, the FFQ was administered by trained personnel who guided participants in interpreting food groups and frequency options. Participants were asked,
Over the past 12 months, how often did you consume the following foods and beverages: Meat (e.g., beef, lamb, chicken, pork); Seafood (including fish); Fruit; Vegetables (leafy greens and root); Pulses (such as peas, beans, and lentils); Cereals (including bread); Rice; Butter; Margarine; Nuts; Potatoes; Milk; Eggs; Fast food (including burgers); Probiotics (including Yakult®, Vitagen®, or similar yoghurt drinks)?
For each food group, participants selected one of three intake frequencies: (1) never or only occasionally (<1 time/week), (2) once or twice per week, and (3) most or all days (≥3 times/week). These food groups were selected based on the original ISAAC study for their relevance in daily energy and nutrient intake, as well as their potential associations with asthma and allergic outcomes. The inclusion of probiotic drinks such as Yakult® and Vitagen® reflects both local consumption patterns and growing interest in their immunomodulatory role.7 Intake frequency categories were structured to capture meaningful variation in exposure while ensuring sufficient power for statistical analysis. The distribution of intake frequencies for each food groups is detailed in Supplemental Table 2.
Statistical Analysis
Logistic regression was used to model the associations between dietary intake and AA outcomes. Covariates included in the multivariable models were age (years), sex, BMI (Asian classification), income levels (SGD), alcohol consumption, smoking status, physical activity, and energy intake (kcal/serving/week). Information on energy intake was estimated using the United States Department of Agriculture National Nutrient Database, as previously described and published elsewhere.34 These variables were selected based prior epidemiological evidence and their potential role as confounders influencing both dietary exposure and asthma-related outcomes.5,14 Differences between categorical variables were assessed using the chi-square test. To assess the overall association between each dietary variable (modelled as a categorical variable with multiple intake levels) and AA, a likelihood ratio test was used. This test compares the full model including the dietary variable with a reduced model excluding it. The resulting p-value (nested p) indicates whether the dietary variable as a whole contributes significantly to the model.35 Unless otherwise specified, a p-value < 0.05 was considered statistically significant. Bonferroni correction was applied for multiple testing, with the adjusted significance threshold set at p < 0.003125 (0.05/16). All statistical analyses were conducted using R program version 2024.09.0–375 (RStudio Team, 2024).
Results
Participants Demographics
Table 1 summarizes the demographic characteristics of young Chinese adult participants in Singapore, comparing non-allergic non-asthma controls (n = 3329) with individuals diagnosed with current AA (n = 552). Participants with current AA were significantly younger (mean age: 19.8 ± 6.0 years) than controls (22.9 ± 6.3 years). A higher proportion of current AA participants were males (53.4%) compared to controls (29.7%). Socioeconomic differences were observed, with a significantly lower proportion of current AA participant reported a monthly income below SGD 2000 (16.7% vs 27.0%), while a higher proportion earned above SGD 6000 (34.1% vs 22.3%). The prevalence of overweight and obesity was modestly higher among those with current AA relative to controls (17.6% vs 15.2%). Also, a higher proportion of current AA participant reported non-drinking behaviour (60.3% vs 51.0%). Smoking status did not differ significantly between groups, with the majority of participants being non-smokers (97.7% in controls vs 96.7% in current AA).
 |
Table 1 Demographic Characteristics of Young Chinese Adult Participants from Singapore |
Characterization of Asthma Phenotypes
Of the 10,544 young Chinese participants, 18.8% reported ever having doctor-diagnosed asthma, with 15.6% classified as ever AA based on allergic sensitization. Among those with ever AA (n = 1646), 33.5% (552/1646) reported asthma symptoms in the past 12 months and were classified as current AA cases (Figure 1). Severity assessment amongst current AA showed 67.0% (370/552) had mild asthma, 21.7% (120/552) moderate, and 11.2% (62/552) severe. In terms of asthma control and exacerbation status, most cases with 60.7% were well-controlled (319/522), while 39.3% (217/552) were partly controlled and only a small subset of 2.9% (16/552) had poorly controlled asthma.
Among current AA, distinct clinical phenotypes were observed: 57.6% (418/552) had cough AA variant, 55.1% (304/552) had wheezy AA variant, and 31.5% (174/552) reported exercise-induced AA, with overlapping symptoms being common. About 13.8% (76/552) exhibited all three AA phenotypes. The most frequent combination was cough-variant AA and wheezy AA (13.9% (77/552)), followed by wheezy and exercise-induced AA (9.42% (52/552)) and cough-variant and exercise-induced asthma (3.08% (17/552)). Interestingly, cough-variant AA alone was the most prevalent phenotype (26.8% (148/552)), while wheezy AA alone accounted for 17.9% (99/552) of the cases. Exercise-induced AA alone was the least common, observed in only 5.25% (29/552) of individuals (Figure 2).
 |
Figure 2 Distribution of asthma variants among participants with current allergic asthma (n = 552). |
Diet-Asthma Associations
Ever and Current Allergic Asthma
In the adjusted model, frequent intake (most or all days) of pulses (Adjusted Odds Ratio [AOR]: 0.65; 95% Confidence Intervals [CI]: 0.47–0.89; p < 0.001), probiotic drinks (AOR: 0.69; 95% CI: 0.50–0.94; p < 0.001), fruits (AOR: 0.47; 95% CI: 0.31–0.71; p = 0.001), and vegetables (AOR: 0.58; 95% CI: 0.35–0.99; p = 0.003) was associated with lower odds of current AA (Figure 3). These associations remained robust and statistically significant after Bonferroni correction (nested p threshold < 0.003) and were consistent among individuals with HDM sensitization and doctor-diagnosed asthma (Supplemental Table 3).
 |
Figure 3 Association between intake frequency of 16 food groups and current allergic asthma in the Singapore/Malaysia Cross-sectional Genetics Epidemiology Study (SMCGES) (n = 10,544) cohort. Adjusted odds ratios (AORs) with 95% confidence intervals are presented. The dotted line at AOR = 1.00 indicates the reference. Analyses were adjusted for key covariates. Statistically significant associations after Bonferroni correction (nested p < 0.003125) are shown in bold. |
Nuts intake showed a nominal inverse association with current AA (p = 0.005), but it did not survive the multiple testing correction. While seafood intake showed a nominal overall risk association with current AA, the association did not reach statistical after Bonferroni correction. Interestingly, high-fat foods such as butter and margarine were positively associated with HDM sensitization and ever-AA, but not with current AA. No significant associations were observed between the intake of cereals, eggs, nuts, meat, rice, milk, pasta, potatoes, or fast food and current AA.
Asthma Persistence, Severity and Exacerbation
Among all food groups, frequent intake of pulses was the only dietary factor significantly associated with a lower odds of current exacerbated AA (AOR: 0.39; 95% CI: 0.22–0.69; p = 0.002) and moderate-severe AA (AOR: 0.47; 95% CI: 0.27–0.80; p = 0.006), although the latter did not remain significant after multiple testing correction. Additionally, occasional intake (once or twice per week) of probiotic drinks was inversely associated with moderate-severe AA (AOR: 0.57; 95% CI: 0.41–0.82; p = 0.002). No other food groups showed statistically significant associations with AA persistency or severity after adjustment (Supplemental Table 4).
Asthma Variants
Pulses intake was inversely associated with both cough and wheezy variants of AA, with a particularly pronounced effect observed for the wheezy variant (AOR: 0.53; 95% CI: 0.35–0.6680 p < 0.003). Similarly, probiotic drink intake was associated with lower odds of both cough and wheezy AA variants. While frequent intake of fruits showed a marginal inverse association with all three AA variants, none of these association remained statistically significance after correction for multiple comparisons (Supplemental Table 5).
Discussion
The current asthma prevalence observed in this cohort of young Chinese individuals, aligns with global estimates and reflects the sustained public health burden of asthma.36,37 Most asthma cases were identified to be allergic sensitized. About one-third exhibited current asthma symptoms, primarily characterized by wheezing and whistling, highlighting the chronic nature of the condition for a significant portion of individuals who do not experience symptom remission and continue to have asthma into adulthood. The classification of asthma into cough variant, wheezy variant, and exercise-induced variant further enhances our understanding of its heterogeneity. The frequent overlap of these variants also suggests that asthma exists as a spectrum of manifestations rather than a singular condition, necessitating phenotype-specific management approaches.38 Particularly, the most common co-occurrence of cough variant and wheezy variant may reflect a prevalent disease pattern, highlighting the need of comprehensive symptom assessment in clinical practice. Moreover, this frequent co-occurrence may indicate shared underlying mechanisms or common disease trajectory that required the need for integrated, phenotype-specific assessments in clinical settings.39 In contrast, the low prevalence of exercise-induced asthma could reflect either the potential of underreporting or a genuinely distinct epidemiological pattern in this cohort, warranting further investigation.
Although objective lung function testing (eg, spirometry) was not performed for the entire cohort due to logistical constraints, a well-defined subset of individuals with doctor-diagnosed asthma and current symptoms was subjected to spirometry, among whom 44.5% showed moderately reduced FEV₁ and 57.1% had small airway impairment (reduced FEF25–75), consistent with asthma-related airflow limitation. Moreover, since individuals typically seek medical attention during symptomatic episodes, doctor-diagnosed asthma serves as a reasonably accurate proxy for clinical asthma in population-based studies.
While our study utilized validated ISAAC-based criteria to classify asthma phenotypes, we were unable to assess biologic phenotypes such as eosinophilic asthma or Non-Steroidal Anti-inflammatory Drug-Exacerbated Respiratory Disease (N-ERD) due to the lack of biomarker or clinical trigger data (eg, NSAID sensitivity, sputum eosinophils).40,41 Although emerging evidence suggests that low-salicylate diets may benefit N-ERD patients by mitigating inflammatory responses,42 our FFQ was not designed to capture salicylate intake, and we lacked data on NSAID-triggered symptoms. As such, we were unable to evaluate these diet–phenotype associations. Current efforts to characterize these asthma phenotypes are ongoing, with detailed dietary profiling being incorporated as part of this work. Future studies integrating objective asthma phenotyping with comprehensive dietary assessments will be critical to clarify the role of specific dietary components, including salicylates, in these biologically distinct asthma endotypes.
While previous research has largely emphasized broad dietary patterns such as the Mediterranean diet,43,44 our study highlights the differential associations of specific food groups with current AA susceptibility and phenotypes. We began by examining intake frequencies of commonly consumed food groups as a foundational step, allowing for clearer identification of targeted associations. This approach may be more practical for public health interventions, where food-based guidance is easier for patients to understand than nutrient-based recommendations. However, the role of overall dietary patterns remains important and warrants further investigation using data-driven approaches such as principal component analysis to capture synergistic effects between foods.
The observed inverse associations between pulses and probiotic drinks with asthma odds are biologically plausible and align with emerging literature on diet-immune interactions. Pulses are a key source of fermentable fiber that can be metabolized by the gut microbiota into short-chain fatty acids like butyrate.45 These metabolites may modulate immune responses, including enhancing regulatory T cell activity and reducing airway inflammation – mechanisms increasingly linked to asthma control.46 Probiotic drinks may exert similar immunomodulatory effects by promoting gut microbial diversity and integrity, supporting the gut–lung axis, which is implicated in respiratory health.47–49 While both dietary components act through the gut microbiome, probiotics may more directly influence microbial composition, whereas pulses primarily provide substrates for fermentation. Compared to previous studies, our findings are consistent with reports suggesting benefits of fiber-rich and fermented foods in allergic diseases,50,51 but we further unrevealed associations with asthma severity and exacerbation in a general cohort of young Singapore Chinese adults. However, as existing evidence remains mixed and strain- or dose-specific in the case of probiotics, these results should be interpreted cautiously and require further mechanistic validation.52 Furthermore, our earlier findings on atopic dermatitis (AD) revealed a different dietary pattern, with high-fat foods such as butter, margarine and fast food increasing the associated risk of AD,16,53,54 while plant-based foods like fruits and vegetables lowered AD odds.17,18 This divergence in dietary associations between asthma and AD may reflect differences in organ-specific pathophysiology and underlying mechanisms. Although both conditions share a common inflammatory basis, asthma may be more responsive to immune modulation by gut-lung axis, while AD is characterized by skin barrier dysfunction.55,56 These differences highlight that while diet potentially influences allergic diseases, the key food groups and biological pathways involved may differ by condition.
Cross-reactivity between HDM and seafood allergens – particularly through the shared pan-allergen tropomyosin – has been reported in sensitized individuals.57,58 However, this immunologic cross-reactivity does not consistently translate into clinical allergy. In HDM-sensitized individuals, shellfish-specific IgE may often reflect serological cross-reactivity rather than true food sensitization.59 In our cohort, seafood intake was not significantly associated with current AA. It is plausible that dietary exposure to tropomyosin may be insufficient to trigger respiratory symptoms, possibly due to oral tolerance or limited clinical relevance. Importantly, our FFQ did not distinguish shellfish from other seafood, limiting our ability to assess the specific contribution of shellfish intake on AA risk. Also, preparation methods – which can denature tropomyosin and alter its allergenicity – were not captured. Future research should incorporate detailed dietary assessment, including specific seafood types and preparation methods, and immunological profiling to better clarify the role of cross-reactivity in asthma pathogenesis.
There were concerns that certain food additives, such as sulfites, exacerbate asthma in sensitive individuals.60 However, our analysis focused on broader dietary intakes rather than specific chemical exposures. As our FFQ did not capture data on food additives, we could not directly estimate sulfite exposure. Interestingly, fast food – often considered a potential dietary source of sulfites – showed no significant association with AA outcomes in our cohort. This may suggest that either additive exposure was insufficient to elicit clinical effects or that fast food is not a reliable proxy for sulfite intake. Nonetheless, future studies with more detailed nutritional profiling are needed to investigate such specific mechanisms, building on the population-level associations reported here.
Another limitation of our dietary assessment is the lack of information on daily portion counts, particularly for fruits and vegetables where multiple servings are recommended. While frequent intake (“most or all days”) likely reflects adequate consumption based on average serving sizes, the absence of quantitative detail may limit the accuracy of estimating true dietary adequacy and dose–response associations. However, preliminary validation within a separate cohort of randomized controlled trial of patients with AD demonstrated substantial agreement (Cohen’s kappa >0.6) between the investigator-administered simplified ISAAC FFQ and a 3-day food diary for fruits and vegetables intake. These preliminary findings suggest that the ISAAC FFQ may capture habitual intake in a manner comparable to the gold-standard dietary assessment method. Nonetheless, further validation in larger population-based cohorts is necessary to strengthen the robustness and generalizability of these findings.
The extended recruitment period (2005–2023) raises the possibility of a cohort effect, as dietary patterns, environmental exposures, and asthma management practices may have varied over time. However, our analyses within this cohort have shown that asthma prevalence remained relatively stable across recruitment years, suggesting minimal cohort-related variation in disease burden.14 Moreover, the biological effect of diet on asthma is expected to remain consistent, given the underlying immunological pathways involved. Importantly, standardized protocols for participant recruitment, ISAAC-based phenotyping, SPT, and dietary assessment were applied uniformly throughout the study period, helping to reduce methodological heterogeneity. Taken together, these factors suggest that any potential cohort effect is likely to be minimal.
The varying dietary associations across asthma phenotypes suggest that diet may influence asthma expression in a phenotype-specific manner. As asthma becomes more severe, factors like chronic inflammation and airway remodeling may become more dominant, potentially reducing the impact of diet on further disease progression.61 Environmental factors such as air pollution, allergen exposure, and respiratory infections may also play a more substantial role in driving asthma severity.5,62 These observations suggest that dietary interventions may be more effective when implemented in the earlier stages of asthma, potentially altering the disease’s trajectory before severe symptoms and structural changes develop.4 This highlights the need for longitudinal studies to better understand the timing and long-term effects of dietary changes on asthma progression and the development of various phenotypes.
The GUSTO (Growing Up in Singapore Towards Healthy Outcomes) and S-PRESTO (Singapore PREconception Study of long-Term maternal and child Outcomes) cohorts, both large-scale studies based in Singapore, present a valuable opportunity to investigate the relationship between diet and asthma in a prospective framework.63,64 These cohorts provide comprehensive data on maternal and child health, including dietary intake, which can be used to explore how early-life dietary factors may influence the development and progression of asthma.65 Future research utilizing these cohorts could shed light on the long-term effects of diet on asthma onset, exacerbations, and trajectory, offering valuable insights into the potential for dietary interventions to reduce asthma risk and improve outcomes in a diverse population.
Nonetheless, this study benefits from a large, well-characterized allergic cohort with distinct asthma phenotypes, enabling robust comparisons across diverse dietary intakes. The use of a standardized dietary assessment by ISAAC enhances the reliability and robustness of the findings, allowing for the identification of both protective and risk-associated foods. However, its cross-sectional design may limit causal inferences, and reverse causality remains a potential concern. Additionally, unmeasured confounders, such as cooking methods and food processing, may affect the results. The absence of biomarkers for dietary intake further limits validation of the findings. Future work could address these limitations by employing a longitudinal study design to better assess causality and reduce the risk of reverse causation. Incorporating objective biomarkers for dietary intake, such as blood metabolites, would enhance the validation of dietary data and mitigate the reliance on self-report. Additionally, accounting for cooking methods, differentiating between fresh and processed foods through more detailed dietary assessments or data collection could provide a clearer understanding of their impact. To further validate our findings, we plan to leverage a larger, independent cross-sectional cohort such as the Singapore MEC (Multi-Ethnic Cohort) to investigate the reproducibility of the diet-asthma associations.66
In conclusion, our study provided an updated overview of asthma prevalence and phenotype-specific dietary associations in Singapore, emphasizing the potential influence of dietary habits on current asthma severity and exacerbations. However, given the cross-sectional design and reliance on FFQ-based dietary assessment, the associations should be regarded as exploratory, with the aim of future validation in larger, independent cohorts using longitudinal designs and a more precise dietary measurement.
Abbreviations
AA, Allergic asthma; AD, Atopic dermatitis; AOR, Adjusted odds ratios; BMI, Body mass index; CI, Confidence intervals; FFQ, Food frequency questionnaire; GINA, Global Initiative for Asthma; HDM, House dust mites; IgE, Immunoglobulin E; ISAAC, International Study of Asthma and Allergies in Childhood; N-ERD, Non-steroidal Anti-inflammatory Drug Exacerbated Respiratory Disease; SMCGES, Singapore/Malaysia Cross-sectional Genetics Epidemiology Study; SPT, Skin prick test.
Data Sharing Statement
The data underlying this article will be shared on reasonable request to the corresponding author (F.T.C.).
Ethics Approval and Consent
This study was conducted in accordance with the principles of the Declaration of Helsinki and Good Clinical Practices, and in compliance with local regulatory requirements. Cross-sectional studies in Singapore were conducted on the National University of Singapore (NUS) campus annually between 2005 and 2023, under the approval of the Singapore NUS Institutional Review Board (NUS-IRB Reference Code: NUS-07-023, NUS-09-256, NUS-10-445, NUS-13-075, NUS-14-150, and NUS-18-036) and by the Helsinki declaration. Before the data collection, all participants involved signed a written informed consent form.
Acknowledgments
Jun Jie Lim and Zong Xun Huang are co-first authors for this study. We appreciate the contributions of all participants and their families involved in the SMCGES study. We would also like to extend our gratitude to all the current and past lab members who have contributed to the epidemiology collection.
Funding
F.T.C. received grants from the National University of Singapore (N-154-000-038-001 (E-154-00-0017-01); C141-000-077-001 (E-141-00-0096-01)), Singapore Ministry of Education Academic Research Fund (R-154-000-191-112; R-154-000-404-112; R-154-000-553-112; R-154-000-565-112; R-154-000-630-112; R-154-000-A08-592; R-154-000-A27-597; R-154-000-A91-592; R-154-000-A95-592; R154-000-B99-114), Biomedical Research Council (BMRC) (Singapore) (BMRC/01/1/21/18/077; BMRC/04/1/21/19/315; BMRC/APG2013/108), Singapore Immunology Network (SIgN-06-006; SIgN-08-020), National Medical Research Council (NMRC) (Singapore) (NMRC/1150/2008; OFIRG20nov-0033; MOH-001636 (OFLCG23may-0038, A-8002641-00-00)), National Research Foundation (NRF) (Singapore) (NRF-MP-2020-0004), Singapore Food Agency (SFA) (SFS_RND_SUFP_001_04; W22W3D0006), Singapore’s Economic Development Board (EDB) (A-8002576-00-00), and the Agency for Science Technology and Research (A*STAR) (Singapore) (H17/01/a0/008; and APG2013/108). This research is also supported by the National Research Foundation Singapore under its Open Fund-Large Collaborative Grant (MOH-001636) (A-8002641-00-00) and administered by the Singapore Ministry of Health’s National Medical Research Council. The funding agencies had no role in the study design, data collection and analysis, decision to publish, or preparation of the manuscript.
Disclosure
F.T.C. reports grants from the National University of Singapore, Singapore Ministry of Education Academic Research Fund, Singapore Immunology Network, National Medical Research Council (NMRC) (Singapore), Biomedical Research Council (BMRC) (Singapore), National Research Foundation (NRF) (Singapore), Singapore Food Agency (SFA), Singapore’s Economic Development Board (EDB), and the Agency for Science Technology and Research (A*STAR) (Singapore), during the conduct of the study; and consulting fees from Sime Darby Technology Centre; First Resources Ltd; Genting Plantation, Olam International, Musim Mas, and Syngenta Crop Protection, outside the submitted work. The other authors declare no competing interests in this work.
References
1. Vos T, Lim SS, Abbafati C, et al. Global burden of 369 diseases and injuries in 204 countries and territories, 1990–2019: a systematic analysis for the global burden of disease study 2019. Lancet. 2020;396(10258):1204–1222. doi:10.1016/S0140-6736(20)30925-9
2. Yuan L, Tao J, Wang J, et al. Global, regional, national burden of asthma from 1990 to 2021, with projections of incidence to 2050: a systematic analysis of the global burden of disease study 2021. EClinicalMedicine. 2025;80:103051. doi:10.1016/j.eclinm.2024.103051
3. Miller RL, Grayson MH, Strothman K. Advances in asthma: new understandings of asthma’s natural history, risk factors, underlying mechanisms, and clinical management. J Allergy Clin Immunol. 2021;148(6):1430–1441. doi:10.1016/j.jaci.2021.10.001
4. Alwarith J, Kahleova H, Crosby L, et al. The role of nutrition in asthma prevention and treatment. Nutr Rev. 2020;78(11):928–938. doi:10.1093/nutrit/nuaa005
5. Sio YY, Chew FT. Risk factors of asthma in the Asian population: a systematic review and meta-analysis. J Physiol Anthropol. 2021;40(1):22. doi:10.1186/s40101-021-00273-x
6. Hosseini B, Berthon BS, Wark P, Wood LG. Effects of fruit and vegetable consumption on risk of asthma, wheezing and immune responses: a systematic review and meta-analysis. Nutrients. 2017;9(4):341. doi:10.3390/nu9040341
7. Xie Q, Yuan J, Wang Y. Treating asthma patients with probiotics: a systematic review and meta-analysis. Tratamiento de pacientes asmáticos con probióticos: revisión sistemática y metaanálisis. Nutricion hospitalaria. 2023;40(4):829–838. doi:10.20960/nh.04360
8. Malmir H, Larijani B, Esmaillzadeh A. Fish consumption during pregnancy and risk of allergic diseases in the offspring: a systematic review and meta-analysis. Crit Rev Food Sci Nutr. 2022;62(27):7449–7459. doi:10.1080/10408398.2021.1914543
9. Valle K, Entwistle M, Bradman A, Brown P, Alcala E, Cisneros R. Fast-food consumption and asthma-related emergency room visits in California. J Asthma. 2025;62(4):647–654. doi:10.1080/02770903.2024.2429679
10. Venter C, Meyer RW, Nwaru BI, et al. EAACI position paper: influence of dietary fatty acids on asthma, food allergy, and atopic dermatitis. Allergy. 2019;74(8):1429–1444. doi:10.1111/all.13764
11. Bédard A, Li Z, Ait-Hadad W, et al. The role of nutritional factors in asthma: challenges and opportunities for epidemiological research. Int J Environ Res Public Health. 2021;18(6):3013. doi:10.3390/ijerph18063013
12. Lim JJ, Lim YYE, Ng JY, et al. An update on the prevalence, chronicity, and severity of atopic dermatitis and the associated epidemiological risk factors in the Singapore/Malaysia Chinese young adult population: a detailed description of the Singapore/Malaysia Cross-Sectional Genetics Epidemiology Study (SMCGES) cohort. World Allergy Organ J. 2022;15(12):100722. doi:10.1016/j.waojou.2022.100722
13. Wong QYA, Lim JJ, Ng JY, et al. Allergic rhinitis in Chinese young adults from the Singapore/Malaysia cross-sectional genetics epidemiology study (SMCGES) cohort: prevalence, patterns, and epidemiology of allergic rhinitis. World Allergy Organ J. 2022;15(10):100704. doi:10.1016/j.waojou.2022.100704
14. Wong QYA, Lim JJ, Ng JY, et al. An updated prevalence of asthma, its phenotypes, and the identification of the potential asthma risk factors among young Chinese adults recruited in Singapore. World Allergy Organ J. 2023;16(3):100757. doi:10.1016/j.waojou.2023.100757
15. Asher MI, Montefort S, Björkstén B, et al. Worldwide time trends in the prevalence of symptoms of asthma, allergic rhinoconjunctivitis, and eczema in childhood: ISAAC phases one and three repeat multicountry cross-sectional surveys [published correction appears in Lancet. 2007 Sep 29;370(9593):1128]. Lancet. 2006;368(9537):733–743. doi:10.1016/S0140-6736(06)69283-0
16. Lim JJ, Lim YYE, Ng JY, et al. Burgers, fast foods, and increased associated risk for atopic dermatitis: a cross-sectional study of dietary habits among young Chinese adults in Singapore/Malaysia. Dermatology. 2024;240(1):77–84. doi:10.1159/000533942
17. Lim JJ, Reginald K, Say YH, Liu MH, Chew FT. A dietary pattern of frequent plant-based foods intake reduced the associated risks for atopic dermatitis exacerbation: insights from the Singapore/Malaysia cross-sectional genetics epidemiology cohort. BMC Public Health. 2023;23(1):1818. doi:10.1186/s12889-023-16736-y
18. Lim JJ, Reginald K, Say YH, Liu MH, Chew FT. Frequent intake of high fiber and probiotic diets lowers risks associated with atopic dermatitis and house dust mite allergy: a cross-sequential study of young Chinese adults from Singapore and Malaysia. Eur J Nutr. 2024;64(1):38. doi:10.1007/s00394-024-03524-6
19. Lim JJ, Reginald K, Say YH, Liu MH, Chew FT. Associations between self-reported dietary intake and atopic dermatitis risk in young adults from Singapore and Malaysia. Clin Exp Allergy. 2025;55(6):493–495. doi:10.1111/cea.14629
20. Asher MI, Keil U, Anderson HR, et al. International study of asthma and allergies in childhood (ISAAC): rationale and methods. Eur Respir J. 1995;8(3):483–491. doi:10.1183/09031936.95.08030483
21. Singstat. Census of population 2020 statistical release. 2020. Available from https://www.singstat.gov.sg/-/media/files/publications/cop2020/sr1/findings.pdf.
22. Burrows B, Martinez FD, Halonen M, Barbee RA, Cline MG. Association of asthma with serum IgE levels and skin-test reactivity to allergens. N Engl J Med. 1989;320(5):271–277. doi:10.1056/NEJM198902023200502
23. Zhang L, Chew FT, Soh SY, et al. Prevalence and distribution of indoor allergens in Singapore. Clin Exp Immunol. 1997;27(8):876–885. doi:10.1111/j.1365-2222.1997.tb01227.x
24. Chew CFT, Zhang L, Ho TM, Lee BW. House dust mite fauna of tropical Singapore. Clin Exp Allergy. 1999;29(2):201–206. doi:10.1046/j.1365-2222.1999.00493.x
25. Chew FT, Lim SH, Goh DY, Lee BW. Sensitization to local dust-mite fauna in Singapore. Allergy. 1999;54(11):1150–1159. doi:10.1034/j.1398-9995.1999.00050.x
26. Andiappan AK, Puan KJ, Lee B, et al. Allergic airway diseases in a tropical urban environment are driven by dominant mono-specific sensitization against house dust mites. Allergy. 2014;69(4):501–509. doi:10.1111/all.12364
27. Sio YY, Victoria Nanong GA, Lim JA, et al. Sensitization to oil palm pollen associates with risks and severity of allergic diseases. World Allergy Organ J. 2024;17(1):100853. doi:10.1016/j.waojou.2023.100853
28. Rajvanshi N, Kumar P, Goyal JP. global initiative for asthma guidelines 2024: an update. Indian Pediatr. 2024;61(8):781–786. doi:10.1007/s13312-024-3260-7
29. Global Asthma Network. The global asthma network manual for global surveillance: prevalence, severity, management and risk factors: global Asthma Network. 2016.
30. Lai CK, Beasley R, Crane J, Foliaki S, Shah J, Weiland S, International Study of Asthma and Allergies in Childhood Phase Three Study Group. Global variation in the prevalence and severity of asthma symptoms: phase three of the International Study of Asthma and Allergies in Childhood (ISAAC). Thorax. 2009;64(6):476–483. doi:10.1136/thx.2008.106609
31. Nathan RA, Sorkness CA, Kosinski M, et al. Development of the asthma control test: a survey for assessing asthma control. J Allergy Clin Immunol. 2004;113(1):59–65. doi:10.1016/j.jaci.2003.09.008
32. Juniper EF, O’Byrne PM, Guyatt GH, Ferrie PJ, King DR. Development and validation of a questionnaire to measure asthma control. Europ resp J. 1999;14(4):902–907. doi:10.1034/j.1399-3003.1999.14d29.x
33. Ellwood P, Asher MI, García-Marcos L, et al. Do fast foods cause asthma, rhinoconjunctivitis and eczema? GLOBAL findings from the International Study of Asthma and Allergies in Childhood (ISAAC) phase three. Thorax. 2013;68(4):351–360. doi:10.1136/thoraxjnl-2012-202285
34. Lim JJ, Reginald K, Say YH, Liu MH, Chew FT. Evaluating the associations between dietary vitamin intake and atopic dermatitis: a regional cross-sequential study among singapore and malaysia young chinese adults. JID Innov. 2025;5(5):100387. doi:10.1016/j.xjidi.2025.100387
35. Dujardin B, Van den Ende J, Van Gompel A, Unger JP, Van der Stuyft P. Likelihood ratios: a real improvement for clinical decision making? Eur J Epidemiol. 1994;10(1):29–36. doi:10.1007/BF01717448
36. Wang Z, Li Y, Gao Y, et al. Global, regional, and national burden of asthma and its attributable risk factors from 1990 to 2019: a systematic analysis for the global burden of disease study 2019. Respir Res. 2023;24(1):169. doi:10.1186/s12931-023-02475-6
37. Asher MI, García-Marcos L, Pearce NE, Strachan DP. Trends in worldwide asthma prevalence. Europ resp J. 2020;56(6):2002094. doi:10.1183/13993003.02094-2020
38. Borish L. The immunology of asthma: asthma phenotypes and their implications for personalized treatment. Ann Allergy Asthma Immunol. 2016;117(2):108–114. doi:10.1016/j.anai.2016.04.022
39. Kuruvilla ME, Lee FE, Lee GB. Understanding asthma phenotypes, endotypes, and mechanisms of disease. Clin Rev Allergy Immunol. 2019;56(2):219–233. doi:10.1007/s12016-018-8712-1
40. Coumou H, Bel EH. Improving the diagnosis of eosinophilic asthma. Exp Rev Respir Med. 2016;10(10):1093–1103. doi:10.1080/17476348.2017.1236688
41. Kowalski ML, Agache I, Bavbek S, et al. Diagnosis and management of NSAID-Exacerbated Respiratory Disease (N-ERD)-a EAACI position paper. Allergy. 2019;74(1):28–39. doi:10.1111/all.13599
42. Jura-Szoltys E, Rymarczyk B, Gawlik R, Glück J. Low-salicylate diet in patients with non-steroidal anti-inflammatory drug-exacerbated respiratory disease: personalization of indications to dietary treatment. Int Arch Allergy Immunol. 2025;186(1):67–74. doi:10.1159/000539917
43. Vassilopoulou E, Guibas GV, Papadopoulos NG. Mediterranean-type diets as a protective factor for asthma and atopy. Nutrients. 2022;14(9):1825. doi:10.3390/nu14091825
44. Koumpagioti D, Boutopoulou B, Moriki D, Priftis KN, Douros K. Does adherence to the mediterranean diet have a protective effect against asthma and allergies in children? A systematic review. Nutrients. 2022;14(8):1618. doi:10.3390/nu14081618
45. Kadyan S, Sharma A, Arjmandi BH, Singh P, Nagpal R. Prebiotic potential of dietary beans and pulses and their resistant starch for aging-associated gut and metabolic health. Nutrients. 2022;14(9):1726. doi:10.3390/nu14091726
46. Sasaki M, Suaini NHA, Afghani J, et al. Systematic review of the association between short-chain fatty acids and allergic diseases. Allergy. 2024;79(7):1789–1811. doi:10.1111/all.16065
47. Liu A, Ma T, Xu N, et al. Adjunctive probiotics alleviates asthmatic symptoms via modulating the gut microbiome and serum metabolome. Microbiology Spectrum. 2021;9(2):e0085921. doi:10.1128/Spectrum.00859-21
48. Sadrifar S, Abbasi-Dokht T, Forouzandeh S, et al. Immunomodulatory effects of probiotic supplementation in patients with asthma: a randomized, double-blind, placebo-controlled trial. Allergy Asthma Clin Immunol. 2023;19(1):1. doi:10.1186/s13223-022-00753-4
49. Song XL, Liang J, Lin SZ, et al. Gut-lung axis and asthma: a historical review on mechanism and future perspective. Clin Transl Allergy. 2024;14(5):e12356. doi:10.1002/clt2.12356
50. Dębińska A, Sozańska B. Fermented food in asthma and respiratory allergies-chance or failure? Nutrients. 2022;14(7):1420. doi:10.3390/nu14071420
51. Halnes I, Baines KJ, Berthon BS, MacDonald-Wicks LK, Gibson PG, Wood LG. Soluble fibre meal challenge reduces airway inflammation and expression of GPR43 and GPR41 in asthma. Nutrients. 2017;9(1):57. doi:10.3390/nu9010057
52. Balan D, Baral T, Manu MK, Mohapatra AK, Miraj SS. Efficacy of probiotics as adjuvant therapy in bronchial asthma: a systematic review and meta-analysis. Allergy Asthma Clin Immunol. 2024;20(1):60. doi:10.1186/s13223-024-00922-7
53. Lim JJ, Reginald K, Say YH, Liu MH, Chew FT. A dietary pattern for high estimated total fat amount is associated with enhanced allergy sensitization and atopic diseases among Singapore/Malaysia young Chinese adults. Int Arch Allergy Immunol. 2023;184(10):975–984. doi:10.1159/000530948
54. Lim JJ, Reginald K, Say YH, Liu MH, Chew FT. Exploratory analyses of frequent high-fat food intake in diets and its association with increased odds of atopic dermatitis in Singapore and Malaysia Young Chinese adults. Br J Nutr. 2025;133(7):1–28. doi:10.1017/S0007114525000716
55. Hill DA, Spergel JM. The atopic march: critical evidence and clinical relevance. Ann Allergy Asthma Immunol. 2018;120(2):131–137. doi:10.1016/j.anai.2017.10.037
56. Yaneva M, Darlenski R. The link between atopic dermatitis and asthma- immunological imbalance and beyond. Asthma Res Pract. 2021;7(1):16. doi:10.1186/s40733-021-00082-0
57. Shafique RH, Inam M, Ismail M, Chaudhary FR. Group 10 allergens (tropomyosins) from house-dust mites may cause covariation of sensitization to allergens from other invertebrates. Allergy Rhinol. 2012;3(2):e74–e90. doi:10.2500/ar.2012.3.0036
58. Papia F, Bellia C, Uasuf CG. Tropomyosin: a panallergen that causes a worldwide allergic problem. Allergy Asthma Proc. 2021;42(5):e145–e151. doi:10.2500/aap.2021.42.210057
59. Hollstein MM, Schuppe MC, Hahn KK, et al. Tropomyosin-based cross-reactivity and asymptomatic shellfish sensitization in patients with perennial allergy. Frontiers in Allergy. 2025;6:1598583. doi:10.3389/falgy.2025.1598583
60. Vally H, Misso NL. Adverse reactions to the sulphite additives. Gastroenterol Hepatol Bed Bench. 2012;5(1):16–23.
61. National asthma education and prevention program, third expert panel on the diagnosis and management of asthma. expert panel report 3: guidelines for the diagnosis and management of asthma. 2007 aug. section 2, definition, pathophysiology and pathogenesis of asthma, and natural history of asthma. Bethesda (MD): National Heart, Lung, and Blood Institute (US). Available from: https://www.ncbi.nlm.nih.gov/books/NBK7223/.
62. Murrison LB, Brandt EB, Myers JB, Hershey GKK. Environmental exposures and mechanisms in allergy and asthma development. J Clin Invest. 2019;129(4):1504–1515. doi:10.1172/JCI124612
63. Soh SE, Tint MT, Gluckman PD, et al. Cohort profile: Growing Up in Singapore Towards healthy Outcomes (GUSTO) birth cohort study. Int J Epidemiol. 2014;43(5):1401–1409. doi:10.1093/ije/dyt125
64. Loo EXL, Soh SE, Loy SL, et al. Cohort profile: Singapore Preconception Study of Long-Term Maternal and Child Outcomes (S-PRESTO). EurJ Epidemiol. 2021;36(1):129–142. doi:10.1007/s10654-020-00697-2
65. Chong MF, Godfrey KM, Gluckman P, et al. Influences of the perinatal diet on maternal and child health: insights from the GUSTO study. Proc Nutr Soc. 2020;79(3):253–258. doi:10.1017/S0029665119001526
66. Whitton C, Wong YHM, van Dam RM. Longitudinal associations of marital, parenting, and employment transitions with weight gain in a multi-ethnic asian population aged 21 years and above. Int J Environ Res Public Health. 2021;18(15):8115. doi:10.3390/ijerph18158115
 © 2025 The Author(s). This work is published and licensed by Dove Medical Press Limited. The
full terms of this license are available at https://www.dovepress.com/terms
and incorporate the Creative Commons Attribution
- Non Commercial (unported, 4.0) License.
By accessing the work you hereby accept the Terms. Non-commercial uses of the work are permitted
without any further permission from Dove Medical Press Limited, provided the work is properly
attributed. For permission for commercial use of this work, please see paragraphs 4.2 and 5 of our Terms.
© 2025 The Author(s). This work is published and licensed by Dove Medical Press Limited. The
full terms of this license are available at https://www.dovepress.com/terms
and incorporate the Creative Commons Attribution
- Non Commercial (unported, 4.0) License.
By accessing the work you hereby accept the Terms. Non-commercial uses of the work are permitted
without any further permission from Dove Medical Press Limited, provided the work is properly
attributed. For permission for commercial use of this work, please see paragraphs 4.2 and 5 of our Terms.