Back to Journals » Journal of Multidisciplinary Healthcare » Volume 14
A Cross-Sectional Study on the Combined Effect of Body Weight and Coffee Consumption on Serum Levels of Leptin, Vitamin B12, and Folic Acid in Healthy Young Adult Males
Authors Hasoun LZ ![]() , Khader HA, Abu-Taha MI, Mohammad BA
, Khader HA, Abu-Taha MI, Mohammad BA ![]() , Abu-Samak MS
, Abu-Samak MS ![]()
Received 7 November 2020
Accepted for publication 22 February 2021
Published 15 March 2021 Volume 2021:14 Pages 639—650
DOI https://doi.org/10.2147/JMDH.S290990
Checked for plagiarism Yes
Review by Single anonymous peer review
Peer reviewer comments 2
Editor who approved publication: Dr Scott Fraser
Luai Z Hasoun,1 Heba A Khader,2 May Ibrahim Abu-Taha,1 Beisan A Mohammad,3 Mahmoud S Abu-Samak1
1Department of Clinical Pharmacy and Therapeutics, Applied Science Private University, Amman, Jordan; 2Department of Clinical Pharmacy and Pharmacy Practice, Faculty of Pharmaceutical Sciences, The Hashemite University, Zarqa, Jordan; 3Department of Pharmaceutical Sciences, Fakeeh College for Medical Sciences, Jeddah, Kingdom of Saudi Arabia
Correspondence: Luai Z Hasoun
Department of Clinical Pharmacy and Therapeutics, Applied Science Private University, Al Arab St. 21, Amman, 11931, Jordan
Tel +962 6 5609999 (Ext 1836)
Fax +962 6 5232899
Email [email protected]
Purpose: Studies on the effect of body weight and coffee consumption on leptin, vitamin B12, and folic acid are scarce and conflicting. This study investigates the effect of body weight and/or coffee consumption rate on the serum levels of these molecules in healthy young adult males.
Patients and Methods: This observational cross-sectional study was carried out at the faculty of pharmacy, Applied Science Private University (ASU), Amman, Jordan, from July to September 2020. Young healthy males were invited to participate in the study and fill a questionnaire regarding lifestyle habits including coffee consumption during the last 3 months, medical history, and anthropometric measurements. Depending on BMI and extent of coffee consumption, participants were divided into 4 groups; normal body weight and moderate coffee consumption (NW/MCC) group; normal body weight and heavy coffee consumption (NW/HCC) group; overweight and moderate coffee consumption (OW/MCC) group; overweight and heavy coffee consumption (OW/HCC) group. Serum samples were taken to measure leptin, vitamin B12, and folic acid levels in addition to morning and midnight salivary cortisol and dehydroepiandrosterone (DHEA) samples.
Results: Healthy males (n = 122) aged 18 to 26 years continued participation in this study. Serum levels of leptin in NW/MCC, NW/HCC, OW/MCC, OW/HCC groups were 5.93, 5.75, 14.86, 16.79 ng/mL, respectively. Serum levels of vitamin B12 in these groups were 356.09, 402.71, 334.25, 331.05 pg/mL, respectively. While, the serum levels of folic acid were 8.92, 10.27, 10.12, 10.47 ng/mL, respectively. Body weight was positively associated with leptin (p = 0.00), negatively associated with vitamin B12 (p = 0.047), and not associated with folic acid (p = 0.235). Coffee consumption rate had no significant effect on leptin, vitamin B12, or folic acid. Finally, the combination of body weight and coffee consumption had no significant effect on leptin, vitamin B12, or folic acid.
Conclusion: There was no possible synergistic effect between body weight and coffee consumption rate on leptin, vitamin B12, or folic acid levels. However, overweight was associated with higher leptin, lower vitamin B12, and no change in folic acid levels.
Trial Registration: This trial was registered at clinicaltrials.gov as NCT04488731.
Keywords: leptin, vitamin B12, folic acid, homocysteine, body weight, coffee consumption, BMI, obesity, overweight
Introduction
People’s lifestyles keep changing in several aspects including types of foods and drinks they consume. Reliance on fast food and high-calorie drinks and diets is increasing nowadays and this consequently has expanded the prevalence of weight gain and obesity globally.1 Obesity is a chronic medical problem that affects approximately 500 million adults worldwide.2,3 It is a major risk factor for several diseases such as type 2 diabetes mellitus (T2DM), dyslipidemia, coronary heart diseases, hypertension, osteoarthritis, and some types of cancer.4–6 Another aspect of changing lifestyle is the increase in coffee consumption rate (CCR) which is now one of the most consumed beverages universally.7,8 A 2019 coffee consumer trends report by the National Coffee Association shows that 63% of US adults drink coffee daily with an average consumption of 3.1 cups/day.7 In Europe, the average coffee intake is 5 kg/year with Finland being the highest with a consumption rate of 11 kg/year.8
Coffee’s effect on health has attracted great attention9–11 because it is associated with a lower risk of cardiovascular and liver diseases, T2DM, obesity, inflammation, and certain types of cancer. It has also been associated with lower mortality rates.8,12–14 Multiple studies have shown that the daily consumption of four or more cups of coffee is correlated with a lower risk of T2DM.15 Other studies demonstrated that one cup of coffee daily resulted in a 15% reduction in risk of death from chronic liver disease.16 Coffee consumption was also related to longer telomeres and slower cellular aging17 with beneficial effects for Alzheimer’s disease and cognitive impairment.18 On the other hand, several studies did not rule out CCR as a significant risk factor for coronary heart disease,19,20 and some cross-sectional studies found a positive association between CCR and total cholesterol (TC).21 Similarly, a large cohort study observed a positive association between CCR and all-cause mortality in men and women younger than 55 years and suggested that younger people must avoid heavy coffee consumption (>4 cups daily).22 Moreover, previous studies showed that heavy coffee intake increases homocysteine, a known risk factor for coronary and peripheral vascular disease,23 while abstention from coffee reduces it.24 The controversy between the beneficial and harmful effects of coffee may be due to multiple ingredients present in the coffee, such as caffeine, diterpenes, and chlorogenic acid that have different biological actions.20 Besides that, it was suggested there is a J-shaped relationship between CCR and health outcomes in which moderate consumption is beneficial, whereas heavy consumption is detrimental.21,22
Leptin, an adipokine hormone,25,26 plays an important role in the regulation of appetite, energy expenditure by inhibiting hunger and reducing food intake, which in turn diminishes the body weight (BW) and fat storage in adipocytes.25,27 Moreover, leptin is involved in the regulation of sexual maturity and reproduction, cardiovascular functions, metabolisms, and stress response.26,28,29 Circulating leptin levels are directly proportional to the amount of body fat and weight,25 and the levels increase with age and decrease during fasting and starvation.30 Obesity is associated with high levels of leptin, which is considered as an important obesity marker.31 However, leptin resistance occurs, leading to the inability to reach satiety despite high-energy stores and high levels of leptin. Excess leptin has been associated with many obesity-related diseases, such as hypertension, cardiovascular diseases, and infertility.26 Some studies claimed that caffeine, a major constituent in coffee, has anti-obesity properties through stimulation of sympathetic nervous which leads to increased thermogenesis and fat oxidation and possibly down-regulation of leptin release.32 However, studies on the effect of CCR on leptin are rare and conflicting, and more investigation is required.2
Folic acid and vitamin B12 are other examples of endogenous molecules that are essential for many biochemical processes in the human body. They are related to each other in a metabolic pathway called folate-dependent one-carbon metabolism.33 In this pathway, folic acid is a precursor for the biologically active form of folate known as tetrahydrofolate, which is necessary for every cell for the synthesis of DNA, RNA, and proteins.34 On the other hand, vitamin B12 in this one-carbon metabolism acts as an important cofactor for an enzyme called methionine synthase. This enzyme converts homocysteine to methionine utilizing methyl group from 5-methyl tetrahydrofolate, the most abundant form of folate in the human body.33,35 This step is important in formation of S-adenosyl methionine (SAM) a methyl donor needed in various metabolic pathways and in decreasing homocysteine level, a known risk factor for coronary and peripheral vascular diseases that increases during coffee consumption.36 Folate deficiency has been implicated in neural tube birth defects, anemia, vascular disease, cancer, and neurological disorders.34,37,38 Vitamin B12 deficiency causes megaloblastic anemia and neurological functions impairment leading to peripheral neuropathy, cognitive decline.39,40
Leptin, vitamin B12, and folate play important roles in the development of obesity.31,41–43 It has been found that overweight young men are more likely to have a risk for vitamin B12 deficiency.43 Moreover, obese subjects were found to have higher plasma homocysteine than non-obese controls and the serum leptin levels are positively related to these homocysteine levels44 but negatively related to folate.42 Recently, a study conducted on young males observed, regardless of smoking behavior, that CCR was positively associated with vitamin B12 and folic acid levels.45 On the other hand, studies on the effect of CCR on leptin, as a main obesity marker, are scarce and controversial.11,14,32,46 Furthermore, a potential synergistic association between CCR and vitamin B12 levels on obesity markers, particularly leptin, is not clear in overweight and obese young men. Expected changes in serum leptin levels may clarify some of the ambiguity resulted from the interrelationship between CCR and body weight. Therefore, the current study was designed to evaluate the combined effect of body weight and CCR on serum levels of leptin, vitamin B12, and folic acid in healthy young adult males. Moreover, several hematological and biochemical parameters were measured in our study to determine which of them affect the associations of interest.
Patients and Methods
Study Design
This observational cross-sectional study was carried out at the faculty of pharmacy, Applied Science Private University (ASU), Amman, Jordan, from July to September 2020. Young male bachelor’s and master’s students between the age of 18–26 years were invited to participate in the study through social media. Inclusion criteria for the study were male, ASU students between 18 and 26 years of age, and not having any acute or chronic illnesses. While, the exclusion criteria were a person who used any drug or supplement intermittently or continuously during the period of three months before the commencement of the study; recent dieting; or weight change of more than 5 kg in the past 3 months. The study was conducted according to the Declaration of Helsinki for the protection of human subjects and approved by the IRB and ethics committee at ASU with IRB approval number 2020-PHA-19. Moreover, the protocol of this study was registered in ClinicalTrials.gov with approval number NCT04488731. All participants were informed about study purposes, requirements, benefits and risks, and freedom to quit from the study at any time and then signed written consent forms. Then, participants with a help from research assistants filled a validated comprehensive questionnaire regarding lifestyle habits including coffee consumption45,47 during the last 3 months, medical history, and anthropometric measurements. Participants were considered to have normal weight (NW) if BMI is between 18.5 and 24.9 and overweight (OW) if the BMI is between 25 and 29.9 kg/m2. Regarding the extent of coffee consumption, participants were considered moderate coffee consumers (MCC) if they drink 1–2 cups/day and heavy coffee consumers (HCC) if they drink ≥3 cups/day. Depending on BMI and CCR, participants were divided into 4 groups; normal body weight and moderate coffee consumption (NW/MCC) group; normal body weight and heavy coffee consumption (NW/HCC) group; overweight and moderate coffee consumption (OW/MCC) group; overweight and heavy coffee consumption (OW/HCC) group. A non-coffee consumers group was not included in this study because only five subjects were not consuming coffee, and this number was not considered statistically reliable to be a control group. Moreover, these subjects were even supposed to be distributed into NW and OW control groups. Blood and saliva samples were taken from participants in each group for measurement of hematological and biochemical parameters, and determination of the effect of BMI and CCR on serum levels of leptin, vitamin B12, and folic acid.
The required sample size for this study was calculated using popular sample size calculators such as the one used by Creative Research Systems (www.surveysystem.com/sscalc.htm). Based on that and at a confidence level of 95% and margin of error of 10% for a population size equal to 3000 ASU students at the time of the study, the required sample size will be around 100 participants. Similar sample size was also adopted in previous studies.2,45
Anthropometric Measurements
Body weight was measured with a digital balance with subjects in a fasted state, and after emptying their bladder. Height was measured using a stadiometer while standing without shoes. BMI was calculated as weight (kilograms) divided by height (meters) squared.
Measurement and Standardization of Coffee Exposure
Data on coffee intake were obtained by asking participants through questionnaires about the type, amount, and frequency of coffee intake. Unfiltered Turkish and Brazilian coffee are the most consumed types of coffee in Jordan and most of the participants drink these types of coffee. A cup of coffee is prepared by mixing 1–2 teaspoons (5–10 grams) of fine coffee powder with 150 mL −200 mL of boiling water resulting in an amount of approximately 100–200 mg caffeine per cup. If a participant consumes a different type of coffee, the number of cups will be estimated in a standardized way depending on caffeine label claim (ie, each 150 mg caffeine is considered equivalent to 1 cup of coffee in our study).
Samples and Analysis
Blood and Saliva Samples
Fasting blood samples were collected from participants at 8 a.m. in serum tubes with a clot activator (VACUETTE TUBE Serum Separator Clot Activator, from Greiner Bio-One International, Frickenhausen, Germany). Obtained serum was divided into several Eppendorf tubes (1 mL each) and stored at −20°C until time of analysis. Serum leptin levels were measured using an enzyme immunoassay kit (DRG Diagnostics, Marburg, Germany). Vitamin B12 and folic acid levels were determined by electrochemiluminescence immunoassay (ECLIA) kits using Cobas analyzer (Roche Diagnostics, Switzerland).
Serum levels of triglycerides, total cholesterol, and high-density lipoprotein cholesterol (HDL) were determined using enzymatic colorimetric tests (Linear Chemicals, Barcelona, Spain). Low-density lipoprotein cholesterol (LDL) was calculated using Friedwald’s formula. Fasting blood glucose was measured by One Touch® meter (LifeScan, CA, USA).
Morning and night salivary cortisol and DHEA levels were measured by an enzyme-linked immunosorbent assay (ELISA) (SLV-2930 and SLV-3012, respectively, DRG International, NJ, USA). Procedures for salivary sample collection, separation, and storing were performed in accordance with similar study.48 All analyses were performed at Ibn Al-haytham medical laboratories, Amman, Jordan.
Blood Cell Counts and Hematological Parameters
Blood samples were collected into EDTA tubes. Complete blood count was performed using Cobas Micros-18 OT (LaRoche, France) for determination of total leukocytes count, differential leukocyte count, platelets count, hemoglobin, hematocrit, and red blood cells indices.
Statistical Analysis
The statistical analyses were performed using IBM SPSS Statistics version 21 (New York, USA). Descriptive statistics for the study anthropometric and biochemical data were expressed as mean ± Std. deviation. The significance of BMI and coffee consumption alone and in combination on the levels of leptin, vitamin B12, and folic acid in study groups was tested by two-way ANOVA using f-test. Multivariate analyses using stepwise multiple linear regressions were performed to test the effect of study independent variables such as anthropometric, hematological, and biochemical parameters on the serum levels of leptin, vitamin B12, and folic acid as dependent variables. In all tests, the results were considered statistically significant when p < 0.05.
Results
A total number of 137 young adult male students at age of 18 to 26 years responded to the invitation for study participation and filled the necessary questionnaire about their lifestyle habits including coffee consumption, medical history, and anthropometric measurements. Six subjects were excluded because of their medical history, drug intake, not drinking coffee, or refusal to pursue participation in the study. The remaining 131participants were enrolled and subdivided into four groups according to their BMI and CCR. The groups were as follows: NW/MCC group, NW/HCC group, OW/MCC group, OW/HCC group. Nine participants were dropped from the study because of insufficient amounts of saliva samples required for analysis (Figure 1). The total number of participants who continued the study was 122. The mean age was 22.03 ± 1.62 years, and the mean BMI was 25.68 ± 4.1 kg/m2 (range 18.5–40.0). Anthropometric, hematological, and biochemical parameters for all study participants are presented in Table 1. Approximately 54% have normal BW according to BMI and 46% are overweight. Sixty percent of participants were moderate coffee consumers, while 40% were heavy coffee consumers (Table 2). The final number and percentage of participants in each group were NW/MCC (n = 38, 31.1%), NW/HCC (n = 28, 23.0%), OW/MCC (n = 35, 28.7%), OW/HCC (n = 21, 17.2%).
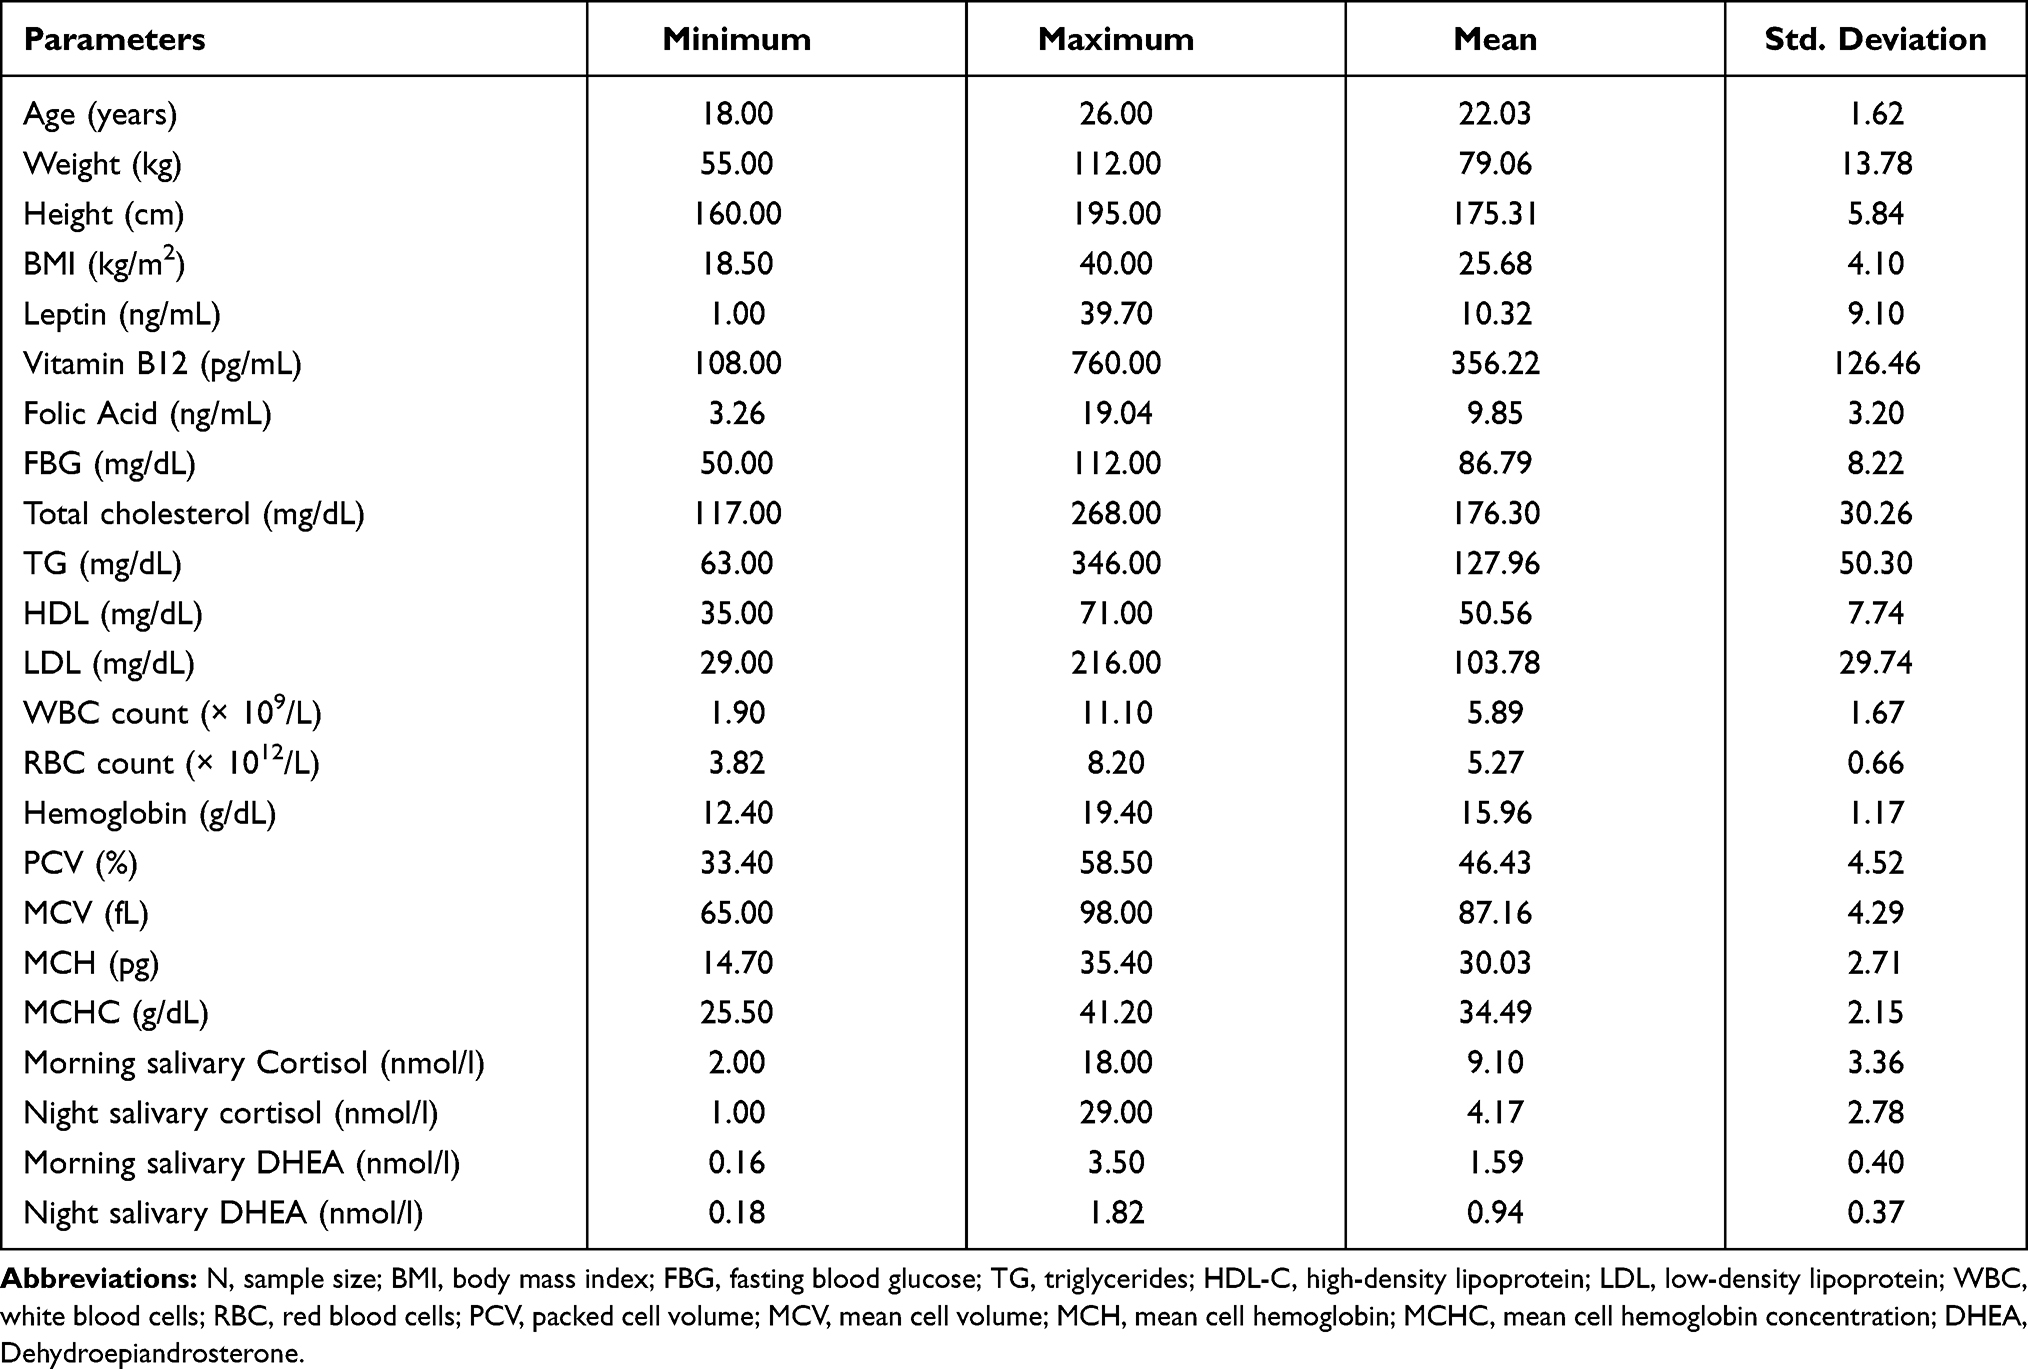 |
Table 1 Anthropometric, Hematological and Biochemical Parameters for All Study Participants (N=122) |
 |
Table 2 Categorical Distribution of Study Participants According to the BMI and Coffee Consumption Rate |
 |
Figure 1 Study flowchart. Abbreviations: N, sample size; NW/MCC, participants with normal body weight and moderate coffee consumption; NW/HCC, participants with normal body weight and heavy coffee consumption; OW/MCC, overweight participants with moderate coffee consumption; OW/HCC, overweight participants with heavy coffee consumption. Notes: aSix subjects were excluded from the study because of medical history, drug intake, or refusal to pursue participation in the study. bNine subjects were dropped from the study because of insufficient saliva samples. |
The Effect of BMI and Coffee Consumption on Serum Levels of Leptin
The mean serum leptin level in all study participants regardless of BW or CCR is 10.32 ng/mL. While, the mean leptin level is 5.85 ng/mL in participants with normal BW and 15.58 ng/mL in overweight participants. On the other hand and regardless of BW, the level of leptin is 10.21 ng/mL in participants with moderate coffee consumption and 10.48 ng/mL in participants with heavy coffee consumption (Table 3A).
 |
Table 3 (A) Comparative Serum Levels of Leptin in Different Study Groups Classified According to BMI and Coffee Consumption Rate. (B) Two-Way ANOVA Analysis for the Effect of BMI and Coffee Consumption Alone and in Combination on the Serum Levels of Leptin |
To investigate the significance of the effect of BMI, CCR, and the interaction between BMI and CCR together on leptin levels, a two-way ANOVA test was conducted (Table 3B). The results showed that there was only a significant effect of BMI on leptin (P-value < 0.001), while CCR has no significant effect (p = 0.544). The interaction between BMI and CCR also has no significant effect on leptin levels (P-value = 0.466). Participants with higher BMI have higher leptin levels demonstrated the significant effect of BMI on leptin.
The Effect of BMI and Coffee Consumption on Serum Levels of Vitamin B12
The mean serum vitamin B12 level in all study participants regardless of BW or CCR is 356.22 pg/mL. The mean levels of vitamin B12 were higher in NW participants than their peers in the OW group (375.87 vs 333.05 pg/mL). On the other hand and regardless of BW, the mean level of vitamin B12 is 345.62 pg/mL in participants with moderate coffee consumption and 372.00 pg/mL in participants with heavy coffee consumption (Table 4A).
 |
Table 4 (A) Serum Levels of Vitamin B12 in Different Study Groups Classified According to BMI and Coffee Consumption. (B) Two-Way ANOVA Analysis for the Effect of BMI and Coffee Consumption Alone and in Combination on the Serum Levels of Vitamin B12 |
The significance of the effect of BMI, coffee, and the interaction between BMI and coffee together on vitamin B12 levels was tested using two-way ANOVA (Table 4B). Only BMI had a significant effect on vitamin B12 levels (P-value = 0.046). Conversely, the proximity of the vitamin B12 levels in NW/MCC and NW/HCC groups and in OW/MCC and OW/HCC groups supports the non-significant effect of the extent of coffee consumption on vitamin B12 levels.
The Effect of BMI and Coffee Consumption on Serum Levels of Folic Acid
The mean folic acid level in all participants included in the study is 9.84 ng/mL (Table 5A). Moderate coffee consumers with normal body mass index (NW/MCC) have a level of 8.92 ng/mL, while the heavy coffee consumers have a level of 10.27 ng/mL (NW/HCC). On the other hand, OW/MCC and OW/HCC groups have the level of 10.12 and 10.47 ng/mL, respectively.
 |
Table 5 (A) Comparison of Serum Levels of Folic Acid in Different Study Groups Subdivided According to BMI and Coffee Consumption. (B) Two-Way ANOVA Analysis for the Effect of BMI and Coffee Consumption Alone and in Combination on the Serum Levels of Folic Acid |
Two-way ANOVA test (Table 5B) shows that the effects of BMI, coffee and the interaction between BMI and coffee together on folic acid are not significant (P-values= 0.235, 0.152, and 0.398, respectively).
Multivariate Associations Between Study Independent Variables and Serum Levels of Leptin, Vitamin B12, and Folic Acid
To determine the anthropometric, hematological, and biochemical factors that influence leptin, vitamin B12, folic acid in all study groups, multiple linear regressions through stepwise method were performed (Table 6).
 |
Table 6 The Multivariate Association Between Study Independent Variables and Serum Levels of Leptin, Vitamin B12, and Folic Acid for All Study Groups Using Multiple Linear Regression (Stepwise Method) |
NW/MCC Group
Stepwise regression analysis in NW/MCC group indicated there is an influential relationship and a significant effect of the independent variable night salivary DHEA (N-DHEA) on leptin levels according to the multiple linear regression model indicators (R= 0.375, R2= 0.141, P-value = 0.020). This model by its predictor N-DHEA explained 14.1% of the variance in leptin levels in NW/MCC group.
Vitamin B12 in this NW/MCC group was significantly influenced by morning salivary DHEA (M-DHEA) and RBC count according to the second multiple linear regression model indicators (R=0.538, R2=0.290, P-value= 0.003). The second multiple linear regression model by its predictors explained approximately 29% of the variance in B12 levels in this group.
Folic acid levels in this group were not influenced by any factor from the anthropometric and biochemical parameters measured in this study.
NW/HCC Group
None of the measured anthropometric and biochemical parameters has a significant influence on the levels of leptin. On the other hand, vitamin B12 and folic acid affect each other interchangeably. Vitamin B12 in this NW/MCC group was significantly influenced by folic acid (R= 0.490, R2 = 0.240, P-value= 0.008). Folic acid explained 24.0% of the variance in vitamin B12 levels in this group. Similarly, only vitamin B12 significantly affects folic acid levels where 24.0% of the variance in folic acid levels is explained by vitamin B12.
OW/MCC Group
There is an influential and a significant effect of the independent variables weight, height, and WBC on leptin levels (P-value < 0.001). These predictors explained approximately 54.9% of the variance in leptin levels. Vitamin B12 levels in this group were not influenced by any factor from the anthropometric and biochemical parameters measured in this study. Regarding folic acid, the independent variables WBC, morning cortisol (M-COR) have a significant effect on folic acid levels (28.3% of the variance, P-value = 0.005).
OW/HCC Group
Stepwise regression analysis in this group showed a significant effect of the independent variables weight, and age on leptin (approximately 69% of the variance, P-value < 0.001). Vitamin B12 levels also in this group were not affected by any parameter measured in this study. While, 28.2% of the variance in folic acid levels was due to PCV (P-value = 0.013).
Discussion
The current study showed that the combination of BW with CCR has no effects on the serum levels of leptin, vitamin B12, or folic acid. A significant positive association between serum leptin and BW seen in this study was independent of CCR. On the other hand, serum vitamin B12 was significantly and negatively associated with BW.
The levels of serum leptin in OW groups were 270% higher than those levels in NW groups (15.58 vs 5.85 ng/mL). The levels of leptin in our NW groups were near to the levels obtained in a Japanese cross-sectional study where 3317 subjects with BMI 23 kg/m2 had leptin levels of 4.6 ng/mL.14 Leptin levels in our study are positively related to BMI and this is consistent with results obtained from a study performed on Greek men where the levels of leptin in men with a BMI > 30 kg/m2 were 170% higher than in men with a BMI < 27 kg/m2.11 Our results support that leptin is an important marker of obesity27,46 where its expression in obese subjects is, on average, 2-fold higher than that in lean individuals.26,49 Moreover, our results comply with a previous cross-sectional study conducted on Jordanian youth males that revealed obese and overweight subjects had high leptin levels and these levels were positively associated with parental history of T2DM.50
The levels of serum leptin in NW and OW groups were not affected by CCR; moderate coffee consumers had similar levels to those who are heavy coffee consumers. These results were in line with the results from a previous study by Lagiou et al who did not notice any relation between leptin and coffee drinking, alcohol consumption, or smoking in elderly men.11 Another large population-based cross-sectional study on Caucasian participants, 3000 women and 2500 men, aged 35–74 found no relationships between leptin and caffeine, alcohol consumption, and physical activity.51 Similarly, CCR did not cause a significant change in leptin in a German-controlled clinical trial performed on 47 habitual coffee drinkers.8
On the other hand, several studies showed a negative relationship between leptin and coffee consumption. Two cohort studies of 15,551 women and 7397 men of US health professionals found that coffee drinkers of ≥4 cups/day had lower leptin compared with nondrinkers.32 A Japanese cross-sectional study on adult men and women found a significant inverse association between CCR and leptin.52 A Swiss study including 76 overweight and moderately obese subjects aged 18–60 during the weight maintenance period disclosed an inverse association between leptin and coffee consumption for 3 months in women but not men.2 Another large study on Japanese workers found a non-significant association between coffee consumption and leptin, but this association became inversely significant after excluding confounding variables.14 The inverse association between leptin and coffee consumption in these studies was possibly attributed to caffeine, which causes an increase in thermogenesis, fat oxidation, and hepatic metabolism of leptin.2,32 In our study, the combined effect of BW and CCR on leptin was not significant because the statistical significance of the BW effect was weakened by the non-statistical significance of coffee consumption.
Regardless of CCR, another important finding of this study was that vitamin B12 levels were lower in OW groups than in NW groups, although the levels in both were within the normal reference range (180–914 pg/mL). This indicates a negative association between vitamin B12 and BMI, whereas folic acid levels were not associated with BMI in these groups. This is consistent with the results of an American cross-sectional study of 9075 participants aged ≥ 20 years that showed that serum vitamin B12 concentrations were lower among obese adults compared with non-obese adults.24 Another study performed on 1252 Iranian patients with BMI ≥ 40 kg/m2 showed also BMI was adversely associated with vitamin B1253 which is similar to the outcome of many other studies.43,54 Conversely, a recent meta-analysis of 16 studies also found no association between BMI and folate55 while, a Thai study found overweight and obese subjects had lower folic acid, higher homocysteine, and no significant difference in vitamin B12 compared to their normal weight controls.56 A different trend was noticed where both vitamin B12 and folic acid are negatively associated with BMI in a study of 1131 Mexican American children included in NHANES 2001–2004.41
Our study also determined that CCR had no effect on the levels of vitamin B12 and folic acid in young adult males. The literature in this aspect is limited; however, a cohort study of 10,601 healthy, middle-aged Norwegian men and women demonstrated that coffee consumption did not cause a change in the levels of vitamin B12, but it caused a dose-dependent reduction in plasma folate accompanied with an increase in levels of homocysteine.57 Another Japanese cohort study on pregnant women not receiving folate supplements revealed a negative relation between serum folate and caffeine intake. The possible explanation for this relation was due to either the diuretic effect of caffeine on folate or its effect in increasing homocysteine58 that consumes folate and vitamin B12 during conversion to methionine.59 Furthermore, some studies observed that folic acid supplements decreased the homocysteine increasing effect of filtered coffee60 and others showed that abstention from filtered coffee reduces the concentrations of plasma homocysteine and serum cholesterol, which are risk factors for cardiovascular diseases.24 Several studies have suggested that caffeine consumption during pregnancy has many potential negative effects on the fetus, including neural tube defects. Therefore, the World Health Organization (WHO) guidelines indicate that pregnant women should limit the caffeinated beverages intake to 3–4 cups a day.59 In contrast, a recent observational study performed on young males to evaluate the effect of cigarette smoking and coffee consumption on vitamin B12, folic acid, and lipid profile showed a non-significant increase in vitamin B 12 and folic acid in heavy coffee consumers compared to moderate consumers regardless of their smoking behavior.45 However, in our study, the no change in vitamin B12 and folic acid with coffee consumption could be due to the presence of hepatic stores of folate and vitamin B1233,35 that keep replenishing61 the blood if a reduction happens to them with coffee consumption.
Stepwise multivariate analysis (Table 6) showed that leptin levels are significantly and inversely associated with N-DHEA in NW/MCC group; and significantly associated with weight, height, and WBC count in OW/MCC group; weight and age in OW/HCC group. These findings agree with the literature where DHEA has anti-obesogenic effect62 and leptin is negatively associated with DHEA48 and DHEA replacement decreases serum leptin levels.63 The dependence of leptin on weight and height is in agreement with the positive association between BMI and leptin established in our study groups. The stepwise analysis also indicates that age positively affects the levels of leptin and this was attributed in several studies to age-related changes in fat mass.30,51
Finally, in our study, vitamin B12 and folic acid are associated with hematological parameters, such as PCV, RBC, WBC count, and these relations were also seen in the literature.64 In NW/HCC group, vitamin B12 and folic acid were significantly and positively related to each other. It is known that folates work closely with vitamin B12 in folate-dependent one-carbon metabolism, and the interrelationship between their levels, as appeared in our study, can be explained by the methyl trap hypothesis that states, vitamin B12 deficiency can lead to lowered activity and levels of methionine synthetase. The decrease in activity and levels of this enzyme causes functional folates deficiency. This happens by decreasing formation of tetrahydrofolate (THF) whereas trapping an increased proportion of 5-methyl tetrahydrofolate (5-MTHF). 5-MTHF is a poor substrate for folylpolyglutamate synthetase, an enzyme required for synthesis and tissue storage of folate as folylpolyglutamates, and because of this trap, a decreased retention of folates by tissues and subsequent deficiency in body stores occur.65
Study Limitations
This study has some potential limitations to be considered. First, daily coffee consumption estimates based on participants’ claim of coffee cups number consumed rather than the measurement of caffeine intake. Moreover, due to the insufficient number of subjects who were non-coffee consumers our study did not include this group. Second, the participants in this study were only young males. However, this could be an advantage in avoiding the possible effect of age and gender variability on the results. Third, erythrocyte (RBC) folate level is considered a better indicator of body folate stores66 but in this study, we measured only serum folate levels.
Conclusion
Our study showed that the combination of body weight and coffee consumption had no effect on the levels of leptin, vitamin B12, and folic acid. However, overweight was associated with higher leptin, lower vitamin B12, no change in folic acid levels. While, coffee consumption alone seems to be safe with no detrimental effects on the levels of these endogenous molecules.
Data Sharing Statement
The authors are willing to share the entire individual participant data collected during the trial, after de-identification. These data will be available beginning 3 months and ending 5 years after article publication. Requests should be directed to [email protected]. To gain access, data requestors are needed to sign a data access agreement.
Author Contributions
All authors made a substantial contribution to the work reported, whether that is in the conception, study design, execution, acquisition of data, analysis and interpretation, or these areas; took part in drafting, revising or critically reviewing the article; gave final approval of the version to be published; have agreed on the journal to which the article has been submitted; and agree to be accountable for all aspects of the work.
Disclosure
The authors report no conflicts of interest for this work.
References
1. Wilcox S, Sharpe PA, Turner-McGrievy G, Granner M, Baruth M. Frequency of consumption at fast-food restaurants is associated with dietary intake in overweight and obese women recruited from financially disadvantaged neighborhoods. Nutr Res. 2013;33(8):636–646. doi:10.1016/j.nutres.2013.05.007
2. Westerterp-Plantenga MS, Lejeune MP, Kovacs EM. Body weight loss and weight maintenance in relation to habitual caffeine intake and green tea supplementation. Obes Res. 2005;13(7):1195–1204. doi:10.1038/oby.2005.142
3. Sun Y, Sun M, Liu B, et al. Inverse association between serum vitamin B12 concentration and obesity among adults in the United States. Front Endocrinol (Lausanne). 2019;10:414. doi:10.3389/fendo.2019.00414
4. Hubert HB, Feinleib M, McNamara PM, Castelli WP. Obesity as an independent risk factor for cardiovascular disease: a 26-year follow-up of participants in the framingham heart study. Circulation. 1983;67(5):968–977. doi:10.1161/01.CIR.67.5.968
5. Kromhout D. Body weight, diet, and serum cholesterol in 871 middle-aged men during 10 years of follow-up (the Zutphen study). Am J Clin Nutr. 1983;38(4):591–598. doi:10.1093/ajcn/38.4.591
6. Eckel RH, Kahn SE, Ferrannini E, et al. Obesity and type 2 diabetes: what can be unified and what needs to be individualized? J Clin Endocrinol Metab. 2011;96(6):1654–1663. doi:10.1210/jc.2011-0585
7. National Coffee Association. National Coffee Drinking Trends. New York: National Coffee Association; 2019.
8. Kempf K, Herder C, Erlund I, et al. Effects of coffee consumption on subclinical inflammation and other risk factors for type 2 diabetes: a clinical trial. Am J Clin Nutr. 2010;91(4):950–957. doi:10.3945/ajcn.2009.28548
9. Hu G, Jousilahti P, Peltonen M, Bidel S, Tuomilehto J. Joint association of coffee consumption and other factors to the risk of type 2 diabetes: a prospective study in Finland. Int J Obes. 2006;30(12):1742–1749. doi:10.1038/sj.ijo.0803341
10. Sofi F, Conti AA, Gori AM, et al. Coffee consumption and risk of coronary heart disease: a meta-analysis. Nutr Metab Cardiovasc Dis. 2007;17(3):209–223. doi:10.1016/j.numecd.2006.07.013
11. Lagiou P, Signorello LB, Mantzoros CS, Trichopoulos D, Hsieh CC, Trichopoulou A. Hormonal, lifestyle, and dietary factors in relation to leptin among elderly men. Ann Nutr Metab. 1999;43(1):23–29. doi:10.1159/000012763
12. Ding M, Satija A, Bhupathiraju SN. Association of coffee consumption with total and cause-specific mortality in 3 large prospective cohorts. Circulation. 2015;132(24):2305–2315. doi:10.1161/CIRCULATIONAHA.115.017341
13. Gunter MJ, Murphy N, Cross AJ, et al. Coffee drinking and mortality in 10 European countries: a multinational cohort study. Ann Intern Med. 2017;167(4):236–247. doi:10.7326/M16-2945
14. Yamashita K, Yatsuya H, Muramatsu T, Toyoshima H, Murohara T, Tamakoshi K. Association of coffee consumption with serum adiponectin, leptin, inflammation and metabolic markers in Japanese workers: a cross-sectional study. Nutr Diabetes. 2012;2(4):e33. doi:10.1038/nutd.2012.6
15. van Dam RM, Hu FB. Coffee consumption and risk of type 2 diabetes: a systematic review. JAMA. 2005;294(1):97–104. doi:10.1001/jama.294.1.97
16. Heath RD, Brahmbhatt M, Tahan AC, Ibdah JA, Tahan V. Coffee: the magical bean for liver diseases. World J Hepatol. 2017;9(15):689–696. doi:10.4254/wjh.v9.i15.689
17. Tucker LA. Caffeine consumption and telomere length in men and women of the national health and nutrition examination survey (NHANES). Nutr Metab. 2017;14(1):10. doi:10.1186/s12986-017-0162-x
18. Arendash GW, Mori T, Cao C, et al. Caffeine reverses cognitive impairment and decreases brain amyloid-beta levels in aged Alzheimer’s disease mice. J Alzheimers Dis. 2009;17(3):661–680. doi:10.3233/JAD-2009-1087
19. Christensen L, Murray T. A review of the relationship between coffee consumption and coronary heart disease. J Community Health. 1990;15(6):391–408. doi:10.1007/BF01324301
20. Cornelis MC, El-Sohemy A. Coffee, caffeine, and coronary heart disease. Curr Opin Clin Nutr Metab Care. 2007;10(6):745–751. doi:10.1097/MCO.0b013e3282f05d81
21. Ding M, Bhupathiraju SN, Satija A, van Dam RM, Hu FB. Long-term coffee consumption and risk of cardiovascular disease: a systematic review and a dose-response meta-analysis of prospective cohort studies. Circulation. 2014;129(6):643–659. doi:10.1161/CIRCULATIONAHA.113.005925
22. Liu J, Sui X, Lavie CJ, et al. Association of coffee consumption with all-cause and cardiovascular disease mortality. Mayo Clin Proc. 2013;88(10):1066–1074. doi:10.1016/j.mayocp.2013.06.020
23. Grubben MJ, Boers GH, Blom HJ. Unfiltered coffee increases plasma homocysteine concentrations in healthy volunteers: a randomized trial. Am J Clin Nutr. 2000;71(2):480–484. doi:10.1093/ajcn/71.2.480
24. Christensen B, Mosdol A, Retterstol L, Landaas S, Thelle DS. Abstention from filtered coffee reduces the concentrations of plasma homocysteine and serum cholesterol–a randomized controlled trial. Am J Clin Nutr. 2001;74(3):302–307. doi:10.1093/ajcn/74.3.302
25. Park HK, Ahima RS. Physiology of leptin: energy homeostasis, neuroendocrine function and metabolism. Metabolism. 2015;64(1):24–34. doi:10.1016/j.metabol.2014.08.004
26. Almabhouh F, Isyraqiah F, Muhammad F, Ibrahim H, Singh H. Leptin: a pleiotropic factor in physiology. JCHS. 2019;4(2):31–57. doi:10.24191/jchs.v4i2.7551
27. Weigle DS, Cummings DE, Newby PD, et al. Roles of leptin and ghrelin in the loss of body weight caused by a low fat, high carbohydrate diet. J Clin Endocrinol Metab. 2003;88(4):1577–1586. doi:10.1210/jc.2002-021262
28. Patterson CM, Villanueva EC, Greenwald-Yarnell M, et al. Leptin action via LepR-b Tyr1077 contributes to the control of energy balance and female reproduction. Mol Metab. 2012;1(1–2):61–69. doi:10.1016/j.molmet.2012.05.001
29. Bassi M, Furuya WI, Zoccal DB, et al. Control of respiratory and cardiovascular functions by leptin. Life Sci. 2015;125:25–31. doi:10.1016/j.lfs.2015.01.019
30. Calbet JA, Ponce-González JG, Pérez-Suárez I, de la Calle Herrero J, Holmberg HC. A time-efficient reduction of fat mass in 4 days with exercise and caloric restriction. Scand J Med Sci Sports. 2015;25(2):223–233. doi:10.1111/sms.12194
31. Abu-Samak M, Yousef AM, Al-Jarie A, et al. Lipid and hematological parameters in hyperleptinemic healthy Arab male youth in Jordan. Pak J Biol Sci. 2011;14(5):344–350. doi:10.3923/pjbs.2011.344.350
32. Hang D, Kværner AS, Ma W, et al. Coffee consumption and plasma biomarkers of metabolic and inflammatory pathways in US health professionals. Am J Clin Nutr. 2019;109(3):635–647. doi:10.1093/ajcn/nqy295
33. Stover PJ. Physiology of folate and vitamin B12 in health and disease. Nutr Rev. 2004;62(6 Pt 2):S3–12. doi:10.1111/j.1753-4887.2004.tb00070.x
34. Ames BN, Wakimoto P. Are vitamin and mineral deficiencies a major cancer risk? Nat Rev Cancer. 2002;2(9):694–704. doi:10.1038/nrc886
35. Hasoun LZ, Bailey SW, Outlaw KK, Ayling JE. Effect of serum folate status on total folate and 5-methyltetrahydrofolate in human skin. Am J Clin Nutr. 2013;98(1):42–48. doi:10.3945/ajcn.112.057562
36. Bailey LB, Gregory Iii JF. Folate metabolism and requirements. J Nutr. 1999;129(4):779–782. doi:10.1093/jn/129.4.779
37. Morrison HI, Schaubel D, Desmeules M, Wigle DT. Serum folate and risk of fatal coronary heart disease. JAMA. 1996;275(24):1893–1896. doi:10.1001/jama.1996.03530480035037
38. Tucker KL, Qiao N, Scott T, Rosenberg I, Spiro A
39. Allen LH. Vitamin B-12. Adv Nutr. 2012;3(1):54–55. doi:10.3945/an.111.001370
40. Hvas AM, Nexo E. Diagnosis and treatment of vitamin B12 deficiency–an update. Haematologica. 2006;91(11):1506–1512.
41. Gunanti IR, Marks GC, Al-Mamun A, Long KZ. Low serum vitamin B-12 and folate concentrations and low thiamin and riboflavin intakes are inversely associated with greater adiposity in Mexican American children. J Nutr. 2014;144(12):2027–2033. doi:10.3945/jn.114.201202
42. Thakre RR, Abhang SA, Naik SS. Study of vitamin b12, folate and adipokines with respect to insulin resistance (IR) and anthropometry (birth weight and BMI) in children (age 10–20 years). EJPMR. 2018;5(2):563–569.
43. Abu-Samak M, Khuzaie R, Abu-Hasheesh M, Jaradeh M, Fawzi M. Relationship of vitamin B12 deficiency with overweight in male Jordanian youth. J Appl Sci. 2008;8(17):3060–3063. doi:10.3923/jas.2008.3060.3063
44. Narin F, Atabek ME, Karakukcu M, et al. The association of plasma homocysteine levels with serum leptin and apolipoprotein B levels in childhood obesity. Ann Saudi Med. 2005;25(3):209–214. doi:10.5144/0256-4947.2005.209
45. Abu-Taha M, Dagash R, Mohammad BA, Basheiti I, Abu-Samak MS. Combined effect of coffee consumption and cigarette smoking on serum levels of vitamin B12, folic acid, and lipid profile in young male: a cross-sectional study. Int J Gen Med. 2019;12:421–432. doi:10.2147/IJGM.S213737
46. Izadi V, Larijani B, Azadbakht L. Is coffee and green tea consumption related to serum levels of adiponectin and leptin? Int J Prev Med. 2018;9(1):106. doi:10.4103/ijpvm.IJPVM_37_14
47. Abu-Samak MS, AbuRuz ME, Masa’Deh R, Khuzai R, Jarrah S. Correlation of selected stress associated factors with vitamin D deficiency in Jordanian men and women. Int J Gen Med. 2019;12:225–233. doi:10.2147/IJGM.S198175
48. Abu-Samak M, Hasoun LZ, Abu-Taha MI, Awwad SH, Mohammad BA. Salivary cortisol, testosterone and DHEA in healthy university male students with hyperleptinemia: retrospective cohort study. eJBio. 2018;14(1):36–42.
49. Fried SK, Ricci MR, Russell CD, Laferrère B. Regulation of leptin production in humans. J Nutr. 2000;130(12):3127s–3131s. doi:10.1093/jn/130.12.3127S
50. Abu-Hasheesh MO, Abu-Samak MS, Al-Matubsi HY, Jaradeh MS, Jarrah SS, Khuzaie RF. Association of parental history of type 2 diabetes mellitus with leptin levels in Jordanian male youths. Saudi Med J. 2010;31(8):882–886.
51. Marques-Vidal P, Bochud M, Paccaud F, Mooser V, Waeber G, Vollenweider P. Distribution of plasma levels of adiponectin and leptin in an adult Caucasian population. Clin Endocrinol (Oxf). 2010;72(1):38–46. doi:10.1111/j.1365-2265.2009.03628.x
52. Pham NM, Nanri A, Yasuda K, et al. Habitual consumption of coffee and green tea in relation to serum adipokines: a cross-sectional study. Eur J Nutr. 2015;54(2):205–214. doi:10.1007/s00394-014-0701-4
53. Arshad M, Jaberian S, Pazouki A, Riazi S, Rangraz MA, Mokhber S. Iron deficiency anemia and megaloblastic anemia in obese patients. Rom J Intern Med. 2017;55(1):3–7. doi:10.1515/rjim-2016-0046
54. Baltaci D, Deler MH, Turker Y, Ermis F, Iliev D, Velioglu U. Evaluation of serum vitamin B12 level and related nutritional status among apparently healthy obese female individuals. Niger J Clin Pract. 2017;20(1):99–105. doi:10.4103/1119-3077.181401
55. Wiebe N, Field CJ, Tonelli M. A systematic review of the vitamin B12, folate and homocysteine triad across body mass index. Obes Rev. 2018;19(11):1608–1618. doi:10.1111/obr.12724
56. Tungtrongchitr R, Pongpaew P, Tongboonchoo C, et al. Serum homocysteine, B12 and folic acid concentration in Thai overweight and obese subjects. Int J Vitam Nutr Res. 2003;73(1):8–14. doi:10.1024/0300-9831.73.1.8
57. Ulvik A, Vollset SE, Hoff G, Ueland PM. Coffee consumption and circulating B-vitamins in healthy middle-aged men and women. Clin Chem. 2008;54(9):1489–1496. doi:10.1373/clinchem.2008.103465
58. Carlsen SM, Jacobsen G, Vatten L, Romundstad P. In pregnant women who smoke, caffeine consumption is associated with an increased level of homocysteine. Acta Obstet Gynecol Scand. 2005;84(11):1049–1054. doi:10.1111/j.0001-6349.2005.00822.x
59. Otake M, Sakurai K, Watanabe M, Mori C. Association between serum folate levels and caffeinated beverage consumption in pregnant women in Chiba: the Japan environment and children’s study. J Epidemiol. 2018;28(10):414–419. doi:10.2188/jea.JE20170019
60. Strandhagen E, Landaas S, Thelle DS. Folic acid supplement decreases the homocysteine increasing effect of filtered coffee. A randomised placebo-controlled study. Eur J Clin Nutr. 2003;57(11):1411–1417. doi:10.1038/sj.ejcn.1601703
61. Hasoun LZ, Bailey SW, Outlaw KK, Ayling JE. Rearrangement and depletion of folate in human skin by ultraviolet radiation. Br J Dermatol. 2015;173(4):1087–1090. doi:10.1111/bjd.13885
62. Korbonits M, Trainer PJ, Nelson ML, et al. Differential stimulation of cortisol and dehydroepiandrosterone levels by food in obese and normal subjects: relation to body fat distribution. Clin Endocrinol (Oxf). 1996;45(6):699–706. doi:10.1046/j.1365-2265.1996.8550865.x
63. Fichna M, Fichna P, Gryczyńska M, Czarnywojtek A, Żurawek M, Ruchała M. Steroid replacement in primary adrenal failure does not appear to affect circulating adipokines. Endocrine. 2015;48(2):677–685. doi:10.1007/s12020-014-0388-6
64. Ganji V, Kafai MR. Hemoglobin and hematocrit values are higher and prevalence of anemia is lower in the post-folic acid fortification period than in the pre-folic acid fortification period in US adults. Am J Clin Nutr. 2009;89(1):363–371. doi:10.3945/ajcn.2008.26287
65. Shane B. Folate and vitamin B12 metabolism: overview and interaction with riboflavin, vitamin B6, and polymorphisms. Food Nutr Bull. 2008;29(2Suppl):S5–16. doi:10.1177/15648265080292S103
66. Clifford AJ, Noceti EM, Block-Joy A, Block T, Block G. Erythrocyte folate and its response to folic acid supplementation is assay dependent in women. J Nutr. 2005;135(1):137–143. doi:10.1093/jn/135.1.137
 © 2021 The Author(s). This work is published and licensed by Dove Medical Press Limited. The
full terms of this license are available at https://www.dovepress.com/terms
and incorporate the Creative Commons Attribution
- Non Commercial (unported, 3.0) License.
By accessing the work you hereby accept the Terms. Non-commercial uses of the work are permitted
without any further permission from Dove Medical Press Limited, provided the work is properly
attributed. For permission for commercial use of this work, please see paragraphs 4.2 and 5 of our Terms.
© 2021 The Author(s). This work is published and licensed by Dove Medical Press Limited. The
full terms of this license are available at https://www.dovepress.com/terms
and incorporate the Creative Commons Attribution
- Non Commercial (unported, 3.0) License.
By accessing the work you hereby accept the Terms. Non-commercial uses of the work are permitted
without any further permission from Dove Medical Press Limited, provided the work is properly
attributed. For permission for commercial use of this work, please see paragraphs 4.2 and 5 of our Terms.