Back to Journals » Clinical Ophthalmology » Volume 20
A Comparison of Vessel Density in Primary Open-Angle Glaucoma and Normal-Tension Glaucoma Patients Using OCT Angiography
Authors Zehavi-Dorin T ![]() , Kutzscher AE
, Kutzscher AE ![]() , Badr M, Mora M, Shyu Y, Porco TC, Stamper RL
, Badr M, Mora M, Shyu Y, Porco TC, Stamper RL
Received 7 October 2025
Accepted for publication 24 December 2025
Published 8 January 2026 Volume 2026:20 566473
DOI https://doi.org/10.2147/OPTH.S566473
Checked for plagiarism Yes
Review by Single anonymous peer review
Peer reviewer comments 4
Editor who approved publication: Dr Scott Fraser
Tzukit Zehavi-Dorin,1 Anne E Kutzscher,1,2 Mai Badr,3 Marta Mora,1 Yennie Shyu,1 Travis C Porco,1 Robert L Stamper1
1Department of Ophthalmology, University of California at San Francisco, San Francisco, CA, USA; 2Department of Ophthalmology, California Pacific Medical Center, San Francisco, CA, USA; 3Department of Internal Medicine, University of Massachusetts, Worcester, MA, USA
Correspondence: Robert L Stamper, Department of Ophthalmology, University of California at San Francisco, UCSF Wayne and Gladys Valley Center of Vision, 490 Illinois Street, San Francisco, CA, USA, Email [email protected]
Purpose: To compare global peripapillary and perifoveal vessel densities between primary open-angle glaucoma (POAG) and normal-tension glaucoma (NTG) patients with the same glaucoma severity using optical coherence tomography angiography (OCTA).
Methods: Subjects with POAG or NTG were recruited consecutively at the glaucoma clinic of the University of California at San Francisco. The glaucoma severity was graded as early, moderate, or severe based on the Hodapp-Parrish-Anderson Visual Field Criteria. All subjects underwent OCTA imaging (RTVue-XR Avanti; Optovue, Fremont, CA, USA) of the optic disc and macula by a trained technician. The main outcome measures were vessel density of the radial peripapillary capillary area and the perifoveal superficial layer as obtained from the disc and macula imaging respectively, using the AngioVue software.
Results: The study included 156 eyes (93 POAG, 63 NTG) from 91 patients. There was no significant difference between the perifoveal and peripapillary vessel density of subjects with NTG and POAG with similar extent of glaucomatous damage. In early glaucoma, a trend toward lower peripapillary vessel density in NTG compared with POAG was observed. No such trend was seen in moderate or severe stages.
Conclusion: Global vessel density parameters did not differ significantly between NTG and POAG eyes of similar severity. The observed trend toward lower peripapillary vessel density in early NTG may indicate a possible vascular contribution in early disease, but this finding is preliminary and requires confirmation in larger, prospective studies.
Keywords: OCT angiography, POAG, NTG, vessel density
A Letter to the Editor has been published for this article.
Introduction
Glaucoma is a chronic progressive optic neuropathy characterized by damage to the optic nerve head and retinal nerve fiber layer, leading to visual field loss and, if untreated, blindness. Glaucoma is the second leading cause of irreversible blindness in the US and the most common cause of irreversible blindness worldwide.1
Elevated intra-ocular pressure is recognized as a major risk factor for glaucoma; however, the exact pathogenesis is unknown. There is growing evidence that vascular factors also play a role in the development and progression of primary open angle glaucoma (POAG) and particularly of normal-tension glaucoma (NTG).2–6
Advancements in imaging and the introduction of a non-invasive angiography modality using optical coherence tomography angiography (OCTA) have led to the ability to quantify vascular changes in glaucoma patients. Several studies using OCTA reported lower vessel density in the macular and peripapillary areas of glaucoma patients compared to healthy subjects.7–11
Most of these studies did not differentiate between primary open angle glaucoma and NTG.
NTG has been thought to be more associated with vascular dysfunction,3,12,13 and the visual field loss in NTG tends to be deeper and closer to fixation earlier in the course of disease than in POAG.14 We were interested to examine whether these differences between POAG and NTG would be reflected in vessel density difference.
We conducted this study to compare the peripapillary and the macular capillary vasculature of POAG and NTG patients with the same glaucoma severity.
Material and Methods
The institutional review board at the University of California San Francisco (UCSF) approved this study, and the research adhered to the tenets of the Declaration of Helsinki.
Recruitment and imaging took place at the glaucoma clinic of the University of California at San Francisco from April 2017 to November 2019.
OCTA scans were acquired using the AngioVue imaging system (RTVue-XR Avanti; Optovue, Fremont, CA, USA) by a trained technician. Both macula images (6X6mm centered on the fovea) and disc images (4.5X4.5mm centered on the disc) were obtained during the same session. The vessel densities in different areas around the disc and macula were obtained using the AngioVue software. Previous studies reported that the radial peripapillary capillary (RPC) slab of the optic disc scan and the superficial retinal slab of the macular region are the useful slabs in glaucoma.15 Therefore, the parameters of main interest were the global radial peripapillary capillary density and the global perifoveal superficial layer vessel density (Figure 1).
 |
Figure 1 Radial peripapillary capillary (right) and superficial perifoveal (left) vessel density color maps (%) of a right eye obtained using the AngioVue OCTA system. |
Inclusion Criteria
Subjects 18 years or older with diagnosed NTG or POAG were recruited consecutively.
Glaucoma diagnoses were made by a glaucoma specialist prior to and independent of the analysis of the OCTA, based on full examination, standard automated perimetry and OCT. Open angle on indentation gonioscopy, neuroretinal rim loss, glaucomatous visual field defect, and/or RNFL loss were required for diagnosis of POAG and NTG. Additionally, POAG diagnosis required history of IOP>21 and NTG diagnosis required pre-treatment IOP≤21.
For each case, the most recent visual field within 6 months was reviewed, and the glaucoma severity was graded based on the Hodapp-Parrish-Anderson criteria (HPA)16 as early, moderate, or severe. When two eyes from one patient were included, each eye was considered an individual case.
Exclusion Criteria
Subjects with high myopia >6D or with any retinal or optic nerve disease not related to glaucoma, and subjects with media opacities precluding adequate imaging were excluded.
Images with poor quality due to artifacts or with low quality indices according to the manufacturer’s guidelines (signal quality <6 and signal strength index <50) were excluded.
Statistical Analysis
Descriptive statistics of the group characteristics is presented using a 2-sample t test for continuous variables and chi-square test for categorical variables.
Outcome variables (vessel densities) were compared in each grade of glaucoma severity using linear mixed effect regression, accounting for potential nonindependence between the two eyes of each patient. In cases where each patient contributed only a single eye, ordinary least squares regression was used. We adjusted P-values for multiple comparisons using the Šidák procedure, separately for the descriptive statistics and for the main results.
A linear mixed-effects regression model was used to evaluate average RNFL thickness as a function of glaucoma subtype (POAG vs NTG) and glaucoma severity.
Analyses were conducted using R v. 4.1 for Macintosh (R Foundation for Statistical Computing, Vienna, Austria).
Results
Overall, 95 patients underwent OCTA. After exclusion of poor-quality images, 156 eyes (93 POAG, 63 NTG) from 91 patients were included.
The mean age of the POAG and NTG groups was similar (70 and 69.9 years, respectively), and in both groups most of the patients were graded as having early glaucoma based on the HPA Visual Field Scale (74% and 68%, respectively). There was no significant difference between the POAG and NTG group in Humphrey visual field (VF) mean deviation (MD), average retinal nerve fiber layer (RNFL) thickness, average ganglion cell complex (GCC) thickness and central corneal thickness (CCT).
The characteristics of POAG and NTG groups are summarized in Table 1.
The mean values of perifoveal and peripapillary vessel density of the NTG group were lower compared to the POAG group but these differences were not statistically significant (Table 1).
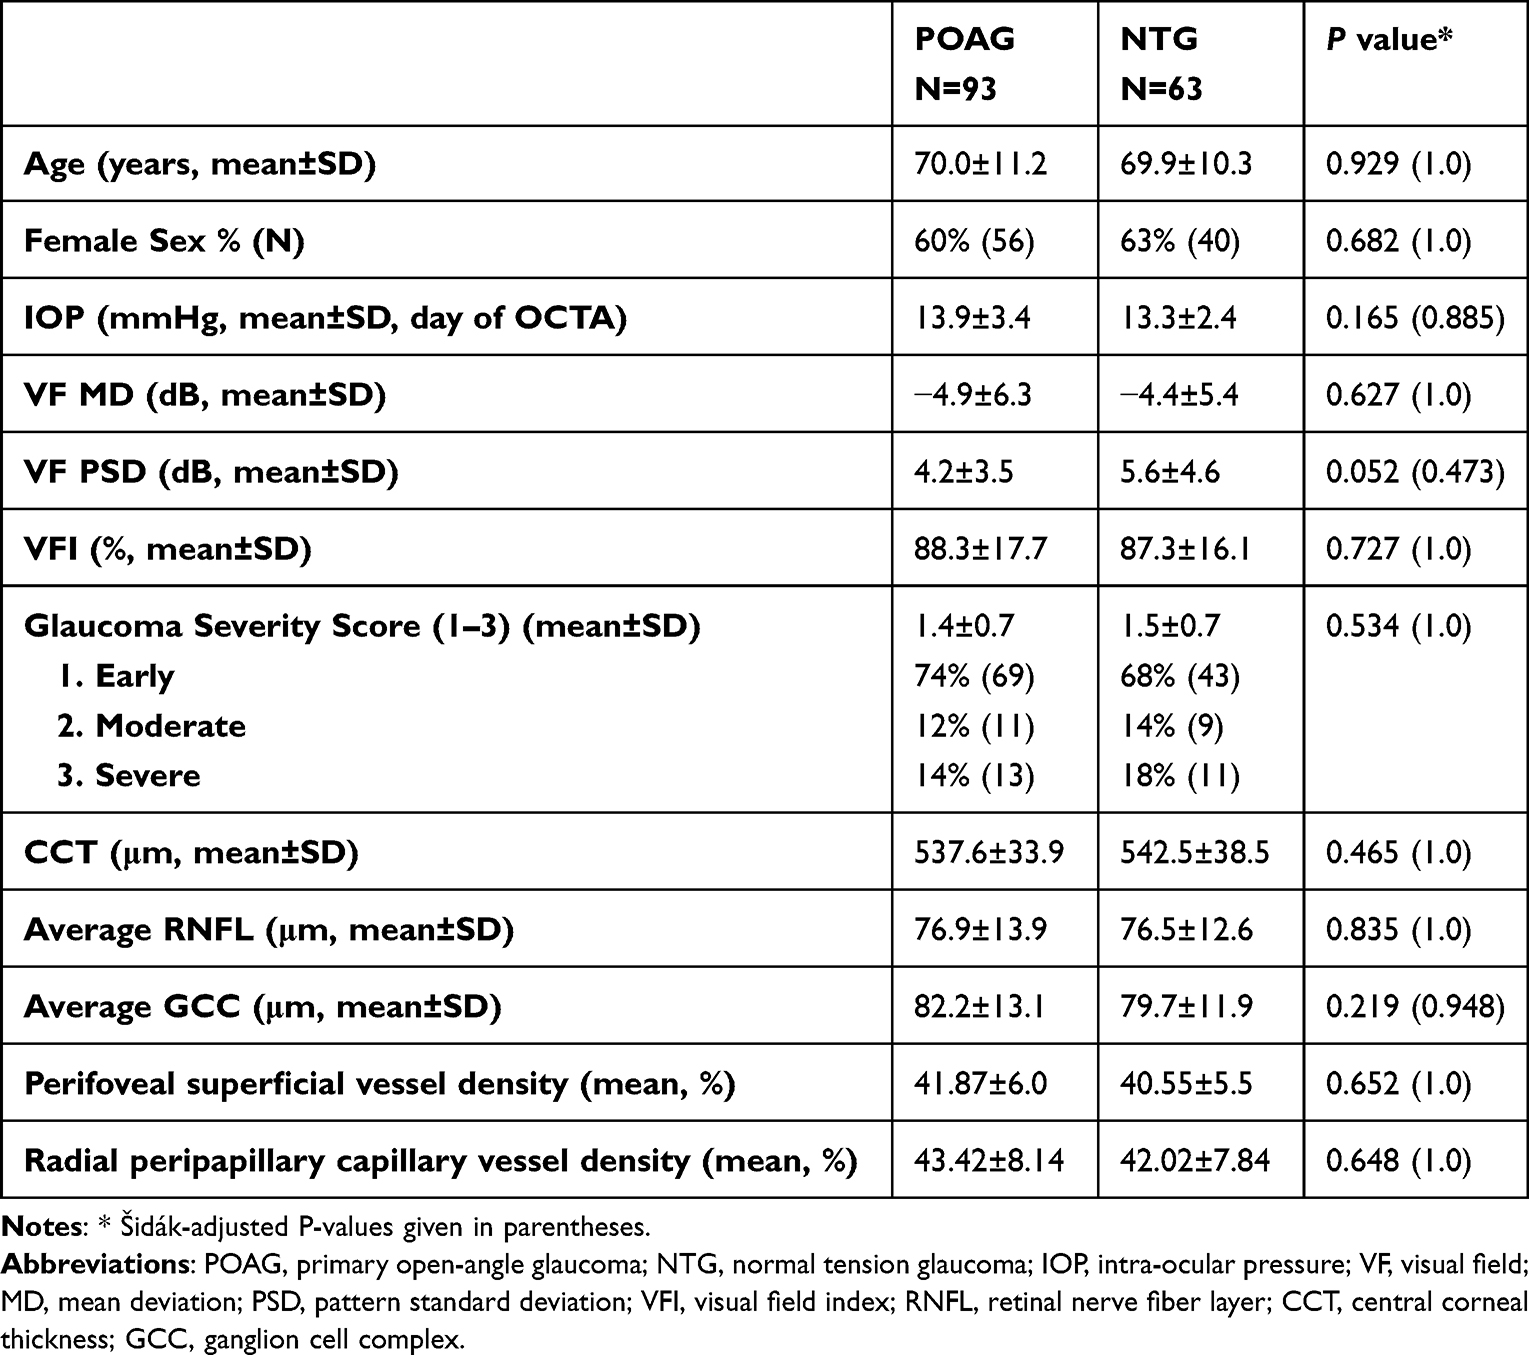 |
Table 1 Characteristics of POAG and NTG Eyes |
Comparing the vessel density of the two groups by the glaucoma severity stage, there was a trend toward significance in the early glaucoma stage, with lower peripapillary vessel density in NTG eyes compared to POAG eyes at the same stage (P=0.058, 0.301 following adjustment for multiple comparisons). There was no statistically significant difference in patients with moderate or severe stage and in the perifoveal area (Table 2).
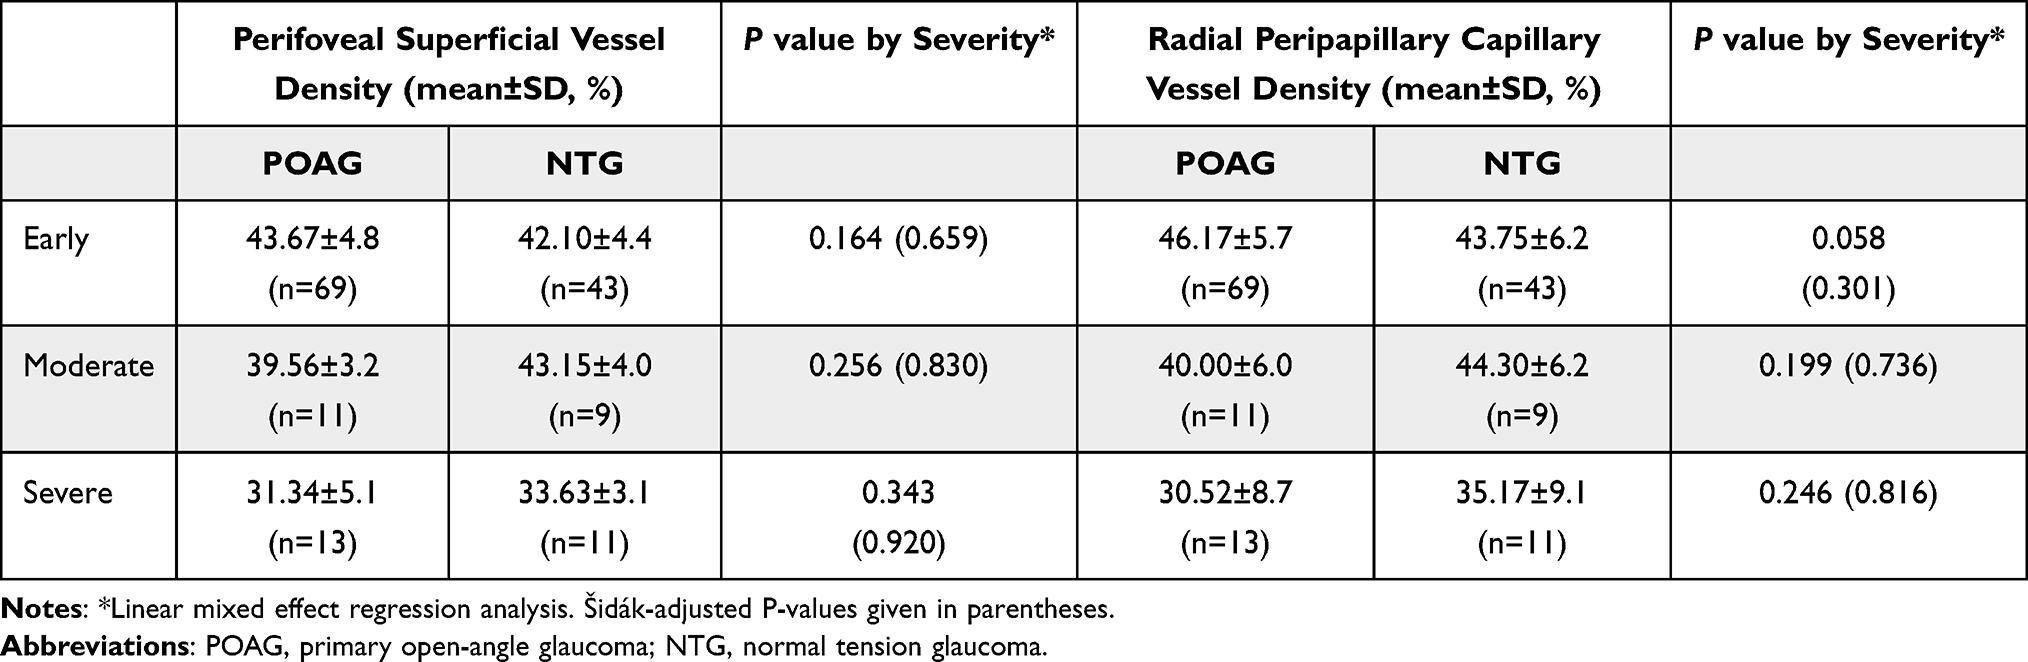 |
Table 2 Perifoveal and Peripapillary Vessel Densities of POAG and NTG Eyes by Severity |
In a mixed-effects regression model accounting for severity, average RNFL thickness did not differ by glaucoma subtype (p = 0.89, Table 3).
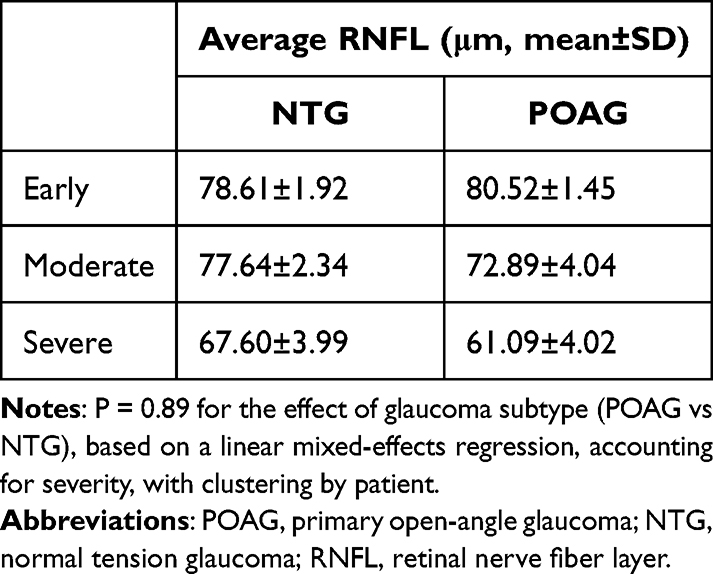 |
Table 3 Average RNFL Thickness in POAG and NTG Eyes by Severity |
Discussion
Previous OCTA studies in glaucoma patients have investigated both the optic disc or peripapillary area and the macular area (perifovea or parafovea) and have shown strong evidence for vascular compromise in glaucoma. Jia et al reported that the disc flow index was reduced by 25% in glaucomatous eyes.11 Liu et al examined the vessel density in the peripapillary nerve fiber layer in glaucomatous eyes compared to healthy controls and reported a significant decrease.17 Chen et al found decreased vessel density in both the macular and peripapillary areas in glaucomatous eyes.10 Numerous studies confirmed the findings of reduced peripapillary and macular vessel density in POAG eyes.18–21
Although the majority of OCTA studies were conducted in POAG patients, similar results were also confirmed in NTG, with reduction of vessel density in the superficial macular, peripapillary, and optic nerve, as well as the choriocapillaris in eyes with low tension glaucoma, compared with healthy controls.22 However, only a few studies compared the OCTA of POAG to that of NTG patients with varying results. Since NTG is associated with vascular dysfunction, our hypothesis was that patients with NTG will have lower vessel densities than patients with POAG. Contrary to the hypothesis, Scripsema et al found that NTG eyes have reduced peripapillary capillary densities compared to control eyes but higher densities than POAG eyes.23 Similarly, Onishi et al reported that the peripapillary vessel density in POAG eyes was significantly lower than in NTG eyes.24 These studies included a relatively small group of NTG patients (26 and 16, respectively). Other studies reported different results. Xu et al compared the OCTA of 43 high tension glaucoma patients to 33 NTG patients and reported a significantly lower mean vessel density in NTG eyes than the high-tension glaucoma eyes in the peripapillary region.25 More recently, Bhalla et al investigated the peripapillary choriocapillaris of 30 NTG patients, 30 POAG patients and 30 controls with OCTA and reported an association between choriocapillaries parameters and glaucoma severity in NTG, but not in POAG.26
In our study, we did not find a significant difference between the mean perifoveal and peripapillary vessel density of NTG and POAG patients, however there was a trend toward lower peripapillary capillary vessel density in patients with early NTG compared to patients with early POAG. It is possible that vascular factors play a more prominent role in the early stages of NTG than in the same stage of POAG but as the disease progress the difference is no longer seen. From a pathophysiologic perspective, one could surmise that vascular factors are a primary cause of damage in some normal pressure glaucoma patients early in the disease but as ganglion cell death progresses, secondary vascular attrition takes over explaining why there is no difference between the two groups later in the process. Further studies with larger groups of each severity stage are needed to confirm this finding. To our knowledge this is the first study to compare the vessel density of POAG and NTG patients with matching glaucoma severity. The correlation between glaucoma severity and vessel density has been well described in several previous studies. Scripsema reported that both POAG and NTG patients demonstrated decreased annular peripapillary capillary density as the glaucoma severity increased.23 Others reported a correlation between flow index and vessel density with MD, RNFL and GCC.27–29 Moreover, the vascular-function correlation that was reported between vessel density and VF was stronger than the standard structure (RNFL)-function (VF) correlation.28,29 Together with reports of decreased vessel density and flow index even in glaucoma suspects compared to normal controls,21,24,28,30,31 this could increase the utility of OCTA as an adjunct tool to confirm the diagnosis of early glaucoma. This is further supported by a recent report by Kendra et al who showed that the hemiretinal difference in peripapillary vessel density (defined as the difference between superior and inferior hemiretinal vessel area density) is higher in early glaucoma and may help with early detection.32
There are several limitations to our study. In addition to its retrospective design, the NTG group was smaller than the POAG group and most of the patients had mild glaucoma. As a result, our study is underpowered for the subgroup analyses, particularly in the moderate and severe stages, where the number of eyes was limited. This may have reduced our ability to detect subtle differences between the groups, and should therefore prompt caution when interpreting these severity-specific comparisons. Although the number of NTG patients was modest, it was sufficiently large to get comparative statistical significance. The modest number might hide a very subtle difference between the POAG and the NTG groups; however, it is highly unlikely that larger numbers would uncover a difference that was clinically or scientifically significant. Importantly, our sample size, though limited, was larger than that of most prior studies on this topic. Another potential limitation involves the possibility that the observed vessel density findings are secondary to RNFL thickness. Although differences in RNFL thickness between our NTG and POAG groups at the same stage were not statistically significant, the RNFL thickness appeared to follow a similar trend to vessel density. In early stages, NTG eyes had thinner RNFL thickness than POAG eyes, whereas in moderate and severe stages, NTG eyes had greater RNFL thickness than POAG eyes. A correlation between RNFL and vessel density was previously reported in healthy eyes;33,34 however, no other studies have examined this correlation in glaucomatous eyes at different disease stages. Lin et al35 examined the correlation of vessel density and RNFL with VF at different stages and demonstrated a higher correlation in early-stage NTG eyes between vessel density and VF than that between the RNFL thickness and VF, while for moderate- and severe-stage NTG eyes, vessel density and RNFL both correlated with VF. They concluded that vascular loss occurred earlier than RNFL loss did in NTG eyes.
It should be noted that vessel density does not measure actual blood flow but only identifies vessels in which some blood flow is occurring at the moment of imaging. Therefore, vessel density is an imperfect marker for blood flow and may miss periodic or episodic changes in blood flow; for example, it is not clear what happens to vessel density with orthostatic or other significant blood pressure drops. Additionally, there may be a confounding effect of other factors on the vessel density including IOP, systemic and topical medications and systemic vascular diseases.36
In animal models, a statistically significant decrease in flow density was observed in very high IOP (above 50mmHg) suggesting that there is a correlation between IOP and vessel density that becomes apparent only at high IOP values.37 In humans, several studies failed to find correlation between diurnal IOP changes and vessel density.38,39 On the other hand, IOP reduction can significantly increase the vessel density as was reported by Holló, who described a significant increase in peripapillary flow density after IOP was lowered to 50% of its baseline value with topical medication.40 In our study, IOP at the day of OCTA was in normal range and similar between the groups, thus, not expected to have a significant effect on the results.
Previous studies reported that vessel density was significantly reduced in hypertensive patients.41,42 Other studies reported reduced vessel density in patients with high cardiovascular risk score,43 obstructive sleep apnea syndrome44 and carotid artery stenosis.45 Another consideration is that we did not collect or adjust for systemic hypertension, cardiovascular status, or topical and systemic medications, all of which are prevalent in this population and may influence retinal vasculature. Future prospective studies with more detailed systemic data will help clarify their potential influence.
Lastly, this study focused on global peripapillary and perifoveal vessel densities rather than sectoral or focal changes. We recognize that in OCTA localized areas of higher or lower vessel density may not be fully reflected by global metrics. While such sectoral analyses may provide additional spatial detail, they were beyond the scope of the present study and are planned for a subsequent phase of this research.
Conclusion
Our study failed to find a significant difference in global vessel density parameters between NTG and POAG patients. A trend toward lower peripapillary vessel density is seen in patients with early NTG compared to patients with early POAG. The results suggest there might be a more prominent role of vascular insufficiency in the early stages of NTG but additional studies are needed to confirm or refute this and elucidate mechanisms responsible for any difference found. It is important to note that our conclusions are preliminary, as our study has inherent limitations that warrant consideration in future research.
Data Sharing Statement
The datasets used and/or analyzed during the current study are available from the corresponding author on reasonable request.
Ethical Approval
The institutional review board at the University of California San Francisco (UCSF) approved this study. IRB number 18-26354.
All procedures performed were in accordance with the ethical standards of UCSF and with the 1964 Helsinki declaration and its later amendments or comparable ethical standards.
Informed consent was obtained from all individual participants included in the study.
Author Contributions
All authors made a significant contribution to the work reported, whether that is in the conception, study design, execution, acquisition of data, analysis and interpretation, or in all these areas; took part in drafting, revising or critically reviewing the article; gave final approval of the version to be published; have agreed on the journal to which the article has been submitted; and agree to be accountable for all aspects of the work.
Funding
This work was supported in part by grant EYE002162 (Core Grant for Vision Research) from the NIH-NEI, an Unrestricted Grant from Research to Prevent Blindness, a Fortisure Foundation grant and All May See Foundation.
Disclosure
The authors declare that they have no competing interests.
References
1. Tham YC, Li X, Wong TY, Quigley HA, Aung T, Cheng CY. Global Prevalence of Glaucoma and Projections of Glaucoma Burden through 2040: a Systematic Review and Meta-Analysis. Ophthalmology. 2014;121(11):2081–8. doi:10.1016/j.ophtha.2014.05.013
2. Tielsch JM, Katz J, Sommer A, Quigley HA, Javitt JC. Hypertension, perfusion pressure, and primary open-angle glaucoma: a population-based assessment. Arch Ophthalmol. 1995;113.
3. Galassi F, Giambene B, Varriale R. Systemic vascular dysregulation and retrobulbar hemodynamics in normal-tension glaucoma. Invest Ophthalmol Vis Sci. 2011;52(7):4467–4471. doi:10.1167/iovs.10-6710
4. Gherghel D, Orgül S, Gugleta K, Gekkieva M, Flammer J. Relationship between ocular perfusion pressure and retrobulbar blood flow in patients with glaucoma with progressive damage. Am J Ophthalmol. 2000;130(5):597–605. doi:10.1016/S0002-9394(00)00766-2
5. Tobe LA, Harris A, Hussain RM, et al. The role of retrobulbar and retinal circulation on optic nerve head and retinal nerve fibre layer structure in patients with open-angle glaucoma over an 18-month period. Br J Ophthalmol. 2015;99(5). doi:10.1136/bjophthalmol-2014-305780
6. Flammer J, Orgül S, Costa VP, et al. The impact of ocular blood flow in glaucoma. Prog Retin Eye Res. 2002;21(4). doi:10.1016/S1350-9462(02)00008-3
7. Kromer R, Glusa P, Framme C, Pielen A, Junker B. Optical coherence tomography angiography analysis of macular flow density in glaucoma. Acta Ophthalmol. 2019;97(2):e199–e206. doi:10.1111/aos.13914
8. Lu P, Xiao H, Liang C, Xu Y, Ye D, Huang J. Quantitative analysis of microvasculature in macular and peripapillary regions in early primary open-angle glaucoma. Curr Eye Res. 2020;45(5):629–635. doi:10.1080/02713683.2019.1676912
9. Chen A, Liu L, Wang J, et al. Measuring glaucomatous focal perfusion loss in the peripapillary retina using OCT angiography. Ophthalmology. 2020;127(4):484–491. doi:10.1016/j.ophtha.2019.10.041
10. Chen HSL, Liu CH, Wu WC, Tseng HJ, Lee YS. Optical coherence tomography angiography of the superficial microvasculature in the macular and peripapillary areas in glaucomatous and healthy eyes. Invest Ophthalmol Vis Sci. 2017;58(9):3637–3645. doi:10.1167/iovs.17-21846
11. Jia Y, Wei E, Wang X, et al. Optical coherence tomography angiography of optic disc perfusion in glaucoma. Ophthalmology. 2014;121(7):1322–1332. doi:10.1016/j.ophtha.2014.01.021
12. Meyer JH, Brandi-Dohrn J, Funk J. Twenty four hour blood pressure monitoring in normal tension glaucoma. Br J Ophthalmol. 1996;80(10):864–867. doi:10.1136/bjo.80.10.864
13. Buckley C, Hadoke PWF, Henry E, OBrien C. Systemic vascular endothelial cell dysfunction in normal pressure glaucoma. Br J Ophthalmol. 2002;86(2):227–232. doi:10.1136/bjo.86.2.227
14. Caprioli J, Sears M, Spaeth GL. Comparison of visual field defects in normal-tension glaucoma and high-tension glaucoma. Am J Ophthalmol. 1986;102(3):402–403. doi:10.1016/0002-9394(86)90028-0
15. Rao HL, Pradhan ZS, Suh MH, Moghimi S, Mansouri K, Weinreb RN. Optical coherence tomography angiography in glaucoma. J Glaucoma. 2020;29(4):312–321. doi:10.1097/IJG.0000000000001463
16. Hodapp E, Parrish RK, Anderson DR. Clinical Decisions in Glaucoma. Mosby Incorporated; 1993.
17. Liu L, Jia Y, Takusagawa HL, et al. Optical coherence tomography angiography of the peripapillary retina in glaucoma. JAMA Ophthalmol. 2015;133(9):1045–1052. doi:10.1001/jamaophthalmol.2015.2225
18. Mansoori T, Sivaswamy J, Gamalapati JS, Balakrishna N. Radial peripapillary capillary density measurement using optical coherence tomography angiography in early glaucoma. J Glaucoma. 2017;26(5).
19. Bum KS, Ejandhjcandkc L. Comparison of peripapillary vessel density between preperimetric and perimetric glaucoma evaluated by OCT-angiography. PLoS One. 2017;12(8):1–12. doi:10.1371/journal.pone.0184297
20. Yarmohammadi A, Zangwill LM, Diniz-Filho A, et al. Peripapillary and macular vessel density in patients with glaucoma and single-hemifield visual field defect. Ophthalmology. 2017;124(5):709–719. doi:10.1016/j.ophtha.2017.01.004
21. Chen CL, Zhang A, Bojikian KD, et al. Peripapillary retinal nerve fiber layer vascular microcirculation in glaucoma using optical coherence tomography–based microangiography. Invest Ophthalmol Vis Sci. 2016;57(9):475–485. doi:10.1167/iovs.15-18909
22. Tepelus TC, Song S, Borrelli E, et al. Quantitative analysis of retinal and choroidal vascular parameters in patients with low tension glaucoma. J Glaucoma. 2019;28(6):557–562. doi:10.1097/IJG.0000000000001242
23. Scripsema NK, Garcia PM, Bavier RD, et al. Optical coherence tomography angiography analysis of perfused peripapillary capillaries in primary open-angle glaucoma and normal-tension glaucoma. Invest Ophthalmol Vis Sci. 2016;57(9):OCT611–OCT620. doi:10.1167/iovs.15-18945
24. Onishi AC, Treister AD, Nesper PL, Fawzi AA, Anchala AR. Parafoveal vessel changes in primary open-angle glaucoma and normal-tension glaucoma using optical coherence tomography angiography. Clin Ophthalmol. 2019;13:1935–1945. doi:10.2147/OPTH.S206288
25. Xu H, Zhai R, Zong Y, et al. Comparison of retinal microvascular changes in eyes with high-tension glaucoma or normal-tension glaucoma: a quantitative optic coherence tomography angiographic study. Graefes Arch Clin Exp Ophthalmol. 2018;256(6):1179–1186. doi:10.1007/s00417-018-3930-z
26. Bhalla M, Heisler M, Mammo Z, et al. Investigation of the peripapillary choriocapillaris in normal tension glaucoma, primary open angle glaucoma, and control eyes. J Glaucoma. 2021. doi:10.1097/IJG.0000000000001861
27. Wang X, Jiang C, Ko T, et al. Correlation between optic disc perfusion and glaucomatous severity in patients with open-angle glaucoma: an optical coherence tomography angiography study. Graefes Arch Clin Exp Ophthalmol. 2015;253(9):1557–1564. doi:10.1007/s00417-015-3095-y
28. Yarmohammadi A, Zangwill LM, Diniz-Filho A, et al. Relationship between optical coherence tomography angiography vessel density and severity of visual field loss in glaucoma. Ophthalmology. 2016;123(12):2498–2508. doi:10.1016/j.ophtha.2016.08.041
29. Shin JW, Lee J, Kwon J, Choi J, Kook MS. Regional vascular density-visual field sensitivity relationship in glaucoma according to disease severity. Br J Ophthalmol. 2017;101(12). doi:10.1136/bjophthalmol-2017-310180
30. Hou H, Moghimi S, Kamalipour A, et al. Macular thickness and microvasculature loss in glaucoma suspect eyes. Ophthalmol Glaucoma. 2022;5(2):170–178. doi:10.1016/j.ogla.2021.07.009
31. Płatkowska B, Kal M, Biskup M. Optical coherence tomography angiography – use in ophthalmological practice. Med Stud. 2020;36(3):195–205. doi:10.5114/ms.2020.99541
32. Hong KL, Burkemper B, Urrea AL, et al. Hemiretinal asymmetry in peripapillary vessel density in healthy, glaucoma suspect, and glaucoma eyes. Am J Ophthalmol. 2021:230. doi:10.1016/j.ajo.2021.05.019
33. Yu J, Gu R, Zong Y, et al. Relationship between retinal perfusion and retinal thickness in healthy subjects: an optical coherence tomography angiography study. Invest Ophthalmol Vis Sci. 2016;57(9):OCT204–OCT210. doi:10.1167/iovs.15-18630
34. She X, Guo J, Liu X, et al. Reliability of vessel density measurements in the peripapillary retina and correlation with retinal nerve fiber layer thickness in healthy subjects using optical coherence tomography angiography. Ophthalmologica. 2018;240(4):183–190. doi:10.1159/000485957
35. Lin YH, Huang SM, Yeung L, et al. Correlation of visual field with peripapillary vessel density through optical coherence tomography angiography in normal-tension glaucoma. Transl Vis Sci Technol. 2020;9(13):1–8. doi:10.1167/tvst.9.13.26
36. Brücher VC, Storp JJ, Eter N, Alnawaiseh M. Optical coherence tomography angiography-derived flow density: a review of the influencing factors. Graefe’s Arch Clin Expl Ophthalmol. 2020;258(4):701–710. doi:10.1007/s00417-019-04553-2
37. Patel N, McAllister F, Pardon L, Harwerth R. The effects of graded intraocular pressure challenge on the optic nerve head. Exp Eye Res. 2018;169. doi:10.1016/j.exer.2018.01.025
38. Mansouri K, Rao HL, Hoskens K, et al. Diurnal variations of peripapillary and macular vessel density in glaucomatous eyes using optical coherence tomography angiography. J Glaucoma. 2018;27(4). doi:10.1097/IJG.0000000000000914
39. Müller VC, Storp JJ, Kerschke L, Nelis P, Eter N, Alnawaiseh M. Diurnal variations in flow density measured using optical coherence tomography angiography and the impact of heart rate, mean arterial pressure and intraocular pressure on flow density in primary open-angle glaucoma patients. Acta Ophthalmol. 2019;97(6). doi:10.1111/aos.14089
40. Holló G. Influence of large intraocular pressure reduction on peripapillary OCT vessel density in ocular hypertensive and glaucoma eyes. J Glaucoma. 2017;26(1). doi:10.1097/IJG.0000000000000527
41. Lim HB, Lee MW, Park JH, Kim K, Jo YJ, Kim JY. Changes in ganglion cell–inner plexiform layer thickness and retinal microvasculature in hypertension: an optical coherence tomography angiography study. Am J Ophthalmol. 2019;199. doi:10.1016/j.ajo.2018.11.016
42. Chua J, Chin CWL, Hong J, et al. Impact of hypertension on retinal capillary microvasculature using optical coherence tomographic angiography. J Hypertens. 2019;37(3). doi:10.1097/HJH.0000000000001916
43. Arnould L, Guenancia C, Azemar A, et al. The EYE-MI pilot study: a prospective acute coronary syndrome cohort evaluated with retinal optical coherence tomography angiography. Invest Ophthalmol Vis Sci. 2018;59(10). doi:10.1167/iovs.18-24090
44. Yu J, Xiao K, Huang J, Sun X, Jiang C. Reduced retinal vessel density in obstructive sleep apnea syndrome patients: an optical coherence tomography angiography study. Invest Ophthalmol Vis Sci. 2017;58(9). doi:10.1167/iovs.17-21414
45. Lahme L, Marchiori E, Panuccio G, et al. Changes in retinal flow density measured by optical coherence tomography angiography in patients with carotid artery stenosis after carotid endarterectomy. Sci Rep. 2018;8(1). doi:10.1038/s41598-018-35556-4
 © 2026 The Author(s). This work is published and licensed by Dove Medical Press Limited. The
full terms of this license are available at https://www.dovepress.com/terms
and incorporate the Creative Commons Attribution
- Non Commercial (unported, 4.0) License.
By accessing the work you hereby accept the Terms. Non-commercial uses of the work are permitted
without any further permission from Dove Medical Press Limited, provided the work is properly
attributed. For permission for commercial use of this work, please see paragraphs 4.2 and 5 of our Terms.
© 2026 The Author(s). This work is published and licensed by Dove Medical Press Limited. The
full terms of this license are available at https://www.dovepress.com/terms
and incorporate the Creative Commons Attribution
- Non Commercial (unported, 4.0) License.
By accessing the work you hereby accept the Terms. Non-commercial uses of the work are permitted
without any further permission from Dove Medical Press Limited, provided the work is properly
attributed. For permission for commercial use of this work, please see paragraphs 4.2 and 5 of our Terms.