Back to Journals » Medical Devices: Evidence and Research » Volume 8
A comparison of MRI tissue relaxometry and ROI methods used to determine regional brain iron concentrations in restless legs syndrome
Authors Moon H, Chang Y, Lee YS, Song H, Chang HW, Ku J, Allen R, Earley CJ, Cho YW
Received 27 February 2015
Accepted for publication 8 April 2015
Published 30 July 2015 Volume 2015:8 Pages 341—350
DOI https://doi.org/10.2147/MDER.S83629
Checked for plagiarism Yes
Review by Single anonymous peer review
Peer reviewer comments 2
Editor who approved publication: Dr Scott Fraser
Hye-Jin Moon,1,* Yongmin Chang,2,* Yeong Seon Lee,1 Huijin Song,3 Hyuk Won Chang,4 Jeonghun Ku,5 Richard P Allen,6 Christopher J Earley,6 Yong Won Cho1
1Department of Neurology, Dongsan Medical Center, Keimyung University School of Medicine, Daegu, Republic of Korea; 2Department of Molecular Medicine, 3Department of Medical and Biological Engineering, Kyungpook National University and Hospital, Daegu, Republic of Korea; 4Department of Radiology, 5Department of Biomedical Engineering, School of Medicine, Keimyung University, Daegu, Republic of Korea; 6Department of Neurology, Johns Hopkins University, Hopkins Bayview Medical Center, Baltimore, MD, USA
*These authors contributed equally to this work
Purpose: Magnetic resonance imaging relaxometry studies differed on the relaxometry methods and their approaches to determining the regions of interest (ROIs) in restless legs syndrome (RLS) patients. These differences could account for the variable and inconsistent results found across these studies. The aim of this study was to assess the relationship between the different relaxometry methods and different ROI approaches using each of these methods on a single population of controls and RLS subjects.
Methods: A 3.0-T magnetic resonance imaging with the gradient-echo sampling of free induction decay and echo pulse sequence was used. The regional brain “iron concentrations” were determined using three relaxometry metrics (R2, R2*, and R2') through two different ROI methods. The substantia nigra (SN) was the primary ROI with red nucleus, caudate, putamen, and globus pallidus as the secondary ROIs.
Results: Thirty-seven RLS patients and 40 controls were enrolled. The iron concentration as determined by R2 did not correlate with either of the other two methods, while R2* and R2' showed strong correlations, particularly for the substantia nigra and red nucleus. In the fixed-shape ROI method, the RLS group showed a lower iron index compared to the control group in the substantia nigra and several other regions. With the semi-automated ROI method, however, only the red nucleus showed a significant difference between the two groups.
Conclusion: Both the relaxometry and ROI determination methods significantly influenced the outcome of studies that used these methods to estimate regional brain iron concentrations.
Keywords: restless legs syndrome, relaxometry, region of interest, substantia nigra, iron
Introduction
To measure the iron content in brain regions of patients with various neurological diseases using magnetic resonance imaging (MRI), three relaxometry metrics have been used: R2 (1/T2), R2* (1/T2*), and R2′ (R2*–R2, 1/T2′);1–3 however, this has produced differing results.4–6 One such neurological disease in which MRI has been used for this exact purpose is restless legs syndrome (RLS), also called Willis–Ekbom disease.7
RLS is a neurological disorder with diminished brain iron content, particularly in the substantia nigra (SN), which can be identified in autopsy studies of the brain.8–13 Transcranial B-mode ultrasonography14,15 and MRI4,16 have further documented low brain iron concentrations in the SN of RLS patients.
Six studies have measured regional brain iron concentrations of RLS patients using MRI relaxometry metrics.4,6,16–19 These studies have provided inconsistent results with decreased, increased, or nonsignificant iron concentration differences for specific brain regions, especially for the SN. These differences may be due to the different methods used in these studies, both for delineating regions of interest (ROIs) (manual tracing, semi-automated tracing, and fixed-shape tracing) and also for relaxometry metrics (R2, R2*, and R2′).
To examine the possibility that differences in ROI methods and relaxometry metrics could account for the inconsistencies in iron concentrations in prior studies, we used two different methods for determining the ROI (fixed-shape vs semi-automated tracing) and different MRI metrics (R2, R2*, and R2′) in controls and RLS subjects. The SN was the primary ROI.
Materials and methods
Subjects
All of the participants prior to inclusion in the study gave written informed consent approved by the institutional review board of a regional hospital. Thirty-seven idiopathic RLS and 40 healthy control participants were included. All subjects underwent diagnostic clinical interviews by a board-certified Korean neurologist with expertise in RLS diagnosis. The validated Korean-language version20 of the John Hopkins Telephone diagnostic questionnaire21 was utilized. The severity of RLS symptoms was determined using the validated Korean version22 of the International RLS scale (K-IRLS).23 Only those diagnosed with idiopathic RLS (including iron deficiency but without anemia) based on clinical assessment and who had moderate-to-severe RLS symptoms (K-IRLS ≥15) were eligible as RLS subjects for this study. Control subjects had to be free of any RLS symptoms determined by an answer of “no” to the first two questions on the RLS diagnostic questionnaire. Subjects were excluded if they were under age 18, pregnant, or had anemia, chronic organ failure, chronic inflammation, or altered iron metabolism (eg, hemochromatosis). Subjects were also excluded for any primary sleep disorder other than RLS such as insomnia, sleep-disordered breathing, circadian sleep disorders, and parasomnias, as assessed by the validated Korean-language versions of sleep questionnaires.24–26
On the day of the MRI study, laboratory tests for serum iron levels, serum ferritin levels, and total iron binding capacity (TIBC) were performed in all of the RLS subjects and the 16 control subjects who permitted additional blood sampling on the day of MRI study. All the subjects underwent MRI scan during daytime when RLS subjects were largely asymptomatic.
Imaging protocol
MRI data were acquired by using a 3.0-T GE VHi scanner (GE Medical Systems, Milwaukee, WI, USA) with an eight-channel high-resolution brain coil as follows. 1) For T2 relaxometry, two sets of spin echo sequence (TR =3,725 ms, TE = [30, 60, 90, 120] and [70, 140, 210, 280] ms, slice thickness =3 mm, space =2 mm, filed of view (FOV) =23 cm, matrix =256×128, number of slices =9, scan time =6 minutes 41 seconds ×2) were obtained. 2) For T2* relaxometry, four sets of gradient echo sequence (TR =2700 ms, TE = [30, 60], [90, 120], [70, 140] and [210, 280] ms, slice thickness =3 mm, space =2 mm, FOV =23 cm, matrix =256×128, number of slices =9, scan time =4 minutes 30 seconds ×4) were obtained. Both relaxometry were aligned with the anterior to posterior commissure line and scanned from the genu of the corpus callosum.
Image analysis
T2 and T2* maps were processed using an MRI analysis calculator plugin of ImageJ software (http://rsb.info.nih.gov/ij/). T2 and T2* maps were produced through a pixel by pixel fitting process using the Curve fitter class in ImageJ software. T2 and T2* maps were converted to R2 and R2* maps. R2′ maps, with R2′ = R2*–R2, were calculated by an image calculation function of ImageJ software. R2, R2*, and R2′ maps were obtained following reconstruction procedures. R2, R2*, and R2′ were each used to assess the regional iron concentration. Each of the five specific regions (caudate head, putamen, globus pallidus, red nucleus, and SN), delineated by two different methods discussed under the section titled Determining the ROIs, were independently analyzed. The primary ROI was the SN. The secondary measures of ROI were four other brain structures: caudate head, putamen, globus pallidus, and red nucleus. Relaxation rates for both right and left-side ROIs were averaged together.
One trained analyst (YSL) performed all the analysis. She delineated the ROIs both of two different methods on the spin-echo image for the slice with the best presentation of the area using software known as ImageJ and MIPAV (Medical Image Processing, Analysis, and Visualization) (http://mipav.cit.nih.gov/). She was blinded to the diagnosis of the subjects. To calculate inter-rater reliability, another trained analyst (MLS) repeated the same procedure for both measures in all five regions of the 15 randomly chosen subjects. A neuroradiologist (HWC) had trained both analysts.
Determining the ROIs
ROIs can be determined by two methods: fixed-shape ROI method and semi-automated tracing ROI method (Figure 1).
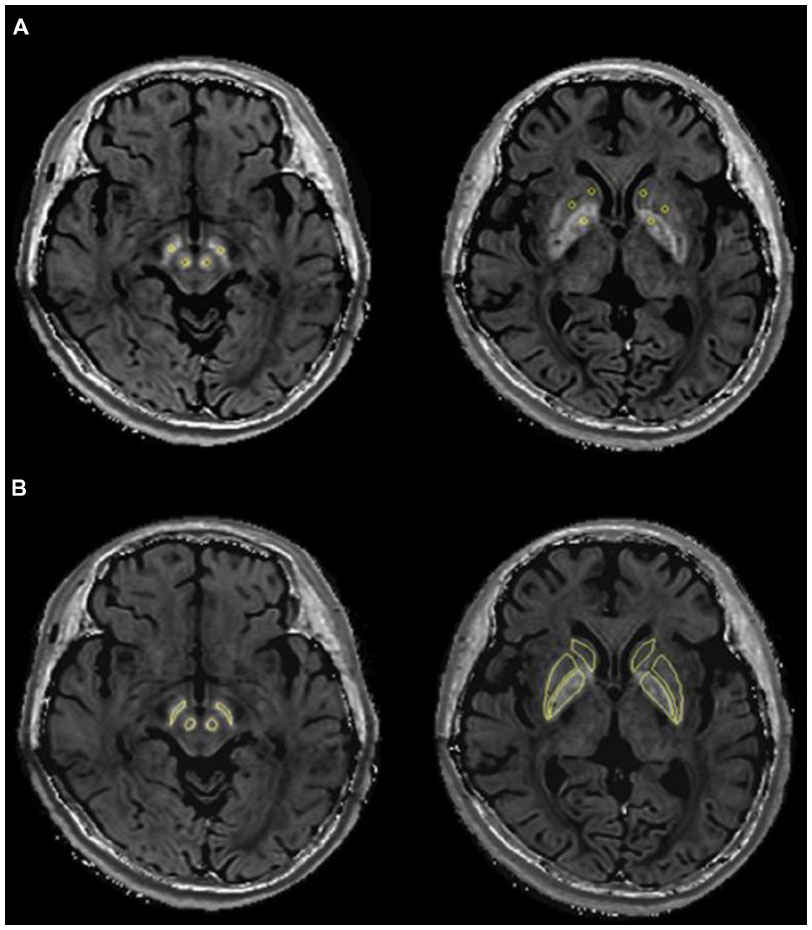 | Figure 1 Range of areas for each ROI method in R2 relaxometry metrics. |
- Fixed-shape ROI method: Using the ImageJ software, a total of nine pixels were automatically drawn to include one anatomical center of the specific area and eight neighboring pixels around the center, which can be determined by a brain anatomy atlas.27,28 The pixel size was approximately 1.614 mm2. For defining the red nucleus and the SN, we identified the axial slice where the red nucleus or SN was prominent (Figure 1). Then we placed the visually determined ROI at the central portion of the region. For defining the caudate head, putamen, and the globus pallidus ROIs, the axial section at the level of the anterior commissure was used. The anatomical center of the caudate head was visually determined at the central portion of the region, while in the putamen and globus pallidus, a virtual line which crossed the genu of that area in the axial slice was used as the center. Each image was visually inspected to make certain that signal loss did not occur in the ROI or in the surrounding tissue. The ROIs were carefully chosen to minimize the partial volume effects and to avoid possible artifacts. Each was drawn once on the transverse R2 map with the best view of the region and then transferred to the R2* and R2′ maps. All the measurements were performed twice by each trained analyst. The mean of the four measurements (two sessions of two measurements determined from each hemisphere) was used as the final measured value for each case.
- Semi-automated tracing ROI method: We used the same brain images as used for the fixed-shape ROI method. For the SN and red nucleus, the analysts used MIPAV software to semi-automatically generate ROIs. This software used a tool (“Draw Levelset VOI”) that requires an indication of one ROI area and then automatically draws an estimated border outline for that ROI. The borders of the ROIs can then be manually adjusted if well-defined ROIs are not generated. For the caudate head, putamen, and globus pallidus, the ROIs were manually traced without the use of this tool. This manual method attempted to capture the full anatomical ROI.28 The ROIs were drawn only once on the same transverse R2 map used for the fixed-shape ROI method and then transferred to the R2* and R2′ maps. As the SN is our primary ROI for this study and as a semi-automated tracing was used for this ROI, this method throughout the paper will be referred to as semi-automated with the understanding that for the basal ganglia delineation a fully manual method was used.
Statistical analysis
The independent t-test was used for analyzing the mean value between the two groups, and an analysis of covariance test was used for adjusting age as a covariate. The Pearson product-moment correlations were calculated for: iron measures relation to each other and to disease severity, the K-IRLS total score, the sub-factor of the K-IRLS (symptom severity related), the serum ferritin level, the age of symptom onset, and disease duration. Inter-rater reliability on relaxation rate measurements was assessed using the Pearson product-moment correlation coefficient. Results were assumed to be significant at P<0.05.
Results
The clinical characteristics of the study populations are given in Table 1. Between the RLS and control groups, there were no significant differences in age, sex, and serum ferritin level. In the RLS group, the disease duration was 132.7±121.1 months and the mean K-IRLS total score while off medication was 25.3±6.6. The percentage of subjects with prior dopaminergic treatment was 32.4% (12/37). None of the RLS patients showed any gross structural abnormalities of the brain.
 | Table 1 Clinical characteristics of RLS and control subjects expressed as mean ± standard deviation |
The variance accounted for by the linear regression (r2) between the three relaxometry metrics for the SN is shown in Figure 2 and the values for the other four brain regions are shown in Table 2. Although R2 and R2* are purported to be valid measures of tissue iron concentration, the determinant of the coefficient indicates that minimal, if any, relationship exists between these two estimated iron concentration values irrespective of the methods used to define the ROI (Figure 2A: r2=0.13 and Figure 2D: r2=0.01). Although R2′ is determined by the difference between R2* and R2, the correlation between SN values generated by R2′ and R2 techniques were no better than random or chance associations (Figure 2B: r2=0.03 and Figure 2E: r2=0.02). Unlike the relationship between R2 and R2′, R2′ and R2* showed a reasonably close agreement for both the fixed-shape (Figure 2C: r2=0.53, P<0.001) and the semi-automated tracing (Figure 2F: r2=0.66, P<0.001) ROI methods. This would indicate that most of the determinants of R2′ are derived from R2* when used to estimate the iron concentration in the SN. Of the other ROIs (Table 2), the red nucleus using the semi-automated tracing ROI methods showed the strongest R2* to R2′ correlation (r2 = 0.89, P<0.001) and the globus pallidus using the fixed-shape ROI method showed the weakest, though still statistically significant, correlation (r2=0.35, P<0.001). Overall, regardless of the ROI or the method used to determine that ROI, there were significant value agreements between R2′ and R2* with the strongest correlations generally being seen with the semi-automated tracing ROI method.
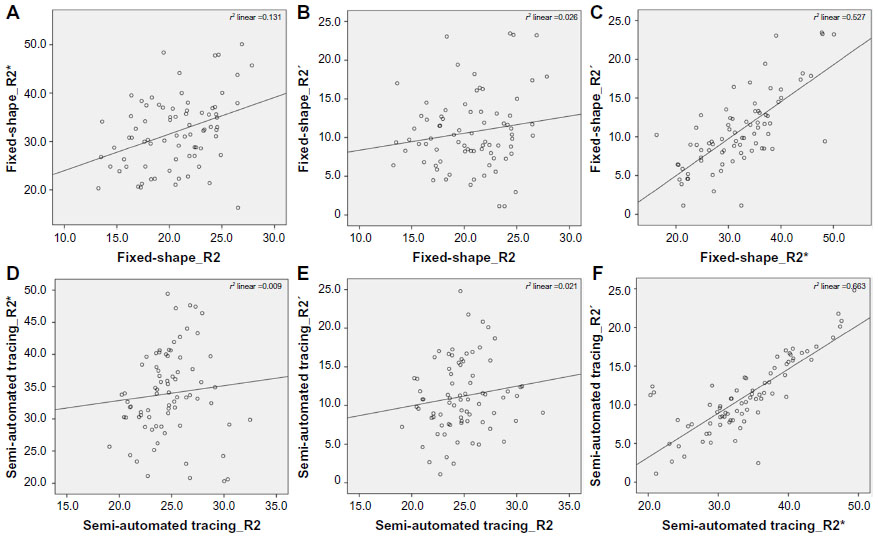 | Figure 2 Correlations between three relaxometry metrics for substantia nigra in each ROI method. |
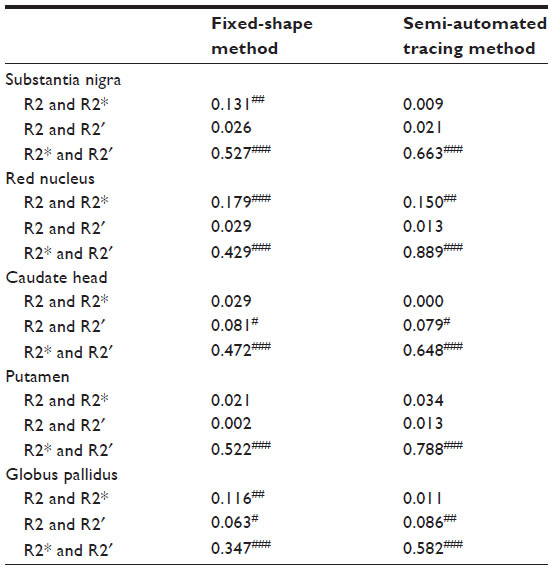 | Table 2 Correlation coefficient (r2) between the three relaxometry metrics for all analyzed brain areas using two different trace methods |
The inter-rater reliabilities of the iron concentration values for the SN were as follows: r=0.970 for R2′ using the fixed-shape ROI method and r=0.958 for R2′ using the semi-automated tracing ROI method. The inter-rater reliabilities for the SN using the other relaxometry metrics were also excellent (r=0.963 for R2, r=0.948 for R2* using the fixed-shape ROI method; r=0.964 for R2, r=0.941 for R2* using the semi-automated tracing ROI method). For the secondary ROIs, the inter-rater reliabilities ranged from 0.804 (globus pallidus, R2) to 0.994 (caudate head, R2) using the fixed-shape ROI method, and from 0.824 (caudate head, R2′) to 0.997 (red nucleus, R2′) using the semi-automated tracing ROI method. These results indicate a strong inter-rater agreement regardless of the ROI method or the relaxometry metrics used. Despite the ability of two individuals to consistently and reliably define the ROI, the two trace methods differ in the amount of variance introduced into the data. The mean area used in the SN for the fixed-shape ROI method was nine pixels with a standard deviation of zero. For the semi-automated tracing ROI methods, the mean area was 24.6 pixels with a standard deviation of 5.4. Given the differences in the total area covered and in the variance induced into the data, it is not surprising that the two methods produced results that were not strongly correlated. When used to determine the SN ROI, the variance accounted for by the regression for the two trace methods with the R2 determinations was essentially zero (Table 3: r2=0.00). With R2* determinations, it was significant but very weak (Table 3: r2=0.15, P<0.01) and with R2′ determinations it was the strongest (Table 3: r2=0.34, P<0.001). As was seen with the correlation between T2 relaxometry methods, the ROI methods (Table 3) showed the strongest relation for the red nucleus (R2 [r2=0.57, P<0.001], R2* [r2=0.48, P<0.001], R2′ [r2=0.70, P<0.001]). The best agreement between the two trace methods for any given ROI occurs with R2* and R2′ determinations and is the poorest with the R2 determinations (Table 3). The agreement between these methods for assessing iron concentrations is thus strongly affected by all the three factors examined in this study: the choice of ROI, the method for determining the ROI, and the T2 relaxometry measurement used. The findings from the SN are a good example to indicate the method-dependent nature of the outcome variable. The mean iron concentration values in RLS and controls groups for SN are shown in Table 4. With the fixed-shape ROI method, the RLS group showed significantly lower iron concentrations for all three relaxometry metrics (R2, P=0.019; R2*, P=0.000; R2′, P=0.003) compared to the control subjects. There were, however, no significant differences between the RLS and the control subjects for any of the relaxometry metrics when the semi-automated tracing ROI method was used. The SN iron concentration of the RLS subjects as determined by the three relaxometry metrics did not correlate with serum ferritin (Table 4) or with the other serum measure of body iron stores (iron, TIBC, percent iron saturation). Clinical variables, including symptom severity, measured by the K-IRLS scale for both the total score (Table 4) and the subscale score (not shown) and the disease duration (not shown) did not correlate with the iron concentration of the SN determined by using either of the two ROI methods for any of the three relaxometry metrics.
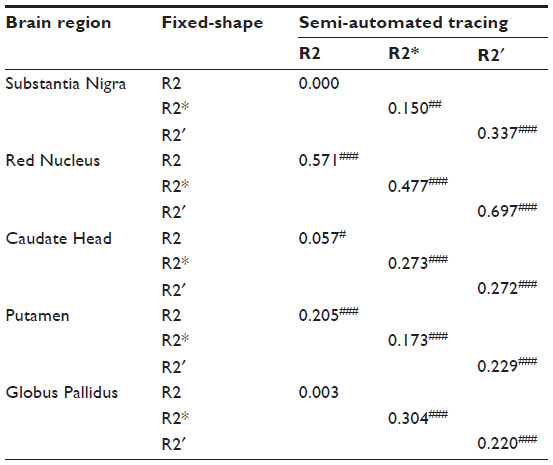 | Table 3 The correlation coefficient (r2) between two different trace methods for each of the three relaxometry metrics in each of the five brain regions |
 | Table 4 The mean (standard deviation) substantia nigra iron index displayed for trace methods and the relaxometry metrics and correlation of iron index to ferritin and to RLS severity |
Table 5 provides the mean iron concentration values for the RLS and control groups as determined for the secondary ROIs. With the fixed-shape ROI method, the iron concentration values for the RLS group were significantly lower in the globus pallidus for all the three relaxometry metrics. Lower values in the RLS group were also found in the red nucleus with R2* and R2′ (P=0.01 for R2*, P=0.008 for R2′), caudate head with R2 (P=0.034), and in the putamen with R2* (P=0.001). However, in the semi-automated tracing ROI method, the iron concentration values for the RLS group was significantly lower only for the red nucleus with both R2* and R2′ relaxometric methods. The iron concentrations from the secondary ROIs, which were significantly lower in the RLS than control group, did not correlate significantly with either the serum iron indices or the clinical variables.
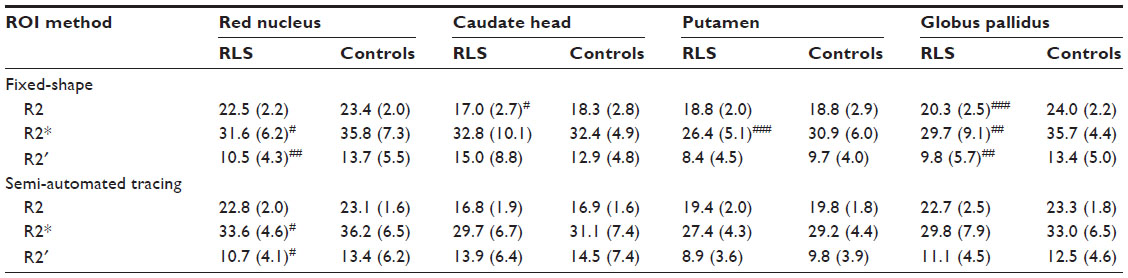 | Table 5 The mean (standard deviation) iron index for secondary ROIs displayed for ROI methods and the T2-relaxometry metrics |
Discussion
Relaxometry techniques
Using postmortem brain samples, both R2 and R2* showed strong correlation with gray mater iron concentrations.29,30 In Parkinson patients vs controls, these two values, however, produced widely different results.5 As tissue water diffusion may affect both R2 and R2* measures, postmortem brain tissue may not reflect the living tissue.31 Hardy et al32 assessed brain iron concentrations in live monkeys using the R2 relaxometry method and then sacrificed the monkeys to determine the tissue iron concentrations. They found a strong correlation between tissue iron concentration and R2 value.32 R2′ value, which is mathematically derived from R2 and R2* (R2*–R2 = R2′), takes into account the field inhomogeneities and does not appear to be affected by the water diffusion properties of tissues that would affect R2 and R2* values.31 Therefore, R2′ values have been considered by some to be the more accurate of the three measures for estimating tissue iron concentration,31 but it is not without its limitations.33 The values of R2′ and R2* significantly correlated with each other for all the ROIs and with both the methods in this study. However, the values of R2 and R2′ did not show any significant correlation in most of the brain regions with either of the ROI methods. These findings may partially explain the inconsistent results obtained in previous studies. There has been evidence that R2′ has a higher iron-related specificity due to the small iron-independent component compared with R2 (1/T2).27,31 The high field strength (eg, 3.0 T) measurements of R2′ has the ability of measuring for small sized areas, such as the SN.34 However, the increased field strength (3T vs 1.5T) may introduce more artifacts due to field inhomogeneity.
There are limitations to all the three relaxometry metrics and these issues have been previously reviewed.35 Despite all the three relaxometry metrics having publications that support their value as measures of tissue iron concentrations, the current study shows how poorly these three values relate to each other. The strongest relation is between R2* and R2′ and weakest is between R2 and R2′, which is not dissimilar to what was found in the smaller study in Parkinson patients.5 Finally, the current results indicate that different relaxometry methods are likely to produce varying results, and it remains unclear as to which, if any, of the methods provides the most accurate assessment of tissue iron in the living human brain. More recently, MRI methods using quantitative susceptibility mapping have been developed that appear to provide more accurate assessment of tissue iron concentrations.36,37
Methods of determining the ROI
The two methods of defining the ROI compared in our study showed strong inter-rater agreement with almost all correlation higher than 0.9. Therefore, the difference between the two trace methods most likely lies in the number of pixels ROI is encapsulating. The fully manual tracing method was commonly used in previous studies to determine SN and other ROIs. The semi-automated tracing ROI method used in this study reflects that technique to a varying degree. In this study, the fully manual tracing method was used for defining ROI in the basal ganglia, while a semi-automated tracing ROI method was used for the SN and red nucleus (Figure 1). As can be seen in Figure 1, the semi-automated tracing ROI method is to a reasonable degree semi-manual and is therefore dependent on visualization of the SN boundaries whose high contrast in the R2 images is very much dependent on the iron content of the tissue. With the semi-automated tracing ROI method, we attempted to capture the full anatomical ROI. So, if the primary outcome is tissue iron concentration and the method for determining the tissue volume or ROI is influenced by that concentration, then that method may be biased against finding a difference, especially if the iron loss affects the peripheral aspects of the ROI. This may be one reason for the inconsistencies observed in RLS studies of SN iron concentration. As the red nucleus has a well-defined border that is less dependent on the iron contrast for R2 image tracing, we would expect more compatibility in the findings between the two methods consistent with our results.
The fixed-shape ROI method, on the other hand, is a fixed size in the center of the SN and thus is not dependent on the visualization of the SN boundaries. The fixed-shape ROI method had no variance in its size, while the semi-automated tracing ROI method for the SN had a variance which was 20% of the mean value. The fixed-shape ROI method compared to the semi-automated tracing ROI method will thus introduce substantially less variance into the data based on trace techniques. The fixed-shape ROI method, however, is biased toward a limited area within the total ROI. The limitation of this method is that it assumes homogeneity of affect but changes in the total ROI iron concentration may not be evenly distributed. Therefore, the iron concentration that is generated using the fixed-shape ROI method may not be representative of the total SN iron concentration. One interpretation of SN RLS results (Table 4) is that the iron is decreased in central region of SN where the fixed-shape was placed, but less so or not at all in other regions of the SN. This would potentially result in a diminishing effect when the total SN is assessed (ie, semi-automated tracing ROI method) depending, of course, on how much of the other parts of the total region also had a reduction in iron. The relation between the two trace methods as applied to the SN, though significant, was only moderate with the regression accounting for only 34% of the variance. The red nucleus had, in contrast, iron concentrations that were significantly lower for RLS group than controls for both trace methods and the regression accounted for 70% of the variance. These differences would be consistent with greater homogeneity in iron changes across the red nucleus than the SN.
MRI finding in RLS studies
All the three relaxometry methods have been used to assess iron concentrations in select brain regions and three different methods have been used to define the ROI (manual, semi-automated, and fixed-shape trace).4,6,16-19,38,39 The first study to use MRI to assess brain iron used R2′ method with 1.5 T MRI, manually traced ROI, and showed decreased SN iron.16 A larger, repeat study by those investigators using R2′ method with 3T MRI, manually traced ROI, found decreased SN iron in RLS patients whose disease expression started before the age of 45 years but not in those with later disease onset.4 R2-determined iron concentration has been the most commonly used technique in the study of RLS.6,7,18,39 The SN iron concentrations were reported as decreased (fixed-shape method,39 semi-automated method17) or as not different (fixed-shape method,18 semi-automated method6). The only reported study using R2* method (1.5T MRI with fixed-shape ROI method) found no difference between the RLS and control groups for the SN.19 Using these three techniques, studies have reported increased,6 decreased,17,18,39 and no difference4,19 in iron concentration of the other brain regions. Of those studies that had found a reduced iron concentration in the SN, three found correlation between SN iron concentration and RLS severity4,16,39 while one study did not.17 No study found an association between peripheral measure of iron and the SN iron concentration.
The studies that first suggested that RLS is associated with low brain iron content found that cerebrospinal fluid levels of the iron storage protein, ferritin, were reduced.40,41 This prompted further studies using different techniques, including MRI, to assess brain iron concentrations. Non-MRI-based iron assessments of the SN have supported the positive MRI studies that have shown decreased SN iron. Iron assessments of postmortem RLS brains have shown lower concentrations of iron in the dopaminergic neurons of the SN.8,9 In studies using B-mode ultrasound imaging of the midbrain, decreased SN iron has been reported in patients with RLS.14,18 In one study, the investigators found significantly reduced SN iron when subjects were assessed with B-mode ultrasound imaging but not with T2 (1/R2) methods using a 1.5T MRI with fixed-shape tracing method.18 Therefore, there are substantial data that are independent of MRI studies, which indicate that iron concentrations in the SN are reduced.
One could argue that the “gold standard” is the autopsied-determined low SN iron in RLS. These results have been supported by alternative methods in the live individual (B-mode ultrasound imaging) and the question should therefore be asked, which MRI relaxometry and ROI methods have sensitivity to identify low iron content in the SN? However, the SN is a composite of distinct nuclear groups and is also anatomically divided into SN pars reticularis (SNr) and SN pars compacta (SNc).42 Tissue iron concentrations are substantially higher in the SNr than in the SNc. The ability even with 7 T MRI to adequately discriminate between these two subregions of the SN is limited.43 The work in RLS autopsy assessment of SN iron examined the cell bodies of the dopamine neurons which are primarily in SNc.11 Therefore, while designing future techniques for the analysis of the iron content of the SN, one needs to consider whether all the ROIs or only selected subregions within the SN, which would be more appropriate as was recently done in patients with Parkinson’s disease, should be considered.43
Conclusion
Despite the assumption made frequently in the literature that the three relaxometry techniques are good measures of tissue iron concentrations, the tissue values generated by R2 had weak or no association with the values generated by R2* and R2′, while these later two indices appear to have a moderate to strong association. The R2* to R2′ relationship, as good as it is, is still markedly dependent on both the trace methods used to delineate and possibly the actual volume of the ROI and also on the ROI that is evaluated. The method that may work to define the iron status in one area (eg, T2* with manual trace method in the red nucleus) may not work in another area (eg, SN). Our study, consistent with the two prior studies using R2′,4,16 found a lower SN iron concentration in RLS subjects than controls, which was significant with one trace method but not the other.
Acknowledgment
This research was supported by Basic Science Research Program through the National Research Foundation (NRF) of Korea funded by the Ministry of Education (2013R1A1A2060973).
Disclosure
The authors report no conflicts of interest in this work.
References
Brass SD, Chen NK, Mulkern RV, Bakshi R. Magnetic resonance imaging of iron deposition in neurological disorders. Top Magn Reson Imaging. 2006;17(1):31–40. | |
Kosta P, Argyropoulou MI, Markoula S, Konitsiotis S. MRI evaluation of the basal ganglia size and iron content in patients with Parkinson’s disease. J Neurol. 2006;253(1):26–32. | |
Argyropoulou MI, Astrakas L. MRI evaluation of tissue iron burden in patients with beta-thalassaemia major. Pediatr Radiol. 2007;37(12):1191–1200. | |
Earley CJ, B Barker P, Horska A, Allen RP. MRI-determined regional brain iron concentrations in early- and late-onset restless legs syndrome. Sleep Med. 2006;7(5):458–461. | |
Graham JM, Paley MN, Grunewald RA, Hoggard N, Griffiths PD. Brain iron deposition in Parkinson’s disease imaged using the PRIME magnetic resonance sequence. Brain. 2000;123:2423–2431. | |
Margariti PN, Astrakas LG, Tsouli SG, Hadjigeorgiou GM, Konitsiotis S, Argyropoulou MI. Investigation of unmedicated early onset restless legs syndrome by voxel-based morphometry, T2 relaxometry, and functional MR imaging during the night-time hours. AJNR. 2012;33(4):667–672. | |
Hening WA. Restless Legs Syndrome. Philadelphia: Saunders/Elsevier; 2009. | |
Connor JR, Boyer PJ, Menzies SL, Dellinger B, Allen RP, Earley CJ. Neuropathological examination suggests impaired brain iron acquisition in restless legs syndrome. Neurology. 2003;61:304–309. | |
Connor JR, Wang XS, Patton SM, et al. Decreased transferrin receptor expression by neuromelanin cells in restless legs syndrome. Neurology. 2004;62(9):1563–1567. | |
Clardy SL, Wang X, Boyer PJ, Earley CJ, Allen RP, Connor JR. Is ferroportin-hepcidin signaling altered in restless legs syndrome? J Neurol Sci. 2006;247(2):173–179. | |
Snyder AM, Wang X, Patton SM, et al. Mitochondrial ferritin in the substantia nigra in restless legs syndrome. J Neuropathol Exp Neurol. 2009;68(11):1193–1199. | |
Connor JR, Ponnuru P, Lee BY, et al. Postmortem and imaging based analyses reveal CNS decreased myelination in restless legs syndrome. Sleep Med. 2011;12(6):614–619. | |
Connor JR, Ponnuru P, Wang XS, Patton SM, Allen RP, Earley CJ. Profile of altered brain iron acquisition in restless legs syndrome. Brain. 2011;134(Pt 4):959–968. | |
Schmidauer C, Sojer M, Seppi K, et al. Transcranial ultrasound shows nigral hypoechogenicity in restless legs syndrome. Ann Neurol. 2005;58(4):630–634. | |
Godau J, Schweitzer KJ, Liepelt I, Gerloff C, Berg D. Substantia nigra hypoechogenicity: definition and findings in restless legs syndrome. Mov Disord. 2007;22(2):187–192. | |
Allen RP, Barker PB, Wehrl F, Song HK, Earley CJ. MRI measurement of brain iron in patients with restless legs syndrome. Neurology. 2001;56(2):263–265. | |
Astrakas LG, Konitsiotis S, Margariti P, Tsouli S, Tzarouhi L, Argyropoulou MI. T2 relaxometry and fMRI of the brain in late-onset restless legs syndrome. Neurology. 2008;71(12):911–916. | |
Godau J, Klose U, Di Santo A, Schweitzer K, Berg D. Multiregional brain iron deficiency in restless legs syndrome. Mov Disord. 2008;23(8):1184–1187. | |
Knake S, Heverhagen JT, Menzler K, Keil B, Oertel WH, Stiasny-Kolster K. Normal regional brain iron concentration in restless legs syndrome measured by MRI. Nat Sci Sleep. 2010;2:19–22. | |
Cho YW, Shin WC, Yun CH, et al. Epidemiology of restless legs syndrome in Korean adults. Sleep. 2008;31(2):219–223. | |
Hening WA, Allen RP, Washburn M, Lesage S, Earley CJ. Validation of the Hopkins telephone diagnostic interview for restless legs syndrome. Sleep Med. 2008;9(3):283–289. | |
Yang J, Kim D, Lee J, et al. The reliability and validity of the Korean versions of the international restless legs scale and the restless legs syndrome quality of life questionnaire. J Korean Neurol Assoc. 2010;28(4):263–269. | |
Walters AS, LeBrocq C, Dhar A, et al. Validation of the International Restless Legs Syndrome Study Group rating scale for restless legs syndrome. Sleep Med. 2003;4(2):121–132. | |
Cho YW, Lee MY, Yun CH, Shin WC, Hong SB, Kim JH. The reliability and validity of the Korean version of paradigm of questions for epidemiology studies of restless legs syndrome and the Johns Hopkins telephone diagnostic interview form for the restless legs syndrome. Journal of the Korean Neurological Association. 2007;25(4):494–499. | |
Cho YW, Lee JH, Son HK, Lee SH, Shin C, Johns MW. The reliability and validity of the Korean version of the Epworth sleepiness scale. Sleep Breath. 2011;15(3):377–384. | |
Sohn SI, Kim do H, Lee MY, Cho YW. The reliability and validity of the Korean version of the Pittsburgh Sleep Quality Index. Sleep Breath. 2012;16(3):803–812. | |
Gelman N, Gorell JM, Barker PB, et al. MR imaging of human brain at 3.0 T: preliminary report on transverse relaxation rates and relation to estimated iron content. Radiology. 1999;210(3):759–767. | |
Cho Z-H. 7.0 Tesla MRI Brain Atlas: In Vivo Atlas with Cryomacrotome Correlation. New York: Springer; 2010. | |
House MJ, St Pierre TG, Kowdley KV, et al. Correlation of proton transverse relaxation rates (R2) with iron concentrations in postmortem brain tissue from alzheimer’s disease patients. Magn Reson Med. 2007;57(1):172–180. | |
Langkammer C, Krebs N, Goessler W, et al. Quantitative MR imaging of brain iron: a postmortem validation study. Radiology. 2010;257(2):455–462. | |
Ordidge RJ, Gorell JM, Deniau JC, Knight RA, Helpern JA. Assessment of relative brain iron concentrations using T2-weighted and T2*-weighted MRI at 3 Tesla. Mag Reson Med. 1994;32(3):335–341. | |
Hardy PA, Gash D, Yokel R, Andersen A, Ai Y, Zhang Z. Correlation of R2 with total iron concentration in the brains of rhesus monkeys. J Magn Reson Imaging. 2005;21(2):118–127. | |
Hikita T, Abe K, Sakoda S, Tanaka H, Murase K, Fujita N. Determination of transverse relaxation rate for estimating iron deposits in central nervous system. Neurosci Res. 2005;51(1):67–71. | |
Gorell J, Ordidge R, Brown G, Deniau J, Buderer N, Helpern J. Increased iron-related MRI contrast in the substantia nigra in Parkinson’s disease. Neurology. 1995;45(6):1138–1143. | |
Haacke EM, Cheng NY, House MJ, et al. Imaging iron stores in the brain using magnetic resonance imaging. Magn Reson Imaging. 2005;23(1):1–25. | |
Bilgic B, Pfefferbaum A, Rohlfing T, Sullivan EV, Adalsteinsson E. MRI estimates of brain iron concentration in normal aging using quantitative susceptibility mapping. Neuroimage. 2012;59(3):2625–2635. | |
Zheng W, Nichol H, Liu S, Cheng Y-CN, Haacke EM. Measuring iron in the brain using quantitative susceptibility mapping and X-ray fluorescence imaging. Neuroimage. 2013;78(0):68–74. | |
Haba-Rubio J, Staner L, Petiau C, Erb G, Schunck T, Macher JP. Restless legs syndrome and low brain iron levels in patients with haemochromatosis. J Neurol Neurosurg Psychiatry. 2005;76(7):1009–1010. | |
Lee B-Y, Farace E, Vesek J, Wang J, Connor J, Yang Q. In vivo measurement of iron deficiency in restless legs syndrome (rls) with voxel-based R2 relaxometry. Proc Intl Soc Mag Reson Med. 2007;15:2170. | |
Earley CJ, Connor JR, Beard JL, Malecki EA, Epstein DK, Allen RP. Abnormalities in CSF concentrations of ferritin and transferrin in restless legs syndrome. Neurology. 2000;54(8):1698–1700. | |
Mizuno S, Mihara T, Miyaoka T, Inagaki T, Horiguchi J. CSF iron, ferritin and transferrin levels in restless legs syndrome. J Sleep Res. 2005;14(1):43–47. | |
Damier P, Hirsch EC, Agid Y, Graybiel AM. The substantia nigra of the human brain. I. Nigrosomes and the nigral matrix, a compartmental organization based on calbindin D(28K) immunohistochemistry. Brain. 1999;122:1421–1436. | |
Blazejewska AI, Schwarz ST, Pitiot A, et al. Visualization of nigrosome 1 and its loss in PD: pathoanatomical correlation and in vivo 7 T MRI. Neurology. 2013;81(6):534–540. |
 © 2015 The Author(s). This work is published and licensed by Dove Medical Press Limited. The
full terms of this license are available at https://www.dovepress.com/terms
and incorporate the Creative Commons Attribution
- Non Commercial (unported, 3.0) License.
By accessing the work you hereby accept the Terms. Non-commercial uses of the work are permitted
without any further permission from Dove Medical Press Limited, provided the work is properly
attributed. For permission for commercial use of this work, please see paragraphs 4.2 and 5 of our Terms.
© 2015 The Author(s). This work is published and licensed by Dove Medical Press Limited. The
full terms of this license are available at https://www.dovepress.com/terms
and incorporate the Creative Commons Attribution
- Non Commercial (unported, 3.0) License.
By accessing the work you hereby accept the Terms. Non-commercial uses of the work are permitted
without any further permission from Dove Medical Press Limited, provided the work is properly
attributed. For permission for commercial use of this work, please see paragraphs 4.2 and 5 of our Terms.