Back to Journals » Journal of Pain Research » Volume 7
A comparison of DigiGait™ and TreadScan™ imaging systems: assessment of pain using gait analysis in murine monoarthritis
Authors Dorman C, Krug H ![]() , Frizelle S, Funkenbusch S, Mahowald M
, Frizelle S, Funkenbusch S, Mahowald M
Received 30 July 2013
Accepted for publication 16 September 2013
Published 24 December 2013 Volume 2014:7 Pages 25—35
DOI https://doi.org/10.2147/JPR.S52195
Checked for plagiarism Yes
Review by Single anonymous peer review
Peer reviewer comments 3
Christopher W Dorman,1 Hollis E Krug,1–3 Sandra P Frizelle,1 Sonia Funkenbusch,1 Maren L Mahowald1–3
1Department of Research, 2Department of Medicine, Minneapolis Veterans Affairs Health Care System, Minneapolis, MN, USA; 3Department of Medicine, University of Minnesota Medical School, Minneapolis, MN, USA
Purpose: Carrageenan-induced arthritis is a painful acute arthritis model that is simple to induce, with peak pain and inflammation occurring at about 3 hours. This arthritis model can be evaluated using semiquantitative evoked or non-evoked pain scoring systems. These measures are subjective and are often time- and labor-intensive. It would be beneficial to utilize quantitative, nonsubjective evaluations of pain with rapid assessment tools. We sought to compare the DigiGait™ and TreadScan™ systems and to validate the two gait analysis platforms for detection of carrageenan-induced monoarthritis pain and analgesic response through changes in gait behavior.
Methods: Non-arthritic mice and carrageenan-induced arthritic mice with and without analgesia were examined. A painful arthritic knee was produced by injection of 3% carrageenan into the knee joint of adult mice. Analgesic-treated mice were injected subcutaneously with 0.015 mg/mL (0.5 mg/kg) buprenorphine. Five-second videos were captured on the DigiGait™ or TreadScan™ system and, after calculating gait parameters, were compared using student's unpaired t-test.
Results: We found the DigiGait™ system consistently measured significantly longer stride measures (swing time, stance time, and stride time) than did TreadScan™. Both systems' measures of variability were equal. Reproducibility was inconsistent on both systems. While both systems detected alterations in some gait measures after carrageenan injection, none of the alterations were seen with both systems. Only the TreadScan™ detected normalization of gait measures after analgesia, but the system could not detect normalization across all measures that altered due to arthritis pain. Time spent on analysis was dependent on operator experience.
Conclusion: Neither the DigiGait™ nor TreadScan™ system was useful for measuring changes in pain behaviors or analgesic responses in acute inflammatory monoarthritic mice.
Keywords: arthritis, mouse, video
Introduction
Carrageenan-induced monoarthritis in mice is simple to induce and highly reproducible. It produces a rapid onset of acute inflammatory arthritis resulting in pain, joint swelling, and hyperalgesia.1,2 The most frequently used method for assessing the severity of carrageenan-induced arthritis is a semiquantitative clinical scoring system. It is based on the degree of inflammation and swelling in the joints and vocal and/or physical displays of pain behavior.3,4 Both the clinical scoring system and the elicitation of pain behavior displays are subjective measures that are time- and labor-intensive. It is desirable, therefore, to find a system by which to objectively evaluate the pain-induced functional abnormalities in murine models of carrageenan-induced monoarthritis.
Spontaneous and evoked gait analysis has been used to evaluate alterations in gait behavior in humans and laboratory animals.5–9 In rodents, several gait analysis systems have been used for measuring arthritis pain.3,10–16 Two gait analysis platforms, DigiGait™ (Mouse Specifics, Inc, Quincy, MA, USA) and TreadScan™ (CleverSys Inc, Reston, VA, USA), have been developed for use with rodent models. Both the DigiGait™ and TreadScan™ have been shown to be simple, sensitive, and objective methods of detecting gait changes in rodent models. These systems have not yet been validated as methods of assessing the severity of changes in the carrageenan-induced monoarthritis mouse model. Objectives of this study were to compare the DigiGait™ and TreadScan™ systems for measuring arthritis pain and analgesia in a quantitative and nonsubjective manner and to determine if these gait analysis systems could detect changes in gait due to carrageenan-induced monoarthritis and analgesic response.
Materials and methods
Hardware
We used two gait analysis systems. The DigiGait™ treadmill uses DigiGait™ Video Imaging Acquisition software (Mouse Specifics, Inc). The ExerGait (XL) treadmill (Columbus Instruments, Columbus, OH, USA) uses BcamCap Image Capture and TreadScan™ software for gait analysis (CleverSys Inc). The ExerGait (XL) and its associated system will be referred to as the TreadScan™ system. The entire TreadScan™ system was purchased from CleverSys Inc.
The DigiGait™ imaging system uses a high-speed, 147 frames-per-second video camera mounted inside a stainless steel treadmill chassis below a transparent treadmill belt to capture ventral images of the subject (Figure 1A and B). The treadmill is lit from the inside of the chassis by two fluorescent lights and overhead by one fluorescent light. The polycarbonate running chamber is 2″ wide and can be adjusted to any length between 163/8″ and 3″. There are small polycarbonate bumpers on the rear and fore walls of the enclosure to discourage contact with either wall. The chamber is free from any sharp or electrified stimuli. Our running chamber was set at 7″ × 2″. The space between the bumpers is 6″. Speed is set with a control knob from 0.1 to 99.9 cm/second.
 | Figure 1 TreadScan™ and DigiGait™ gait analysis systems. |
The TreadScan™ imaging system uses a high-speed, 100 frames-per-second video camera adjacent to a translucent treadmill belt to capture video reflected from a mirror mounted under the belt at 45° (Figure 1C and D). The treadmill is lit by two 3,000 K compact fluorescent light bulbs mounted horizontally 2″ below the belt at 45°. We added a single tubular 15 W overhead fluorescent light mounted 2″ behind the belt and 30″ above it to improve overhead lighting. The dividers, rear wall, and top of the polycarbonate running chamber are translucent green and the front, left, and right sides are clear. The area occupied by the animal is 3″ wide, and length can be adjusted in 1″ increments from 13¾″ to 5¾″. Our chamber was set at 5¾″ × 3″ and was free from any sharp or electrified stimuli. Speed is set with a control knob from 0.1 to 51.1 cm/second.
Software
Images are automatically digitized by DigiGait™ and TreadScan™ systems. DigiGait™ videos are manually cropped and imported then automatically analyzed. After foot detection is maximized, software defines the area of each paw. Vectors associated with each paw facilitate generation of a set of periodic waveforms (Figure 2) that describe the movement of the four limbs. The software identifies the portions of the paw that are in contact with the treadmill belt in the stance phase of stride as well as tracks the foot through the swing phase of stride. Measures are calculated for 41 postural and kinematic metrics of gait.
 | Figure 2 DigiGait™ periodic waveforms. |
One or more segments of video may be selected in the TreadScan™ system after importation for analysis. We opted to select a single continuous 5-second video segment. TreadScan™ requires background, calibration, and foot model files (described in “Video processing” section), which must be manually generated. Software algorithms define paw area and identify the area of paw contact with the belt in the stance phase of stride. Measures are calculated for 37 postural and kinematic metrics of gait.
Experimental procedure
Animals
The study population consisted of 154 female C57BL/6J mice from The Jackson Laboratory (Bar Harbor, ME, USA) aged 12 weeks at time of testing. All animal procedures and protocols were approved by the Minneapolis Veterans Administration Health Care System (VAHCS) Institutional Animal Care and Use Committee and conformed to the “Guide for the Care and use of Laboratory Animals”.17 Mice were maintained in the Animal Care and Research Facility at the Minneapolis VAHCS, a facility approved by the Association for Assessment and Accreditation of Laboratory Animal Care International (AAALAC). Mice were acclimated to the vivarium for 1 week before participating in the experiment. All mice were housed in groups of eight in standard polycarbonate 18¾″ × 10¼″ × 8¼″ cages with water and standard rodent diet ad libitum and environmental conditions maintained at 72°F±1°F and 33%±1% humidity, with 12-hour light/dark cycle.
Animal groups
Four experimental cohorts of 16 animals included non-arthritic mice with and without analgesia and carrageenan-induced arthritic mice with and without analgesia. These four cohorts were tested on each system (64 mice per system). Sixteen non-arthritic mice were tested on both systems without analgesia in addition to the experimental cohorts. Six additional mice were run on the DigiGait™ and TreadScan™ systems at varying speeds (Speed Test) and four were run on the two systems to determine the average analysis time. All experimental groups exceeded the median sample size of n=9 recommended for modern pain research.18 A total of 13 mice were excluded from analysis due to the inability to obtain analyzable video.
Carrageenan and buprenorphine injections
Carrageenan lambda (CAT # 3889; Sigma-Aldrich, St Louis, MO, USA) diluted to 3% with normal saline was injected 3 hours prior to treadmill testing. A 500 μL Hamilton syringe tipped with a 30-gauge ½″ needle sheathed with a 0.38 mm inner diameter tube covering all but 2.5 mm of the needle was used to standardize injection depth. Mice were anesthetized with isoflurane in oxygen (induction and maintenance 3%, 1 L/minute) for 3 ± 1 minutes. The left knee was shaved and the skin disinfected with 70% ethanol solution. Ten microliters of carrageenan solution was injected through the patellar tendon into the tibiofemoral joint. Analgesia was produced in non-arthritic mice and carrageenan-induced arthritic mice with 100 μL of 0.015 mg/mL (0.5 mg/kg) buprenorphine dilution injected subcutaneously at time of carrageenan injection. Animals recovered under a heat lamp until normal ambulatory motion was observed.
Video acquisition and video cropping
The lights on the DigiGait™ and TreadScan™ were turned on 5 minutes prior to testing to reduce lighting fluctuation. Knees were colored black with a nontoxic surgical marker to prevent the software from identifying a shaved knee as a foot. A background frame was captured for use during data processing before mice were placed in the TreadScan™ system. An analyzable run was a 5-second video segment without wall or bumper contact. Mice ran a maximum of three trials to accomplish an analyzable run. The treadmill was stopped when an acceptable run was captured, 2 minutes passed without capturing a run, or the mouse could not run without contacting the rear wall of the enclosure. The mouse received a 30-second rest if an acceptable run was not captured. The trial was restarted and the same procedure was followed. The mouse was designated as noncompliant and the run omitted if the mouse failed to accomplish an analyzable run after 3 trials.
DigiGait™ records continuous video that is later cropped to 5 seconds. Videos were cropped by selecting the fourth frame prior to the last frame of the stance phase and adding 734 frames to make a 5-second video.
The TreadScan™ system employs a user-selected video length ranging from 1/100 of a second to 20 seconds. Image capture was initiated when mice displayed a stable gait, but was restarted if mice did not complete a useable run within 20 seconds. Completed videos were cropped by selecting the first frame of a run and adding 500 frames to make a 5-second video for analysis.
Video processing
Chamber boundaries must be defined, foot detection maximized, and run speed entered for each video after DigiGait™ videos are cropped but before gait analysis. Videos are selected as a group and automatically processed once these parameters are entered. Frame by frame, the DigiGait™ software determines the area and direction of each pixel of each paw and identifies its x, y, and t coordinates in space and time.19 The software determines directional vectors for each pixel to accurately determine whether a portion of the paw is on or off the belt. Waveforms describe the advance and retreat of the four paws as the software defines the area of each paw.
TreadScan™ requires that background, calibration, and foot model data files be loaded or generated before analysis can begin. The background file is a reference picture of the running chamber. It must be captured with the same lighting conditions as the recorded trials as subtle changes in lighting can contribute to errors in paw recognition. It can be generated from a video with an animal in the running chamber or a picture of the empty running chamber. Providing a picture of the empty running chamber is less time-consuming and more accurate. The software uses a calibration file as a reference for the boundaries of the running chamber and to calculate metrics during analysis. A file can be reused for any video that uses the same chamber dimensions and camera treadmill orientation. The user defines the chamber dimensions and orientation as a reference for the software. The file must be adjusted if the camera or treadmill is moved after file creation. The foot model data file is generated by progressing through a series of individual frames, manually identifying the plantar surface of a paw on the belt, and saving the color profile (red, green, blue bandwidths) of that paw. CleverSys Inc recommends selecting six to 12 frames for each paw. We found foot models have better accuracy when every frame of one stance phase (15–20 frames) is selected. An established file can be edited by adding more paw segments or by adjusting the limits of the red, green, and blue bandwidths. Analysis can proceed once the accessory files are generated and loaded.
Post-processing quality control
DigiGait™ post-processing accuracy was reviewed by counting the number of frames with paw recognition errors (when the software recognized a paw as off the treadmill when it was on, or vice versa). No more than six frames (0.04 seconds) of inaccuracy at both the swing-to-stance transition and stance-to-swing transition were allowed. Foot parameters were readjusted in videos that failed quality control, then analysis was rerun and quality control review repeated. Correction of analyzed video is performed through three commands: “Correct,” “Connect,” and “Delete.” “Correct” overwrites a section of analysis where the software recognized the paw as on the treadmill when it was off. “Connect” overwrites a section of analysis where the paw was recognized as off the treadmill when it was on. “Delete” removes a section of analysis completely.
TreadScan™ displays basic swing and stance measurements in a “foot results view” window highlighting outliers. This window allows for review and correction of specific stride segments. Results presented in the foot results view window are adjusted using three commands: “delete stance segment only,” “delete stance and swing,” and “combine next stance.” “Delete stance segment only” deletes stance segments where the foot was not on the treadmill. “Delete stance and swing” deletes an entire stride. “Combine next stance” merges two adjacent stance segments, removing an incorrectly recognized swing.
The TreadScan™ foot results view was reviewed once analysis was complete and outlier segments were reviewed for accuracy. A maximum of four frames (0.04 seconds) of inaccuracy at both the swing-to-stance transition and stance-to-swing transition were allowed without requiring correction. Foot model data were adjusted to better recognize the paws in any videos with contact recognition errors. Videos were rejected if contact recognition errors could not be corrected.
Data export
Both DigiGait™ and TreadScan™ data were exported as groups. DigiGait™ creates two Excel (Microsoft Corporation, Redmond, WA, USA) spreadsheets of 41 gait and postural measurements. One spreadsheet contains measures organized by foot, forelimb, and hind limb. The second spreadsheet contains measures from the first sheet organized by animal along with percentage, ratio, and variability calculations. TreadScan™ creates a single Excel spreadsheet of 37 gait and postural measurements organized by foot, forelimb, and hind limb.
Statistical methods
Data were analyzed with Student’s unpaired t-test to compare five gait parameters in four limbs between conditions, giving 20 comparisons for each equipment system. The effect of DigiGait™ belt speed on left hind limb stride time in non-arthritic mice was analyzed using one way analysis of variance (ANOVA). All results are presented as the mean and standard deviation (SD).
Results
Animals
A total of 154 mice were tested on 210 runs. Thirteen of 154 mice (8.4%) were excluded because an analyzable video could not be obtained or the video failed quality control.
Experiment progression
A range of treadmill speeds and run times was tested to determine the maximum speed and duration at which mice with severe monoarthritis could perform. We determined 5 seconds to be the optimum time period during which mice were able to maintain a constant gait prior to testing experimental cohorts. This resulted in capture of approximately 14 strides. Stride consists of a stance (weight-bearing) and a swing (non-weight-bearing) phase. A previous study has reported C57BL/6J mice running up to 116.7 cm/second.20 We found that 17.0 cm/second was a speed fast enough to prevent mice from standing but slow enough to allow mice with severe inflammatory monoarthritis to maintain a gait free from contact with the rear bumper or wall. Success within the first 5 seconds of capture was maximized by placing mice on a moving treadmill rather than placing them on a stationary treadmill. Because initial results suggested significant differences between the two systems using two groups of non-arthritic mice, 16 non-arthritic mice were tested on both systems with the speed dial set at 17.0 cm/second. After measuring the belt speed of each system with a tachometer, six non-arthritic mice were tested at varying speeds on both systems.
Gait analysis measures
Stride, stance, and swing times, stride length, and stride frequency were measured to detect changes in gait. These five measures are often used in existing publications of gait analysis in preclinical models.10–13,21–23 Two different groups of 14 (16 minus two excluded in each group) non-arthritic mice showed significantly longer left hind limb swing times, stance times, and stride times with DigiGait™ compared to TreadScan™ (Figure 3). Left hind limb stride length was 5.8 cm with DigiGait™ and 4.62 cm with TreadScan™ (P<0.05). Left hind limb stride frequency was 3.5 steps/second with DigiGait™ and 3.0 steps/second with TreadScan™ (P<0.05). These consistent differences in gait measurement suggested possible differences in belt speed and/or animal characteristics.
 | Figure 3 Comparison of TreadScan™ and DigiGait™ gait measurements in the left hind paw in two groups of non-arthritic mice. |
Another group of 14 (16 minus two excluded) mice were tested with both systems with the belt speed set at 17.0 cm/second (Table 1). There were significant differences between the two systems comparing individual limbs. The range of values for mean swing time in the four limbs was 0.110 to 0.118 seconds with DigiGait™ and 0.099 to 0.119 seconds with TreadScan™. Mean swing time was significantly longer in the two hind limbs with DigiGait™ (P<0.05). Mean stance time ranged between 0.192 to 0.197 seconds with DigiGait™ and 0.178 to 0.197 seconds with TreadScan™. Mean stance time was significantly longer in the right and left forelimbs with DigiGait™ (P<0.05). Mean stride time ranged from 0.304 to 0.309 seconds with DigiGait™ and 0.291 to 0.298 seconds with TreadScan™. Mean stride time was significantly longer in the right forelimb with DigiGait™ (P<0.05). Mean stride length ranged from 5.16 to 5.35 cm with DigiGait™ compared to 4.62 to 4.72 cm with TreadScan™. Mean stride length was significantly longer with DigiGait™ in all four limbs (P<0.05). Stride length depends on animal size and belt speed. Mean stride frequency ranged from 3.24 to 3.36 steps/second with DigiGait™ and 3.37 to 3.45 steps/second with TreadScan™. There were no statistically significant differences in stride frequency. Since the same animals were measured with both systems, the discrepancy in stride lengths suggested the belt speeds might not be the same.
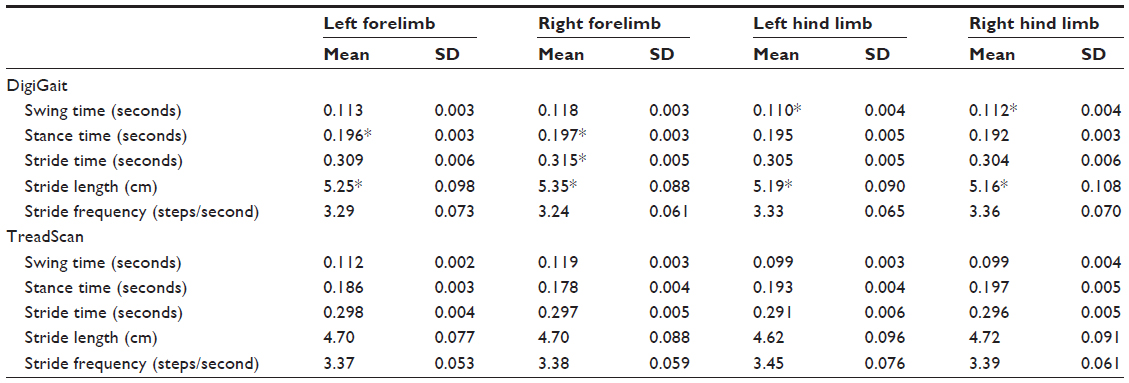 | Table 1 DigiGait™ and TreadScan™ gait analyses of a single group of non-arthritic mice with belt speed set at 17 cm/second |
Exact belt speed was measured with a tachometer (DT 105A LCD Contact Tachometer; Shimpo Instruments, Itasca, IL, USA). The speed set to 17.0 cm/seconds on the TreadScan™ control dial was accurate at 17.1 cm/second; however, the DigiGait™ set speed of 17.0 cm/second was actually 18.75 cm/second. Gait parameters were then measured at 14, 17, and 20 cm/second with the TreadScan™ and 14, 17, 18.75, and 20 cm/second with the DigiGait™ using the same six mice (four or five videos analyzed per speed), and the slopes were calculated to determine whether there was a linear relationship between measurements and treadmill speed with DigiGait™ (Figure 4). Slopes were significantly different from zero in at least three limbs in all measures except swing time. Left hind limb stance and stride time were higher and swing time, stride length, and stride frequency were lower when animals were run at 17.0 cm/second than at 18.75 cm/second, but the difference between the two speeds was not statistically significant (data not shown) and the magnitude of the difference was not as great as the differences between the two systems. Therefore, the discrepancy between TreadScan™ and DigiGait™ measures could not be entirely attributed to the difference in belt speeds.
 | Figure 4 The effect of DigiGait™ belt speed on left hind limb stride time in non-arthritic mice. |
Variability and reproducibility
Variability was assessed as the SD of group means in non-arthritic mice (n=16 minus two excluded) for all measures in all four limbs. Variability of mean swing, stance, and stride times was small, from 0.003 to 0.006 with DigiGait™ and from 0.002 to 0.006 with TreadScan™. Variability of mean stride length was 0.088 to 0.108 with DigiGait™ and 0.077 to 0.096 with TreadScan™. Variability of mean stride frequency was 0.061 to 0.073 with DigiGait™ and 0.053 to 0.076 with TreadScan™. These SDs were similar between these two systems (Table 1).
Reproducibility of gait measures between two groups of non-arthritic mice (n=14 and n=5) obtained at two different testing sessions was compared within each system. Five gait parameters were measured in the four limbs for a total of 20 comparisons. Twelve of the comparisons were significantly different between the two groups with DigiGait™. Eleven comparisons were significantly different between the two groups with TreadScan™ (Table 2). Swing time and stride length were reproducible with DigiGait™ in all limbs. Stance time was reproducible in all limbs with TreadScan™, and all five measures were reproducible in the left forelimb. In addition, the right hind limb swing time was reproducible with TreadScan™.
 | Table 2 Comparison of reproducibility between groups in two systems in non-arthritic mice (P-values of two-sided t-test) |
Comparison of sensitivity of gait analysis to detect monoarthritis pain and analgesic response
Comparison of gait measures in the left hind limb between groups of non-arthritic mice (n=14) and arthritic mice (n=16) showed a significantly longer swing time in the arthritic limb with DigiGait™ (P<0.05) (Table 3). Stance time, stride time, stride length, and stride frequency did not differ significantly in the left hind (arthritic) limb with DigiGait™. Swing time did not differ significantly in the left hind (arthritic) limb with TreadScan™. Stance time, stride time, and stride length were significantly longer in the left hind limb with TreadScan™ (P<0.05). Stride frequency was significantly shorter with TreadScan™ (P<0.05).
 | Table 3 Gait analysis measures to detect painful arthritic limp and analgesic effects in the left hind limb by two-sided t-test |
The model of carrageenan-induced monoarthritis provides a contralateral non-arthritic right hind limb to examine gait alterations in the same animal (Table 4). The intra-animal differences between left arthritic and right control hind limbs were not significant in the five gait measures with either system.
 | Table 4 Sensitivity of gait analysis measures to detect intra-animal gait changes in acute carrageenan-induced monoarthritis |
Sensitivity to treatment effect in an arthritic limb was assessed with systemic buprenorphine treatment of arthritic animals (DigiGait™ n=16 minus 2 excluded, TreadScan™ n=16) (Table 3). Buprenorphine treatment of mice with monoarthritis did not affect swing time or stride frequency with either system. Stance time and stride length were significantly shorter with both systems as compared to the arthritic mice (P<0.05). Stride time was significantly less in buprenorphine-treated arthritic mice measured with DigiGait™ (P<0.05). Systemic buprenorphine significantly normalized stance time and stride length in arthritic mice and trended towards normalization of stride time with TreadScan™. The increased swing time seen in arthritic mice with DigiGait™ only increased further with buprenorphine. Systemic buprenorphine in non-arthritic mice (DigiGait™ n=16 minus 2 excluded, TreadScan™ n=16) caused significant changes in swing and stance times using DigiGait™ and significant changes in all gait parameters except stance time using TreadScan™ (data not shown). These systemic effects on gait make interpretation of analgesic effects of gait changes in arthritic mice difficult.
The effect of operator experience on time required to conduct gait analysis
The time to process data acquired from the treadmills by an experienced and novice operator was compared. Data processing with TreadScan™ involved capturing a reference background image, selecting a 5-second video segment, and manually creating a foot model. Analysis was performed and paw recognition accuracy was reviewed. DigiGait™ data processing consisted of selecting a 5-second video segment, maximizing foot detection, analyzing videos, and reviewing paw recognition. It took the DigiGait™ software approximately 8 minutes per mouse to analyze the 5-second video after review by the operator. Analysis does not require the operator to be present.
The experienced operator ran 82 groups of eight mice with the DigiGait™ system and 40 groups of eight with the TreadScan™ system prior to this comparison experiment. The novice operator had trained on the two systems but had never performed a solo analysis. The experienced operator was able to complete testing of four mice using the TreadScan™ in 76 minutes while the novice operator required 141 minutes. Both operators spent the majority of time creating foot models. It took the experienced operator 74 minutes to complete testing of four mice with DigiGait™ and the novice operator 105 minutes. Approximately 32 minutes of this time was used by the computer to analyze the video segment. The time it takes to test mice is clearly related to the experience level of the operator.
Discussion
To our knowledge, this is the first report comparing the TreadScan™ to the DigiGait™ system and the first to evaluate gait changes due to joint pain with carrageenan-induced acute inflammatory monoarthritis on either system.
Results obtained with the two systems were not equivalent. Five gait parameters from all four limbs were measured with each system (20 pair-wise comparisons). Nine of these comparisons were significantly different between the two systems. It is possible that the combination of differing chamber sizes, chamber colors, lighting setups, animal sizes, belt speeds, and algorithms used to track feet could have accounted for these discrepancies. The DigiGait™ chamber size is ¼″ longer than the TreadScan’s™ chamber. This may have induced the mice to extend their stride in the chamber. The DigiGait™ chamber was clear acrylic and the TreadScan™ chamber was green acrylic. TreadScan’s™ green-walled chamber could affect gait since mice would see this as a dark surface because they have red–green color blindness.24
Neither system had acceptable reproducibility; only 45% of measures with TreadScan™ and 40% of measures with DigiGait™ were reproducible. This variability in gait measures in normal mice made measuring gait analysis in studies of monoarthritis pain and treatment difficult.
The sensitivity to detect monoarthritis pain was low and variable. DigiGait™ data showed a significantly longer swing time comparing the left hind limb of those mice with intra-articular injections of 3% carrageenan to normal control mice. TreadScan™ measures of left hind limb stance time, stride time, and stride length were significantly higher in arthritic animals compared to non-arthritic animals. Stride frequency was significantly less when performing the same comparison. Swing time was the only measure that did not change significantly with TreadScan™. Plaas et al14 using a monoarticular osteoarthritis model found stride time did not change significantly using the TreadScan™ system inclined to 17°, and an increased stance time by day 5 was observed, similar to our findings. There were no compensatory gait changes in that study. Plaas et al reported that lack of compensatory gait changes in the contralateral non-arthritic limb suggested the increased stance time in the arthritic limb was probably sufficient to stabilize locomotion. Although arthritic animals in our studies showed some gait alteration in the arthritic limb compared to normal non-arthritic animals, similar to the findings of Plaas et al, there was no significant difference in the two hind limbs of the arthritic animals.
Treatment of arthritic animals with systemic buprenorphine normalized TreadScan™ stance time and stride length. We did not see an analgesic effect on swing time with systemic buprenorphine when measured with DigiGait™. Systemic buprenorphine did lower stance time, stride time, and stride length significantly with DigiGait™ in arthritic mice compared to non-arthritic mice. Alterations in gait due to systemic buprenorphine alone suggested that the effects of systemic buprenorphine may make interpretation of any potential analgesic effect impossible. A previous study has shown a decrease in joint tenderness when arthritic animals were tested with systemic buprenorphine as measured by evoked pain response (tenderness to palpation),25 confirming an analgesic effect of this drug. Using TreadScan™, Plaas et al reported an increase in stance time in mice with osteoarthritis and return to baseline with intra-articular hyaluronan,14 and Coulthard et al15 demonstrated a similar increase in stance time after plantar injection of complete Freund’s adjuvant in rats that normalized with systemic buprenorphine. However, our study is the first to evaluate gait analysis as a measure of pain and analgesia with buprenorphine in acute inflammatory monoarthritis in mice.
Detection in changes of gait parameters may be improved with an increased frame rate. Allen et al16 state that, while commercial systems that automate the collection of gait events are available, many of these systems record at 100 frames per second. These systems, in their current configuration, are unlikely to be sensitive enough to detect stance time imbalance and gait asymmetry shifts between 1% and 3%, even with idealized digitization codes. Allen et al used a camera with a frame rate of 200 frames per second. The increased frame rate might improve the accuracy in gait measurements, thereby reducing variability and increasing statistical significance.
Comparison of other features of DigiGait™ and TreadScan™ systems
We evaluated five factors related to equipment durability, user interface, ease of foot detection, cost, and support. The hardware materials in both systems have advantages and disadvantages. Moving the DigiGait™ is simple because it is an enclosed system on coasters. The DigiGait™ system is not affected by ambient lighting because the lighting is internal and fixed. DigiGait™ has built-in excrement collection trays. The software in DigiGait™ was user-friendly during setup and analysis because it was more automated. The DigiGait™ allowed rapid optimization of foot detection. The organizational system for video storage and the user interface were simple and intuitive. The analysis phase for a group of eight mice took 1 hour but did not require operator presence, freeing the operator for other tasks.
The DigiGait™ system did not allow adjustment of the foot model during analysis. The time required for quality control was greater than TreadScan™, and videos that failed quality control had to be reanalyzed completely. DigiGait’s™ belt speed and speed dial were pre-calibrated; however, after more than 2 years of use, the selected speed was no longer accurate. In our trial, there was a 1.75 cm/second difference between the dial setting and the actual belt speed. This speed difference did not produce statistically different results. The fact that the control knob and belt speed did not agree highlights the need for routine speed standardization and periodic maintenance.
The belt settings on TreadScan™ were accurate after 3 years of use. The operator controls in the TreadScan™ system allowed extensive adjustment of foot models during analysis. The computer analysis was quick, and quality control was easily performed in real time.
It was more difficult to maintain uniform lighting in the TreadScan™, as well as to clean this system. TreadScan™ was not self-contained, so moving the equipment disturbed the calibration of the system. Analysis was highly contingent on an optimal ambient and equipment lighting setup. The treadmill did not have an excrement-catching component. It took much longer to create foot models for analysis. TreadScan™ had many accessory files required for analysis. These files were cumbersome to track and upload.
Both DigiGait™ and TreadScan™ provided live phone support. Representatives were helpful, available, and knowledgeable. TreadScan™ periodically checked in with our lab to see how their software was performing. Support was provided without charge. Neither company used an automatic update system for their software. The costs of the two systems were similar.
Conclusion
Gait abnormalities due to acute inflammatory monoarthritis in female mice were difficult to detect with either of the gait analysis systems studied in this comparison. No significant differences between arthritic and non-arthritic hind limbs of arthritic mice were found with either system, and results were not reproducible between groups.
These two systems did not demonstrate large enough changes in gait parameters to use this methodology for investigating changes in pain behaviors or analgesic responses in acute inflammatory monoarthritic mice. Our findings support the need for further research with alternative technologies for measuring spontaneous pain behaviors.
Acknowledgment
This work was supported by The Department of Veterans Affairs.
Disclosure
The authors report no conflicts of interest in this work.
References
Hansra P, Moran EL, Fornasier VL, Bogoch ER. Carrageenan-induced arthritis in the rat. Inflammation. 2000;24(2):141–155. | |
Neugebauer V, Han JS, Adwanikar H, Fu Y, Ji G. Techniques for assessing knee joint pain in arthritis. Mol Pain. 2007;3:8. | |
Vincelette J, Xu Y, Zhang LN, et al. Gait analysis in a murine model of collagen-induced arthritis. Arthritis Res Ther. 2007;9(6):R123. | |
Anderson S, Krug H, Dorman C, McGarraugh P, Frizelle S, Mahowald M. Analgesic effects of inter-articular botulinum toxin Type B in a murine model of chronic degenerative knee arthritis pain. J Pain Res. 2010;3:161–168. | |
Chester VL, Biden EN, Tingley M. Gait analysis. Biomed Instrum Technol. 2005;39(1):64–74. | |
Kerrigan DC, Todd MK, Della Croce U, Lipsitz LA, Collins JJ. Biomechanical gait alterations independent of speed in the healthy elderly: evidence for specific limiting impairments. Arch Phys Med Rehabil. 1998;79(3):317–322. | |
O’Connor BL, Visco DM, Heck DA, Myers SL, Brandt KD. Gait alterations in dogs after transection of the anterior cruciate ligament. Arthritis Rheum. 1989;32(9):1142–1147. | |
Mountney A, Leung LY, Pedersen R, Shear D, Tortella F. Longitudinal assessment of gait abnormalities following penetrating ballistic-like brain injury in rats. J Neurosci Methods. 2013;212(1):1–16. | |
Janicek J, Lopes MA, Wilson DA, Reed S, Keegan KG. Hindlimb kinematics before and after laser fibrotomy in horses with fibrotic myopathy. Equine Vet J. 2012;44 Suppl 43:126–131. | |
Allen KD, Griffin TM, Rodriguiz RM, et al. Decreased physical function and increased pain sensitivity in mice deficient for type IX collagen. Arthritis Rheum. 2009;60(9):2684–2693. | |
Piesla MJ, Leventhal L, Strassle BW, et al. Abnormal gait, due to inflammation but not nerve injury, reflects enhanced nociception in preclinical pain models. Brain Res. 2009;1295:89–98. | |
Simjee SU, Jawed H, Quadri J, Saeed SA. Quantitative gait analysis as a method to assess mechanical hyperalgesia modulated by disease-modifying antirheumatoid drugs in the adjuvant-induced arthritic rat. Arthritis Res Ther. 2007;9(5):R91. | |
Berryman ER, Harris RL, Moalli M, Bagi CM. Digigait quantitation of gait dynamics in rat rheumatoid arthritis model. J Musculoskelet Neuronal Interact. 2009;9(2):89–98. | |
Plaas A, Li J, Riesco J, Das R, Sandy JD, Harrison A. Intraarticular injection of hyaluronan prevents cartilage erosion, periarticular fibrosis and mechanical allodynia and normalizes stance time in murine knee arthritis. Arthritis Res Ther. 2011;13(2):R46. | |
Coulthard P, Pleuvry B, Brewster M, Wilson KL, Macfarlane TV. Gait analysis as an objective measure in a chronic pain model. J Neurosci Methods. 2002;116(2):197–213. | |
Allen KD, Mata BA, Gabr MA, et al. Kinematic and dynamic gait compensations resulting from knee instability in a rat model of osteoarthritis. Arthritis Res Ther. 2012;14(2):R78. | |
Guide for the Care and use of Laboratory Animals, 8th Ed. National Research Council (US). Committee for the Update of the Guide for the Care and Use of Laboratory Animals. Institute for Laboratory Animal Research (US); National Academies Press (US) Publisher; Washington, DC:National Academies Press. 2011. | |
Mogil JS, Ritchie J, Sotocinal SG, et al. Screening for pain phenotypes: analysis of three congenic mouse strains on a battery of nine nociceptive assays. Pain. 2006;126(1–3):24–34. | |
DigiGait™ Imaging System Installation/Operation Manual. Quincy, MA: Mouse Specifics, Inc; 2009. | |
Totsuka Y, Nagao Y, Horii T, et al. Physical performance and soleus muscle fiber composition in wild-derived and laboratory inbred mouse strains. J Appl Physiol. 2003;95(2):720–727. | |
Wooley CM, Zing S, Burgess RW, Cox GA, Seburn KL. Age, experience and genetic background influence treadmill walking in mice. Physiol Behav. 2009;96(2):350–361. | |
Clarke KA, Still J. Gait analysis in the mouse. Physiol Behav. 1999; 66(5):723–729. | |
Amende I, Kale A, McCue S, Glazier S, Morgan JP, Hampton TG. Gait dynamics in mouse models of Parkinson’s disease and Huntington’s disease. J Neuroeng Rehabil. 2005;2:20. | |
Jacobs GH, Williams GA, Cahill H, Nathans J. Emergence of novel color vision in mice engineered to express a human cone photopigment. Science. 2007;315(5819):1723–1725. | |
Krug HE, Frizelle SP, McGarraugh P, Mahowald ML. Pain behavior measures to quantitate joint pain and response to neurotoxin treatment in murine models of arthritis. Pain Med. 2009;10(7):1218–1228. |
 © 2013 The Author(s). This work is published and licensed by Dove Medical Press Limited. The
full terms of this license are available at https://www.dovepress.com/terms
and incorporate the Creative Commons Attribution
- Non Commercial (unported, 3.0) License.
By accessing the work you hereby accept the Terms. Non-commercial uses of the work are permitted
without any further permission from Dove Medical Press Limited, provided the work is properly
attributed. For permission for commercial use of this work, please see paragraphs 4.2 and 5 of our Terms.
© 2013 The Author(s). This work is published and licensed by Dove Medical Press Limited. The
full terms of this license are available at https://www.dovepress.com/terms
and incorporate the Creative Commons Attribution
- Non Commercial (unported, 3.0) License.
By accessing the work you hereby accept the Terms. Non-commercial uses of the work are permitted
without any further permission from Dove Medical Press Limited, provided the work is properly
attributed. For permission for commercial use of this work, please see paragraphs 4.2 and 5 of our Terms.