Back to Journals » Clinical Interventions in Aging » Volume 10
A comparison between uni- and multidimensional frailty measures: prevalence, functional status, and relationships with disability
Authors Roppolo M, Mulasso A, Gobbens R ![]() , Mosso C, Rabaglietti E
, Mosso C, Rabaglietti E ![]()
Received 13 July 2015
Accepted for publication 18 August 2015
Published 22 October 2015 Volume 2015:10 Pages 1669—1678
DOI https://doi.org/10.2147/CIA.S92328
Checked for plagiarism Yes
Review by Single anonymous peer review
Peer reviewer comments 3
Editor who approved publication: Dr Richard Walker
Mattia Roppolo,1,2 Anna Mulasso,1 Robbert J Gobbens,3,4 Cristina O Mosso,1 Emanuela Rabaglietti1
1Department of Psychology, University of Torino, Torino, Italy; 2Department of Developmental Psychology, Rijksuniversiteit Groningen, Groningen, the Netherlands; 3Faculty of Health, Sports and Social Work, Inholland University of Applied Sciences, Amsterdam, the Netherlands; 4Zonnehuisgroep Amstelland, Amstelveen, the Netherlands
Background: Over the years, a plethora of frailty assessment tools has been developed. These instruments can be basically grouped into two types of conceptualizations – unidimensional, based on the physical–biological dimension – and multidimensional, based on the connections among the physical, psychological, and social domains. At present, studies on the comparison between uni- and multidimensional frailty measures are limited.
Objective: The aims of this paper were: 1) to compare the prevalence of frailty obtained using a uni- and a multidimensional measure; 2) to analyze differences in the functional status among individuals captured as frail or robust by the two measures; and 3) to investigate relations between the two frailty measures and disability.
Methods: Two hundred and sixty-seven community-dwelling older adults (73.4±6 years old, 59.9% of women) participated in this cross-sectional study. The Cardiovascular Health Study (CHS) index and the Tilburg Frailty Indicator (TFI) were used to measure frailty in a uni- and multidimensional way, respectively. The International Physical Activity Questionnaire, the Center of Epidemiologic Studies Depression scale, and the Loneliness Scale were administered to evaluate the functional status. Disability was assessed using the Groningen Activity Restriction Scale. Data were treated with descriptive statistics, one-way analysis of variance, correlations, and receiver operating characteristic analyses through the evaluation of the areas under the curve.
Results: Results showed that frailty prevalence rate is strictly dependent on the index used (CHS =12.7%; TFI =44.6%). Furthermore, frail individuals presented differences in terms of functional status in all the domains. Frailty measures were significantly correlated with each other (r=0.483), and with disability (CHS: r=0.423; TFI: r=0.475). Finally, the area under the curve of the TFI (0.833) for disability was higher with respect to the one of CHS (0.770).
Conclusion: Data reported here confirm that different instruments capture different frail individuals. Clinicians and researchers have to consider the different abilities of the two measures to detect frail individuals.
Keywords: functional decline, older adults, health outcomes, active aging, indexes selection
Introduction
Frail older adults show a decreased ability to cope with external stressors and to react to life events, due to a loss in their physiological reserve.1–3 As a consequence, even small perturbations may have a negative and drastic impact on the daily lives of individuals. In fact, frail older adults are more likely to incur several clinically relevant negative health outcomes, such as disability, falls, cognitive decline, hospitalization, institutionalization, and death.2,4–6 In an aging world, it is important to focus on early signs and indicators of future adverse events, in order to prevent aging-related functional decline and to promote and increase the healthy life years. Current data show that healthy life years are decreasing over time, with a consequent longer life in a poor health condition or disability.7 Furthermore, the prevalence rate of frailty is extremely high and is growing constantly, with up to 40% of older adults at high risk for incurring negative health outcomes.8–11 The identification of frail individuals is paramount in the field of health promotion and prevention, and currently has been recognized as a priority for the effective implementation of the active and healthy aging strategies.12 Despite the great impact and implications that the recognition of frail individuals may have on societal and individual levels, a consensus definition, conceptualization, and operationalization of frailty has not yet emerged, as suggested by Ensrud et al.13,14
The existing plethora of frailty indexes and instruments can be basically subdivided into two different conceptualizations. On the one hand, scholars identified frailty as a unidimensional construct, oriented to the physical domain of functioning and the biological/physiological state.2,15,16 On the other hand, it is every day more used and accepted as a multidimensional definition of frailty, based on the analysis of interrelations and complex interactions of the physical, psychological, and social domains of functioning.17–19 These controversial visions of the construct resulted in a large number of instruments and tools used to assess frailty.20,21 Nowadays, the number of different instruments precludes the use of a common frailty measure in clinical and nonclinical settings, and to adopt specific and shared strategies in relation to the frailty status. Evidence shows that, in general, the frailty condition is associated with health outcomes.2,4–6,22 However, different instruments or conceptualizations may vary a lot in terms of detection of frail individuals and explanation of negative outcomes.9
Many studies have already analyzed similarities and differences among frailty measures.6,13,14,23–32 The majority of them compared two or more unidimensional frailty instruments based exclusively on the physical dimension of frailty.13,14,23–25 In example, Cigolle et al23 compared three instruments of frailty, based on distinct theoretical view of frailty: 1) the Functional Domains model, 2) the Frailty Index (FI), and 3) the index of the Cardiovascular Health Study (CHS). Results reported that different models, based on different conceptualization, capture different groups of frail older adults. These differences may be translated into different relations with different risks for adverse outcomes. Ensrud et al13,14 compared the Study of the Osteoporotic Fractures (SOF) index with the CHS index. They found differences in terms of distributions of the frailty status using the two indexes, with a higher difference in the prefrail category (CHS identified a higher percentage of individuals than the SOF). Both the instruments were associated with an increasing rate of negative outcomes (falls, disability, fractures, and mortality), and no differences were found in the prediction levels between the two indexes in relation to the outcomes used. Also, Woo et al24 compared three indexes of physical frailty – the CHS index; the Fatigue, Resistance, Ambulation, Illness, and Loss (FRAIL) scale; and the Hubbard scale – with the FI. Results reported that all the instruments predicted adverse outcomes. Differences were found in the detection of prefrail and frail individuals: the CHS categorized more individuals as frail than did the other two clinical measures.
To the best of our knowledge, however, only a study by Metzelthin et al29 compared different multidimensional frailty measures. They examined the psychometric properties of three well-identified frailty instruments as the Tilburg Frailty Indicator (TFI), the Groningen Frailty Indicator (GFI), and the Sherbrooke Postal Questionnaire (SPQ). Also in this study, it emerged that the prevalence rate of frail individuals varied with the type of instrument used, with a higher percentage of frail individuals for the SPQ. The TFI and the GFI showed a good level of agreement.
Lastly, studies that compare uni- and multidimensional measures of frailty are very limited. Pilotto et al6 compared the accuracy of four measures of frailty (the SOF index, the cumulative deficits index, the Comprehensive Geriatric Assessment [CGA], and the Multidimensional Prognostic Index [MPI]) in a sample of hospitalized older adults. Results showed great diversity in detecting frail and prefrail older adults. The CGA reported the lowest rate for frail and prefrail, while the MPI reported the highest. Furthermore, all the indexes were associated with 1-year mortality. Also, Hoogendijk et al30 compared five frailty measures (the clinical judgment of the general practitioner, the prescription of multiple medications, the GFI, the PRISMA-7, and the self-rated health) with two reference standards: the CHS index and the clinical judgment of an expert panel. Results showed that frailty prevalence ranged from 11.6% of the CHS to 36.4% of the GFI, and the accuracy ranged from poor of the GFI to good of the PRISMA-7. Jung et al31 developed a new multidimensional measure of frailty, the KLoSHA frailty index (KFI), and compared it with the CHS and the SOF indexes. They found prevalence rates ranged from 9.2% of the SOF index to 15.6% of the KFI, and reported better predictive ability of the KFI for functional decline and mortality in comparison with the other two instruments. Finally, Theou et al32 compared the ability to predict all-cause mortality of eight frailty instruments (the GFI, the TFI, the FI, the FI based on a CGA, the clinical frailty scale, the CHS index, the Edmonton frail scale, and the FRAIL scale), showing that the FI and the Edmonton frail scale are the most accurate measures for predicting mortality.
Overall, studies on the comparison between uni- and multidimensional measures of frailty are still few and present some limitations. First, in some cases, instruments used as multidimensional measures of frailty are based on a series of indicators (eg, disability, comorbidity, polypharmacy, cohabitation status) that have been recognized as determinants of frailty or frailty consequences, and not as direct measures of frailty status.4,33 Second, they focus mainly on the prevalence rate of frailty and on the ability of frailty to determine health outcomes, without taking into account differences, in terms of functional ability (eg, physical, psychological, and social status), among individuals categorized as frail by the selected instruments. However, it is important to understand whether different measures, based on different conceptualizations, capture different individuals. In other words, it is essential to understand whether uni- and multidimensional measures capture as frail individuals that have really a functional decline in the domains under study.
In this view, the main aim of this paper is to proceed a step forward in the analysis of correspondence and prediction of different conceptualizations of frailty, by means of a comparison between a unidimensional and a multidimensional index of frailty.
On the unidimensional level, the main and the best known conceptualization of frailty is the one proposed by Fried et al2 who defined frailty as “a biologic syndrome of decreased reserve and resistance to stressors, resulting from cumulative declines across multiple physiologic systems”. The operational definition that results is the CHS index, based on the presence of three or more of five physical components: shrinking, weakness, poor endurance and energy, slowness, and low physical activity level. The CHS index is one of the most common frailty measures in both clinical and research settings. On the multidimensional level, in line with the assumptions of a biopsychosocial model,34,35 Gobbens et al17 defined frailty as “a dynamic state affecting an individual who experiences losses in one or more domains of human functioning” with consequently higher risk for adverse outcomes. Starting from this definition, the TFI was operationalized and developed.36 The TFI is based on an integral conceptual model of frailty, including physical, psychological, and social components of frailty and excluding disability. Currently, the TFI is adopted mainly in research settings,37–41 and its use in clinical practice is spreading.
Consequently, the specific objectives of this paper are: 1) to assess the prevalence of frailty using a unidimensional (CHS) and a multidimensional (TFI) instrument; 2) to analyze differences in the physical, psychological, and social functioning among individuals captured as frail or robust by the two measures; 3) to investigate relations between uni- and multidimensional measures of frailty; and 4) to compare their criterion validity for disability, in a sample of community-dwelling older adults.
Materials and methods
Study population and procedures
Two hundred and sixty-seven community-dwelling older adults participated in the present study. Participants were recruited through seniors’ associations located in Piedmont Region (Italy). A list of seniors’ associations located in the area of interest was prepared. A preliminary meeting in which researchers presented the study was organized in each of the available associations. No randomization or stratification strategies were performed. Participation was voluntary, and no incentives or rewards were assigned. Written informed consent was collected for each participant, according to Italian law and the ethical code of the American Psychological Association.42 The study was approved by the ethical committee of the University of Torino. The following inclusion criteria were set: 1) age 65 years and over, 2) Italian mother tongue, and 3) no institutionalization. Individuals who presented contraindications to the administration of physical measures (eg, recent fractures, recent surgical operations), or who were unable to walk independently with or without assistive devices were excluded from the study.
Approximately 498 older adults were contacted, of whom 190 (38%) declined to participate, 23 (5%) did not meet the selection criteria due to severe physical restrictions, and 18 (4%) dropped out of the study. The final response rate was 53%.
After the preliminary meeting, individuals who were interested in participating and who met the selection criteria were invited to fill out autonomously the battery of questionnaires at their home. Approximately 1 week later, all participants were invited to return the questionnaires and to execute physical tests. These tests were always administered in the same order and individually for each participant by qualified and trained staff, consisting of a psychologist and an expert in physical activity for older adults. In this session, the psychologist asked each participant about difficulties encountered in filling out the questionnaires and checked for any missing answers.
Measures
Unidimensional frailty
The five criteria proposed by Fried et al2 in the cycle of frailty were used here to measure physical frailty. Specifically, the five components are: shrinking, weakness, poor endurance and energy, slowness, and low physical activity level. These components were operationalized as follows: Body mass index less than 21 kg/m2 was used as an indicator of shrinking, as proposed by Avila-Funes et al.43 Weight was measured with a Tanita Body Composition Analyzer BF-350 (precision level of 0.1 kg), and height with an anthropometer (precision level of 0.1 cm, International Standard ISO/TR 7250-2, 2010). Weakness was identified with hand grip strength. In this study, the same cutoff scores proposed in the CHS were applied.2 A manual dynamometer (Baseline Smedley digital hand dynamometer, model 12-0286) was used to measure grip strength. Three attempts of maximal isometric hand grip strength were executed, alternating sides, and the best value of the six measurements was used.44 The following two items of the Center of Epidemiologic Studies Depression scale (CES-D) were used to assess poor endurance and energy: 1) I felt that everything I did was an effort, and 2) I could not get going.45 The statements are referred to the last week. As proposed by Fried et al2 those who answered “a moderate amount of the time (3–4 days)” or “most of the time” to at least one of the questions were categorized as positive for this criterion. The timed up and go test was used to evaluate slowness. Individuals were instructed to rise from a chair, walk 3 m, turn round a cone, walk back, and sit down.46 The timed up and go test was performed once, in addition to an untimed trial. Reference values of Bohannon were used to classify individuals as frail for slowness.47 The metabolic equivalents of oxygen consumption (MET-minutes/week) computed with the International Physical Activity Questionnaire (IPAQ) was used as an indicator of physical activity level.48 As proposed in the Guidelines for Data Processing and Analysis of the IPAQ, those who did not reach a minimum of 600 MET-minutes/week were classified as frail for low physical activity.
Each component was categorized as “0” for nonfrail and “1” for frail. The final score was computed by adding the points in the five components. According to Fried et al2 individuals with a final score equal to or greater than 3 were categorized as frail.
Multidimensional frailty
The Italian version of the TFI was used to detect multidimensional frailty.49,50 The TFI is composed of two parts: 1) Part A contains ten questions on determinants of frailty (eg, sex, age, marital status, level of education, and lifestyle) and 2) Part B includes 15 items on components of frailty. These questions are grouped into three domains of human functioning: physical, psychological, and social. The physical domain (range: 0–8) is comprised of eight questions related to physical health, unexplained weight loss, difficulty in walking, balance, vision problems, hearing problems, strength in hands, and physical tiredness. The psychological domain (range: 0–4) includes four items about cognition, depressive symptoms, anxiety, and coping. The social domain (range: 0–3) consists of three questions related to living alone, social relations, and social support. Eleven questions of Part B have two categories of answer: “yes” and “no”, while the others have three: “yes”, “sometimes”, and “no”, dichotomized into 0 and 1. The total score of the TFI ranges from 0 to 15. Higher scores correspond to a more serious frailty status. In terms of sensitivity and specificity for negative outcomes, the best cutoff value that distinguishes frail from robust individuals is 5.36
Outcome
The selected outcome for this study was disability, which was investigated using the Groningen Activity Restriction Scale (GARS).51,52 The GARS is a non-disease-specific questionnaire composed of 18 items that investigates the autonomy in carrying out basic and instrumental activities of daily living. Each item has four response options, with a total score ranging from 18 (absence of disability) to 72 (severe disability). The cutoff score was set at 29.53 The GARS is a valid and reliable scale52 commonly administered to the aged population.54,55 The GARS internal consistency obtained in this study was optimal (α =0.90).
Additional measures
The following additional measures were captured in order to analyze differences in terms of functional status. The physical domain was investigated using the IPAQ, 7-item version.48,56 The MET-minutes/week score was used in the analysis. With regard to the psychological domain, the CES-D, 10-item version, was used.45,57 Concerning the social component, the Loneliness Scale, 11-item version, was administered.58,59
Statistical analysis
All the analyses were conducted using the Statistical Package for Social Sciences (SPSS), version 20.0 (SPSS Inc, Chicago, IL, USA). The statistical significance level was fixed at α <0.05 for all tests.
Descriptive statistics were performed for all the study variables. The prevalence rates of frail individuals, measured with the CHS and the TFI, were compared using the Venn diagram.
The one-way analysis of variance (ANOVA) with the Sidak post hoc was used to detect differences in functional status among individuals categorized differently by the uni- and multidimensional frailty instruments. Four categories were obtained : 1) robust for both the instruments, 2) frail according to the CHS index, 3) frail according to the TFI, and 4) frail for both the instruments.
Finally, relationships among unidimensional frailty, multidimensional frailty, and disability were analyzed using Pearson’s correlations. The criterion validity of the two measures for disability was determined using the receiver operating characteristic (ROC) analyses through the evaluation of the areas under the curves (AUCs) with 95% confidence intervals. Sensitivity and specificity were calculated for the cut points of the CHS index (score ≥3) and the TFI (score ≥5).
Results
Participants’ characteristics
The majority of participants (n=160, 59.9%) were female, and their mean age was 73.4 (standard deviation [SD] =6.0, range: 65–90). Most of them were born in the north of Italy (59.9%), were married (66.3%), had a level of attainment corresponding to secondary school (43.1%), and carried out a nonmanual job (55.0%). A large number of participants were referred to having one or more chronic diseases (70.4%). With respect to frailty condition, the mean CHS total score was 1.37 (SD =1.00, range: 0–4) with a prevalence of frail individuals of 12.7% (n=34, CHS score ≥3). With respect to the single components of CHS, the following rates of frailty were found: 10.9% (n=29) for shrinking, 65.5% (n=175) for weakness, 25.8% (n=69) for poor endurance and energy, 19.1% (n=51) for slowness, and 15.4% (n=41) for low physical activity level. The mean TFI total score was 4.40 (SD =2.56, range: 0–12) with a prevalence of frail individuals of 44.6% (n=119, TFI score ≥5). Items with the highest prevalence were “Poor eyesight” (46.4%) in the physical domain, “Feeling nervous or anxious” (69.3%) and “Feeling down” (61.0%) in the psychological domain, and “Lack of people around” (53.2%) in the social domain. The characteristics of participants are summarized in Table 1.
 | Table 1 Main characteristics of participants |
Correspondence between uni- and multidimensional frailty measures
The prevalence rates were the following: 141 (52.8%) and 27 participants (10.1%) were, respectively, robust and frail for both the CHS and the TFI, 92 (34.5%) were frail for the TFI, and 7 (2.6%) were frail for the CHS. In addition, for the proportion of individuals detected as frail, 21.4% was found as frail from the two instruments. The majority (79.4%) of people identified as frail in the CHS were also detected as frail in the TFI. However, seven individuals were frail just for the CHS, and were not detected as frail in the TFI. The percentages of frail individuals detected by the two instruments and their shared part are reported in Figure 1.
 | Figure 1 Venn diagram of the detected frail individuals by the CHS index and the TFI. |
Differences in the functional status according to frailty measures
The one-way ANOVA showed differences, in terms of functional status, among individuals categorized as robust or frail by the two instruments.
On the physical domain, the level of energy expenditure per week (MET-minutes/week, IPAQ total score) was statistically different among groups (F(3,263) =6.314, P<0.001). Specifically, robust participants had a higher level of MET-minutes/week in comparison with individuals categorized as frail by both the instruments (P<0.001). Moreover, frail individuals according to the TFI had higher energy expenditure in comparison with individuals categorized as frail by both the instruments (P=0.016). On the psychological domain, the depressive symptomatology measured using the CES-D was statistically different among groups (F(3,263) =34.102, P<0.001). In particular, robust individuals showed a lower level of depression than frail individuals captured with the TFI (P<0.001) and both of the instruments (P<0.001). On the social domains, differences were found on social isolation measured using the Loneliness Scale (F(3,263) =4.096, P=0.007). Specifically, individuals detected as frail by the TFI resulted in being more socially isolated than robust participants did (P=0.022). Results of the one-way ANOVA are presented in Table 2.
 | Table 2 Differences in the functional status according to frailty measures |
Relationship between uni- and multidimensional frailty measures and disability
The two frailty instruments turned out to be correlated with each other (r=0.483, P<0.001). Moreover, the CHS was positively correlated with the physical (r=0.419, P<0.001), psychological (r=0.369, P<0.001), and social (r=0.211, P<0.001) domains of the TFI. Furthermore, GARS was positively correlated with both the CHS (r=0.423, P<0.001) and the TFI (r=0.475, P<0.001). Results of the correlations are presented in Table 3.
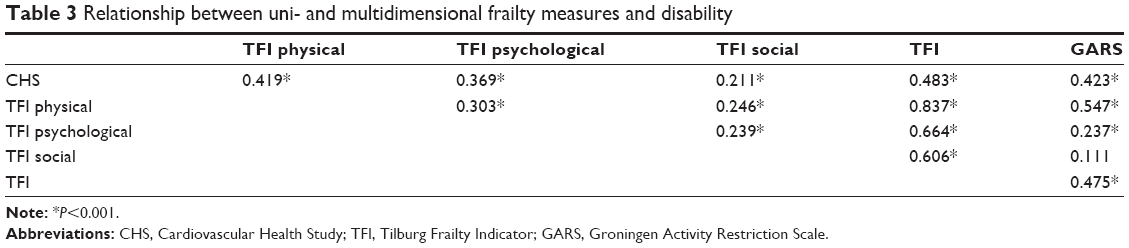 | Table 3 Relationship between uni- and multidimensional frailty measures and disability |
Criterion validity of uni- and multidimensional frailty measures for disability
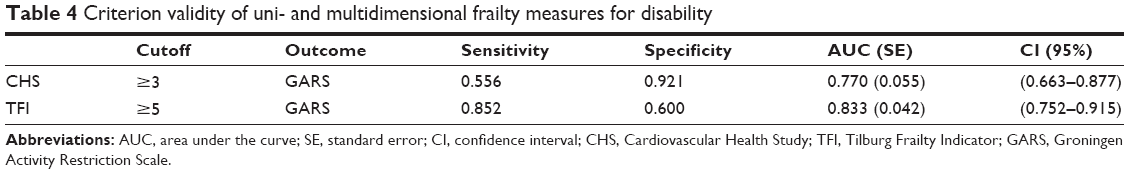
In Table 4, the results of ROC analysis of the CHS and the TFI for the disability outcome are reported. The CHS showed an AUC of 0.770 (SE =0.055) for disability, representing a fair criterion validity. With a cutoff score ≥3, sensitivity was 0.556 and specificity 0.921. The TFI showed an excellent criterion validity for disability, with an AUC of 0.833 (SE =0.042). With a cutoff score ≥5, sensitivity was 0.852 and specificity 0.600. No statistically significant differences (P>0.05) were found between the two AUCs of the ROC curves. Figure 2 shows the AUCs for the CHS and the TFI.
 | Table 4 Criterion validity of uni- and multidimensional frailty measures for disability |
 | Figure 2 ROC curves for prediction of disability with CHS index and TFI. |
Discussion
This paper analyzed the prevalence rate of frail older adults and the relationships between frailty status and the disability outcome based on two different frailty instruments. These instruments are based on a unidimensional and a multidimensional conceptualization and operationalization of frailty status. The aims of the paper were to ascertain whether different instruments, based on different conceptualizations, differ in their ability to capture frail individuals; to analyze whether individuals categorized as frail by the two frailty measures show differences in terms of functional status; and to investigate how these measures are related to each other and to disability.
The prevalence rate of frail individuals was 44.6% for the TFI and 12.7% for the CHS. These data reflect the enormous difference in terms of identification of individuals at risk for developing negative health outcomes. Furthermore, considering 126 individuals (47.1% of the whole sample) detected as frail by, at least, one instrument, just 27 (10.1% of the whole sample) were found frail by both the instruments. Similar findings were made by Cigolle et al23 in whose study 30.2% of participants were detected as frail by at least one out of the three instruments used and just 3.1% were detected as frail according to all models. The study of Metzelthin et al29 also found great differences in the prevalence of frailty status in regard to the instrument used. Specifically, they reported a range from 40.2% of frail cases using the TFI up to 59.1% using the SPQ. The study of Pilotto et al6 showed that 33.7% of participants were detected as frail by the FI-SOF model, 21.6% were found at a severe risk for all causes of mortality by the MPI frailty model, and 1.1% were found at a severe grade of frailty by the FI-CGA model. Finally, the study of Woo et al24 also demonstrated a large difference among instruments in their ability to capture frail older adults. In fact, they reported prevalence rates of 47.9%, 14.0%, and 1.6% using the CHS index, the FRAIL scale, and the Hubbard scale, respectively. In contrast, the studies of Ensrud et al13,14 revealed that the two indexes used (the CHS and the SOF) had a good concordance rate in the screening of frail individuals (74% and 71%), with prevalence rates of 16% and 17%, respectively, for the CHS and the SOF in the female sample, and of 14% and 13% for the CHS and the SOF in the male sample.
Data reported in the present study seem to confirm that two different instruments based on different conceptualizations detect different individuals as frail. However, it is important to note that differences in the frailty prevalence may be caused by the conceptualization and operationalization of frailty. In fact, individuals categorized as frail by the CHS, the TFI, or both were generally different from each other and from the robust sample on the physical, psychological, and social functional status. As a speculation, it is possible to hypothesize that frail individuals captured only by the CHS may have a low physical status, while the psychological and social still have a satisfactory functional reserve. On the other hand, frail individuals only for the TFI may be described as individuals with poor performance on the psychological and social domain, while the physical status may maintain a good level of performance. Finally, individuals detected as frail by both the instruments may show a consolidated functional decline in all the three domains. This assumption is mainly confirmed by the data, in which, on the physical side frail individuals for both the instruments had a lower level of physical activity when compared with the robust and frail for the TFI groups. However, the comparison with frail individuals for the CHS was not significant. On the psychological side, it is possible to notice that frail individuals for the TFI and for both the instruments had a higher level of depression compared with the robust group. Individuals frail for the TFI, instead, did not show differences with the CHS group. Finally, individuals frail for the TFI demonstrated lower social functioning in comparison with the robust group. Individuals frail for the TFI, instead, did not show differences with the robust group. However, no differences were found between individuals frail for both the instruments and the robust subgroup. These data seem to give a first confirmation about our speculation, but due to the very limited number of participants in some of the subgroups, a more detailed analysis has to be performed in the future.
Furthermore, this study showed that the CHS and the TFI are positively correlated with each other. Moreover, it was found that, as expected, the CHS had the highest correlation with the physical domain of the TFI, while the correlations with the psychological and social domains were again positive and significant but weaker. Both the instruments were correlated with disability. Specifically, the TFI had a higher correlation than the CHS, and the highest correlation was obtained with the physical domain of the TFI. These data are completely in line with the results of previous studies,13,14,29 showing that different frailty instruments, based on different conceptualizations of the construct, have a good convergent validity. However, the correlation indexes (ranged between 0.211 and 0.483) demonstrated that the instruments were not completely overlapping in their ability to rate the functional status of older adults. Moreover, both the instruments significantly correlated with the GARS. Compared to the CHS, the TFI showed the highest correlation (r=0.475 for TFI; r=0.423 for CHS) with a value in line with the one reported by Metzelthin et al.29
The relationship between the two measures of frailty and disability is further corroborated by the ROC analysis. The AUC values of the CHS index and the TFI for disability were satisfactory, with slightly better results for the TFI compared to the CHS index. However, the two AUC values did not statistically differ from each other. Sensitivity and specificity represent promising results from this analysis. In fact, the CHS showed low sensitivity and high specificity, whereas the TFI showed high sensitivity and low specificity. This means that the CHS index allows one to better classify with respect to the TFI the robust older adults who are correctly identified as not having the frailty condition, and, in contrast, the TFI permits to better detect compared to the CHS the frail individuals who are correctly identified as such. In other words, using the TFI, the possibility for a frail subject to be classified as robust is limited, and the opposite occurs using the CHS. Ideally, the better frailty instrument should have a sensibility and a specificity corresponding to 100%. However, in reality, there are trade-offs for the sensibility and specificity values. In this study, the TFI with 85% sensitivity detects 85% of individuals with frailty (true positive), and the 15% with frailty go undetected (false negatives). In contrast, the CHS index correctly recognizes 55% of people with frailty, and the 45% affected by frailty are not identified as such. With respect to specificity, the TFI with 60% specificity correctly reports 60% of robust individuals (true negative), and the 40% of individuals without the condition are incorrectly identified as frail (false-positive). Conversely, the CHS index correctly detects the 92% of robust individuals, and the 8% of robust individuals are classified as frail. Since frailty is a preclinical condition, mainly used for preventive purposes, and it has a strong impact on disability and more in general on adverse events, it seems better to prefer high sensibility to high specificity. In this way, it is possible to correctly identify at risk individuals who can benefit from preventive and health promotion interventions.
Our study presented some limitations that should be noted while interpreting the results. First, participants living in a small area of Italy were involved, making it impossible to generalize the results to the entire Italian aged population. Second, the cross-sectional design of the research did not allow to establish the predictive value of frailty on disability, limiting the possibility to study the trajectories of frailty over time and their impact on the outcomes. Third, the sample size within the groups used in the ANOVA was, in some cases, very limited. This analysis should be intended as a first step toward understanding whether different frailty measures capture as frail individuals with different functional status in each of the domains analyzed. More data will be necessary to confirm the assumptions made in this paper. Finally, there was an overlapping between the indicators used as dependent variables in the ANOVA (the IPAQ and the CES-D) and the CHS index. In fact, the IPAQ and the two items of the CES-D were used to categorize frail individuals for physical activity level, and poor endurance and energy component, respectively. This overlapping may contribute to the differences found in the ANOVA, and further analysis with the use of a larger number of functional status indicators (eg, walking time, memory, social network size) will be needed.
Despite these limitations, the findings reported here are consistent with those achieved by other studies.13,14,23,29 In addition, this paper analyzed differences in terms of functional status among people categorized as frail by the two instruments. These results may contribute to a better understanding of the definition and the operationalization of frailty and its connections with functional status and health outcomes. In our view, the use of a multidimensional scale would guarantee a better identification of individuals at risk for negative health outcomes, since the strict interrelationships among functional domains in the aging process. Data reported may help clinicians and researchers to select the frailty measure that better fits with their scopes and needs, identifying a specific target population for the implementation of more suitable health promotion interventions. Future studies will need to be conducted with a longitudinal research design in order to verify the causal relationships between frailty indexes and health outcomes.
Acknowledgment
Funding has been received from the project for publication of this paper “Sistema di allerta integrato delle fragilità emergenti” within the Regional call “Bando Regionale a sostegno di progetti di ricerca industrial e/o sviluppo sperimentale di applicazioni integrate e innovative in ambito Internet of Data” funded by Regione Piemonte and the “Fondo Europeo di Sviluppo Regionale (POR-FESR). The funding bodies were not involved in the study design, data collection, and analysis or in writing the report.
Disclosure
Anna Mulasso and Mattia Roppolo received a research fellowship from the Department of Psychology, University of Torino (reference number 17/2015, protocol n 320), funded by “Regione Piemonte” and the “Fondo Europeo di Sviluppo Regionale (POR-FESR)”, for the project “Sistema di allerta integrato delle fragilità emergenti”.
The authors report no other conflicts of interest in this work.
References
Buchner D, Wagner E. Preventing frail health. Clin Geriatr Med. 1992;8(1):1–17. | ||
Fried LP, Tangen CM, Walston J, et al. Frailty in older adults evidence for a phenotype. J Gerontol A Biol Sci Med Sci. 2001;56(3):M146–M157. | ||
Rockwood PK, Hogan DB, MacKnight C. Conceptualisation and measurement of frailty in elderly people. Drugs Aging. 2000;17(4):295–302. | ||
Van Kan G, Rolland Y, Bergman H, Morley JE, Kritchevsky SB, Vellas B. The I.A.N.A Task Force on frailty assessment of older people in clinical practice. J Nutr Health Aging. 2008;12(1):29–37. | ||
Bergman H, Ferrucci L, Guralnik J, et al. Frailty: an emerging research and clinical paradigm – issues and controversies. J Gerontol Biol Sci Med Sci. 2007;62(7):731–737. | ||
Pilotto A, Rengo F, Marchionni N, et al. Comparing the prognostic accuracy for all-cause mortality of frailty instruments: a multicentre 1-year follow-up in hospitalized older patients. PLoS One. 2012;7(1):e29090. | ||
Eurostat. Population Projections 2008–2060. Luxemburg: Eurostat; 2008:1–4. | ||
Collard RM, Boter H, Schoevers RA, Oude Voshaar RC. Prevalence of frailty in community-dwelling older persons: a systematic review. J Am Geriatr Soc. 2012;60(8):1487–1492. | ||
Santos-Eggimann B, Cuénoud P, Spagnoli J, Junod J. Prevalence of frailty in middle-aged and older community-dwelling Europeans living in 10 countries. J Gerontol Biol Sci Med Sci. 2009;64(6):675–681. | ||
Shamliyan T, Talley KM, Ramakrishnan R, Kane RL. Association of frailty with survival: a systematic literature review. Ageing Res Rev. 2013;12(2):719–736. | ||
Slaets JP. Vulnerability in the elderly: frailty. Med Clin North Am. 2006;90(4):593–601. | ||
European Commission. Active Ageing and Solidarity between Generations. A Statistical Portrait of the European Union 2012. Vol 1. Luxembourg: Office for Official Publication of the European Communities; 2012. | ||
Ensrud KE, Ewing SK, Taylor BC, et al. Comparison of 2 frailty indexes for prediction of falls, disability, fractures, and death in older women. Arch Intern Med. 2008;168(4):382–389. | ||
Ensrud KE, Ewing SK, Cawthon PM, et al. A comparison of frailty indexes for the prediction of falls, disability, fractures, and mortality in older men. J Am Geriatr Soc. 2009;57(3):492–498. | ||
Carrière I, Colvez A, Favier F, Jeandel C, Blain H; Group E study. Hierarchical components of physical frailty predicted incidence of dependency in a cohort of elderly women. J Clin Epidemiol. 2005;58(11):1180–1187. | ||
Gloth FM, Walston J, Meyer J, Pearson J. Reliability and validity of the frail elderly functional assessment questionnaire. Am J Phys Med Rehabil. 1995;74(1):45–53. | ||
Gobbens RJ, Luijkx KG, Wijnen-Sponselee MT, Schols JM. Towards an integral conceptual model of frailty. J Nutr Health Aging. 2010;14(3):175–181. | ||
Markle-Reid M, Browne G. Conceptualizations of frailty in relation to older adults. J Adv Nurs. 2003;44(1):58–68. | ||
Walston J, Hadley EC, Ferrucci L, et al. Research agenda for frailty in older adults: toward a better understanding of physiology and etiology: summary from the American Geriatrics Society/National Institute on Aging Research Conference on Frailty in Older Adults. J Am Geriatr Soc. 2006;54(6):991–1001. | ||
De Vries NM, Staal JB, van Ravensberg CD, Hobbelen JSM, Olde Rikkert MGM, Nijhuis-van der Sanden MWG. Outcome instruments to measure frailty: a systematic review. Ageing Res Rev. 2011;10(1):104–114. | ||
Sternberg SA, Wershof Schwartz A, Karunananthan S, Bergman H, Mark Clarfield A. The identification of frailty: a systematic literature review. J Am Geriatr Soc. 2011;59(11):2129–2138. | ||
Mulasso A, Roppolo M, Rabaglietti E. The role of individual characteristics and physical frailty on health related quality of life (HRQOL): a cross sectional study of Italian community-dwelling older adults. Arch Gerontol Geriatr. 2014;59(3):542–548. | ||
Cigolle CT, Ofstedal MB, Tian Z, Blaum CS. Comparing models of frailty: the health and retirement study. J Am Geriatr Soc. 2009;57(5):830–839. | ||
Woo J, Leung J, Morley JE. Comparison of frailty indicators based on clinical phenotype and the multiple deficit approach in predicting mortality and physical limitation. J Am Geriatr Soc. 2012;60(8):1478–1486. | ||
Blodgett J, Theou O, Kirkland S, Andreou P, Rockwood K. Frailty in NHANES: comparing the frailty index and phenotype. Arch Gerontol Geriatr. 2015;60(3):464–470. | ||
Li G, Thabane L, Ioannidis G, Kennedy C, Papaioannou A, Adachi JD. Comparison between frailty index of deficit accumulation and phenotypic model to predict risk of falls: data from the global longitudinal study of osteoporosis in women (GLOW) Hamilton cohort. PLoS One. 2015;10(3):e0120144. | ||
Rockwood K, Andrew M, Mitnitski A. A comparison of two approaches to measuring frailty in elderly people. J Gerontol A Biol Sci Med Sci. 2007;62(7):738–743. | ||
Malmstrom TK, Miller DK, Morley JE. A comparison of four frailty models. J Am Geriatr Soc. 2014;62(4):721–726. | ||
Metzelthin SF, Daniëls R, van Rossum E, de Witte L, van den Heuvel WJ, Kempen GI. The psychometric properties of three self-report screening instruments for identifying frail older people in the community. BMC Public Health. 2010;10:176. | ||
Hoogendijk EO, van der Horst HE, Deeg DJH, et al. The identification of frail older adults in primary care: comparing the accuracy of five simple instruments. Age Ageing. 2013;42(2):262–265. | ||
Jung H-W, Kim S-W, Ahn S, et al. Prevalence and outcomes of frailty in Korean elderly population: comparisons of a multidimensional frailty index with two phenotype models. PLoS One. 2014;9(2):e87958. | ||
Theou O, Brothers TD, Mitnitski A, Rockwood K. Operationalization of frailty using eight commonly used scales and comparison of their ability to predict all-cause mortality. J Am Geriatr Soc. 2013;61(9):1537–1551. | ||
Fried LP, Ferrucci L, Darer J, Williamson JD, Anderson G. Untangling the concepts of disability, frailty, and comorbidity: implications for improved targeting and care. J Gerontol A Biol Sci Med Sci. 2004;59(3):M255–M263. | ||
Engel GL. The need for a new medical model: a challenge for biomedicine. Science. 1977;196(4286):129–136. | ||
World Health Organization. Preamble to the constitution of the World Health Organization as adopted by the International Health Conference; 1948. Available from: http://www.who.int/about/definition/en/print.html. Accessed September 23, 2015. | ||
Gobbens RJ, van Assen MA, Luijkx KG, Wijnen-Sponselee MT, Schols JM. The Tilburg frailty indicator: psychometric properties. J Am Med Dir Assoc. 2010;11(5):344–355. | ||
Andreasen J, Sørensen EE, Gobbens RJJ, Lund H, Aadahl M. Danish version of the Tilburg frailty indicator – translation, cross-cultural adaption and validity pretest by cognitive interviewing. Arch Gerontol Geriatr. 2014;59(1):32–38. | ||
Coelho T, Santos R, Paúl C, Gobbens RJ, Fernandes L. Portuguese version of the Tilburg frailty indicator: transcultural adaptation and psychometric validation. Geriatr Gerontol Int. 2015;15(8):951–960. | ||
Uchmanowicz I, Gobbens R, Jankowska-Polanska B, Loboz-Rudnicka M, Manulik S, Loboz-Grudzien K. Cross-cultural adaptation and reliability testing of the Tilburg Frailty Indicator for optimizing care of Polish patients with frailty syndrome. Clin Interv Aging. 2014;9:997–1001. | ||
Freitag S, Schmidt S, Gobbens RJJ. Tilburg frailty indicator: German translation and psychometric testing. Z Für Gerontol Geriatr. Epub May 8, 2015. | ||
Santiago LM, Luz LL, Mattos IE, Gobbens RJJ, van Assen MALM. Psychometric properties of the Brazilian version of the Tilburg frailty indicator (TFI). Arch Gerontol Geriatr. 2013;57(1):39–45. | ||
American Psychological Association. Ethical principles of psychologists and code of conduct. Available from: http://www.apa.org/ethics/code/index.aspx. Accessed October 9, 2013. | ||
Avila-Funes JA, Amieva H, Barberger-Gateau P, et al. Cognitive impairment improves the predictive validity of the phenotype of frailty for adverse health outcomes: the three-city study. J Am Geriatr Soc. 2009;57(3):453–461. | ||
Roberts HC, Denison HJ, Martin HJ, et al. A review of the measurement of grip strength in clinical and epidemiological studies: towards a standardised approach. Age Ageing. 2011;40(4):423–429. | ||
Radloff LS. The CES-D scale: a self-report depression scale for research in the general population. Appl Psychol Meas. 1977;1(3):385–401. | ||
Podsiadlo D, Richardson S. The timed “Up & Go”: a test of basic functional mobility for frail elderly persons. J Am Geriatr Soc. 1991;39(2):142–148. | ||
Bohannon RW. Reference values for the timed up and go test: a descriptive meta-analysis. J Geriatr Phys Ther. 2006;29(2):64–68. | ||
Mannocci A, Di Thiene D, Del Cimmuto A, et al. International physical activity questionnaire: validation and assessment in an Italian sample. Ital J Public Health. 2012;7(4). | ||
Mulasso A, Roppolo M, Gobbens RJ, Rabaglietti E. La valutazione della fragilità nella popolazione anziana: traduzione e adattamento cross-culturale del Tilburg Frailty Indicator al contesto italiano. [The evaluation of frailty in older adults: translation and cross-cultural adaptation of the Tilburg Frailty Indicator to the Italian context]. G Ital Psicol. In Press 2015. | ||
Mulasso A, Roppolo M, Gobbens RJ, Rabaglietti E. The Italian version of the Tilburg frailty indicator: analysis of psychometric properties. Res Aging. [Epub ahead of print]. | ||
Kempen GI, Ormel J, Brilman EI, Relyveld J. Adaptive responses among Dutch elderly: the impact of eight chronic medical conditions on health-related quality of life. Am J Public Health. 1997;87(1):38–44. | ||
Suurmeijer TP, Doeglas DM, Moum T, et al. The Groningen activity restriction scale for measuring disability: its utility in international comparisons. Am J Public Health. 1994;84(8):1270–1273. | ||
Ormel J, Rijsdijk FV, Sullivan M, van Sonderen E, Kempen GIJM. Temporal and reciprocal relationship between IADL/ADL disability and depressive symptoms in late life. J Gerontol B Psychol Sci Soc Sci. 2002;57(4):P338–P347. | ||
Faber MJ, Bosscher RJ, Chin A, Paw MJ, van Wieringen PC. Effects of exercise programs on falls and mobility in frail and pre-frail older adults: a multicenter randomized controlled trial. Arch Phys Med Rehabil. 2006;87(7):885–896. | ||
Tak E, Staats P, Van Hespen A, Hopman-Rock M. The effects of an exercise program for older adults with osteoarthritis of the hip. J Rheumatol. 2005;32(6):1106–1113. | ||
Craig C, Marshall A, Sjöström M, et al. International physical activity questionnaire: 12-country reliability and validity. Med Sci Sports Exerc. 2003;35(8):1381–1395. | ||
Andresen EM, Malmgren JA, Carter WB, Patrick DL. Screening for depression in well older adults: evaluation of a short form of the CES-D (Center for Epidemiologic Studies Depression Scale). Am J Prev Med. 1994;10(2):77–84. | ||
De Jong Gierveld J, Van Tilburg T. Manual of the Loneliness Scale 1999. Update Version 1801 02. Amsterdam, Netherlands: VU University Amsterdam; 1999. | ||
De Jong-Gierveld J, Kamphuls F. The development of a Rasch-type loneliness scale. Appl Psychol Meas. 1985;9(3):289–299. |
 © 2015 The Author(s). This work is published and licensed by Dove Medical Press Limited. The
full terms of this license are available at https://www.dovepress.com/terms
and incorporate the Creative Commons Attribution
- Non Commercial (unported, 3.0) License.
By accessing the work you hereby accept the Terms. Non-commercial uses of the work are permitted
without any further permission from Dove Medical Press Limited, provided the work is properly
attributed. For permission for commercial use of this work, please see paragraphs 4.2 and 5 of our Terms.
© 2015 The Author(s). This work is published and licensed by Dove Medical Press Limited. The
full terms of this license are available at https://www.dovepress.com/terms
and incorporate the Creative Commons Attribution
- Non Commercial (unported, 3.0) License.
By accessing the work you hereby accept the Terms. Non-commercial uses of the work are permitted
without any further permission from Dove Medical Press Limited, provided the work is properly
attributed. For permission for commercial use of this work, please see paragraphs 4.2 and 5 of our Terms.