Back to Journals » Journal of Asthma and Allergy » Volume 19
A Comparative Study of Type 2 Inflammatory Biomarkers Combined with Small Airway Parameters for Diagnosing Cough-Variant Asthma
Authors Ondo Osie EMM ![]() , Bai H, Liu J, Wang Z, Zhang T, Wen S, Yu L, Xu X
, Bai H, Liu J, Wang Z, Zhang T, Wen S, Yu L, Xu X
Received 13 March 2026
Accepted for publication 14 May 2026
Published 25 May 2026 Volume 2026:19 609152
DOI https://doi.org/10.2147/JAA.S609152
Checked for plagiarism Yes
Review by Single anonymous peer review
Peer reviewer comments 2
Editor who approved publication: Dr Luis Garcia-Marcos
Eloina Margarita Mokuy Ondo Osie,1,* Haodong Bai,1,* Jianjun Liu,2,* Zihang Wang,3 Tongyangzi Zhang,1 Siwan Wen,1 Li Yu,1 Xianghuai Xu1
1Department of Pulmonary and Critical Care Medicine, Tongji Hospital, School of Medicine, Tongji University, Shanghai, People’s Republic of China; 2Department of Intensive Care Medicine, Shibei Hospital, Shanghai, People’s Republic of China; 3School of Medicine, Dalian Medical University, Dalian, People’s Republic of China
*These authors contributed equally to this work
Correspondence: Li Yu, Department of Pulmonary and Critical Care Medicine, Tongji Hospital, School of Medicine, Tongji University, Shanghai, People’s Republic of China, Email [email protected] Xianghuai Xu, Department of Pulmonary and Critical Care Medicine, Tongji Hospital, School of Medicine, Tongji University, Shanghai, People’s Republic of China, Email [email protected]
Background: The diagnosis of cough-variant asthma (CVA) traditionally relies on clinical manifestations and bronchial provocation test (BPT). However, the BPT can be costly and complex, and poses risks of severe bronchospasm. Most CVA patients exhibit type 2 airway inflammation and small airway dysfunction. Identifying practical biomarkers such as total immunoglobulin E (tIgE), percentage of eosinophil cell count in induced sputum (sEOS%), peripheral blood eosinophil count (PBEC), and fractional exhaled nitric oxide (FeNO) may enhance the diagnostic process for cough-variant asthma.
Objective: This study aims to evaluate and compare the diagnostic utility of T2 inflammatory biomarkers combined with small airway parameters for diagnosing CVA.
Methods: This was a single-center, cross-sectional diagnostic study including 211 patients with chronic cough. Participants underwent spirometry, FeNO measurement, and assessment of eosinophilic inflammation, including sEOS%, PBEC, and tIgE. Receiver operating characteristic (ROC) curve analysis was used to evaluate the diagnostic performance of individual parameters and combined models.
Results: CVA was diagnosed in 27.5% of patients. Compared with non-CVA patients, those with CVA showed significantly higher levels of T2 inflammatory biomarkers and reduced small airway function. Among individual biomarkers, FeNO demonstrated the highest diagnostic accuracy (AUC = 0.79), followed by sEOS% (AUC = 0.75), tIgE (AUC = 0.71), and PBEC (AUC = 0.66). Among small airway parameters, FEF50% showed the best performance (AUC = 0.79). Combined models significantly improved diagnostic accuracy, with FEF50% combined with FeNO or sEOS%, achieving the highest AUC (0.82). Correlation analysis revealed that higher inflammatory biomarker levels were associated with reduced small airway function.
Conclusion: The combination of T2 inflammatory biomarkers and small airway function parameters improves the diagnostic accuracy for CVA. This approach may provide a practical and non-invasive strategy for identifying CVA, particularly in settings where bronchial provocation testing is not readily available.
Keywords: chronic cough, cough-variant asthma, T2 inflammatory biomarkers, small airway
Introduction
Chronic cough (CC) in adults is defined as a cough lasting more than 8 weeks, with a global prevalence of approximately 10%.1 Cough variant asthma (CVA) is a phenotype of asthma where the primary or sole symptom is a chronic cough without the classic symptoms of wheezing, chest tightness, or dyspnea. CVA is a significant cause of chronic cough, accounting for approximately 25% to 42% of cases.2,3 Currently, the diagnosis of CVA relies on the bronchial provocation test, which is expensive, complicated, and risks inducing severe bronchial spasms. Therefore, a more convenient diagnostic method for CVA is needed.
Asthma is a chronic inflammatory disorder of the airways characterized by episodes of wheezing, chest tightness, shortness of breath, and coughing.4–6 Although several studies have shown that CVA shares pathophysiological features with classic asthma (CA), including airway inflammation and airway hyperresponsiveness (AHR), CVA has been recognized as a type 2 (T2) inflammation-driven disorder with eosinophilic inflammation being central to its pathogenesis.7,8
Biomarkers commonly used to assess airway inflammation in asthma include fractional exhaled nitric oxide (FeNO), sputum eosinophil count (sEOS%), peripheral blood eosinophil counts (PBEC), and serum total immunoglobulin E (tIgE). FeNO is a non-invasive surrogate marker of airway eosinophilic inflammation, and elevated FeNO levels predict a favorable response to inhaled corticosteroid (ICS) therapy.9,10 sEOS% is the gold standard for identifying eosinophilic airway inflammation and guiding corticosteroid therapy, especially in moderate-severe asthma. However, its use is limited by technical complexity and logistical challenges.11 PBEC and tIgE are most accessible and valuable for phenotyping and predicting eligibility for biologic therapies, though their predictive accuracy for corticosteroid response is lower than FeNO or sEOS%. Blood eosinophil counts ≥300 cells/μL and IgE ≥120 ng/mL are associated with poor asthma control, but these parameters are less specific and can be influenced by comorbid conditions.11,12
Recent studies have highlighted the increasing complexity and heterogeneity of CVA, emphasizing the need for more precise diagnostic approaches. A recent study has identified distinct clinical and molecular phenotypes of CVA, suggesting that airway inflammation and functional impairment may vary significantly among patients.13 In parallel, emerging research has explored novel biomarkers, including metabolomic signatures and transcriptomic profiles, to improve disease characterization; however, these approaches remain complex and are not readily applicable in routine clinical practice.14
Despite these advances, most existing studies have focused on either inflammatory biomarkers or airway function parameters in isolation. Therefore, there remains a need for practical, non-invasive, and clinically accessible strategies that integrate multiple dimensions of CVA pathophysiology. However, previous studies have typically focused on a limited number of biomarkers or single functional parameters. The present study expands on this by systematically evaluating a broader panel of T2 inflammatory biomarkers in combination with small airway function parameters to improve diagnostic accuracy for CVA.
Methods
Subjects
Chronic cough patients who attended the Department of Pulmonary and Critical Care Medicine of Tongji Hospital between November 2022 and October 2023 were enrolled. Their clinical data were collected and analyzed after pulmonary function test, bronchial provocation test, FeNO, tIgE, sEOS%, PBEC, and other examinations (see Figure 1). This study was conducted in accordance with the ethical principles of the Declaration of Helsinki and its later amendments. The procedure was approved by the Ethics Committee of Tongji Hospital (K-2022-028) and registered with the Chinese Clinical Trials Register (http://www.chictr.org.cn) number ChiCTR2300067906. Written informed consent was obtained from all patients.
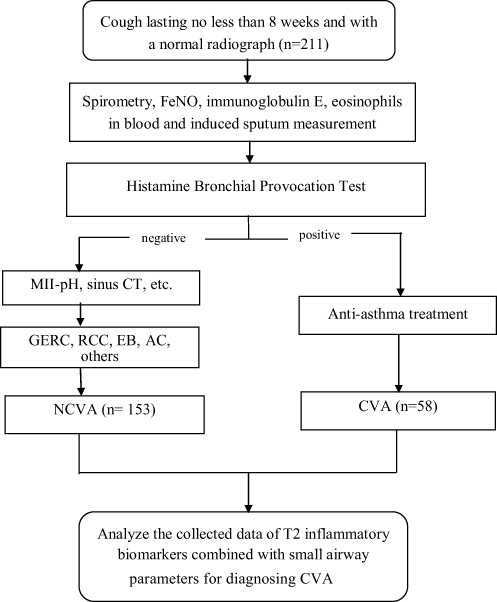 |
Figure 1 CONSORT (Consolidated Standards of Reporting Trials) flow diagram of the study. |
Patients who met all of the following criteria were eligible: (1) over 18 years old; (2) cough lasting no less than 8 weeks and with a normal chest radiograph; (3) forced expiratory volume in 1s (FEV1) / forced vital capacity (FVC) >70%, predicted FEV1 >80%.
Patients were excluded if they met one of the following criteria: (1) Current smokers or ex-smokers for ⩽2 years; (2) Pregnant or lactating patients; (3) A history of acute upper respiratory tract infection within 8 weeks; (4) Use of inhaled or oral corticosteroid within 4 weeks, or use of montelukast and long-acting β2-agonists in the previous week; (5) Patients with severe cardiac insufficiency, severe liver and kidney insufficiency, mental and cognitive dysfunction, hearing and communication impairment; (6) Multiple causes of chronic cough.
According to Chinese national guidelines on the diagnosis and management of cough (2021),15 the patient who met the following criteria was diagnosed with CVA: (1) chronic cough, often accompanied by a significant night cough; (2) Positive bronchial provocation test, or positive bronchial dilation test; (3) positive to antiasthma treatment.
FeNO Measurement
Using an Ncoulomb expiratory analyzer (Sunvou-CA2122, China), FeNO was measured following the American Thoracic Society/European Respiratory Society (ATS/ERS) guidelines and product operating instructions.16 Subjects were instructed to inhale NO-free air and exhale via a mouthpiece at a consistent rate (50 mL/s) for 10 seconds. FeNO levels were measured before spirometry and bronchial provocation tests.
Peripheral Blood Eosinophil Count
For the peripheral blood examination, 2–3 mL of venous blood was collected and analyzed by the laboratory department using an automated hematology analyzer.
Sputum Induction Measurement
After baseline Spirometry according to the ATS/ERS standard criteria,17 subjects were pretreated with inhaled salbutamol (400 μg by metered-dose inhaler) and 10 minutes later were asked to inhale a hypertonic saline (4.5%) solution during three periods of 7 min each at most using an ultrasonic nebulizer. Nebulization would be discontinued if one of the following symptoms occurred: wheezing, chest tightness, or moderate-to-severe dyspnea.
Detection of Total Serum Immunoglobulin E
Venous blood samples (2 mL) were collected from all participants and centrifuged at 3,500 rpm for 10 minutes at room temperature to obtain serum. tIgE levels were measured using a fully automated enzyme immunoassay system (AP22-speedy, China) in accordance with the manufacturer’s instructions.
Spirometric Measurement
Spirometric measurements were performed using the Master Screen Impulse Oscillometry System (IOS) (Jaeger, Hoechberg, Germany) in accordance with the American Thoracic Society/European Respiratory Society (ATS/ERS) guidelines.18
Histamine Bronchial Provocation Test
Histamine is indeed used as a provocative agent in bronchial provocation testing according to the criteria of the ATS, which was performed using the Jaeger APS Pro system with a Medic-Aid sidestream nebulizer. Task Force on the Standardization of Lung Function Testing.19 A 20% decrease in FEV1 was noted as a provocative dosage, and bronchial hyperresponsiveness (BHR) was considered present if the PD20-FEV1 ratio was less than 7.8 μmol.
Statistical Analysis
The data were analyzed using the statistical software SPSS 27, and MedCalc 23.1.3 was used for ROC curve analysis and the DeLong test. The correlation was tested with Spearman correlation test and was plotted through the “corrplot” R package using R software Version 4.4.3. The Kolmogorov–Smirnov normality test was used to determine the normality of the distributions of all continuous variables. Normally distributed variables were shown as mean ± standard deviation, whereas nonnormally distributed variables were represented by median (interquartile range). The T-test and Mann–Whitney U-tests were used to compare the differences between the CVA and NCVA groups. The receiver operating characteristic (ROC) curve and measuring the area under the curve (AUC) were used to analyze the diagnostic values of single indicators and combined indicators for CVA. The optimal cut-off point, P < 0.05, was considered statistically significant.
Results
Demographic Characteristics
A total of 211 chronic cough subjects with a single cause were included in this study. 58 (27.5%) subjects were eventually diagnosed with CVA. The Non-CVA (NCVA) group involved 153 patients: 43 (28.1%) patients with gastroesophageal reflux-related chronic cough (GERC), 38 (24.8%) patients with eosinophilic bronchitis (EB), 20 (13.07%) patients with refractory chronic cough (RCC), 16 (10.5%) patients with upper airway cough syndrome (UACS), 12 (7.8%) patients with atopic cough (AC) and 24 (15.3%) patients with other causes such as angiotensin-converting enzyme inhibitor (ACEI)-related cough, psychogenic cough, postinfectious cough, and so on. There were no significant differences in age, gender, Leicester cough questionnaire (LCQ) score, and cough symptom score between the two groups (Table 1).
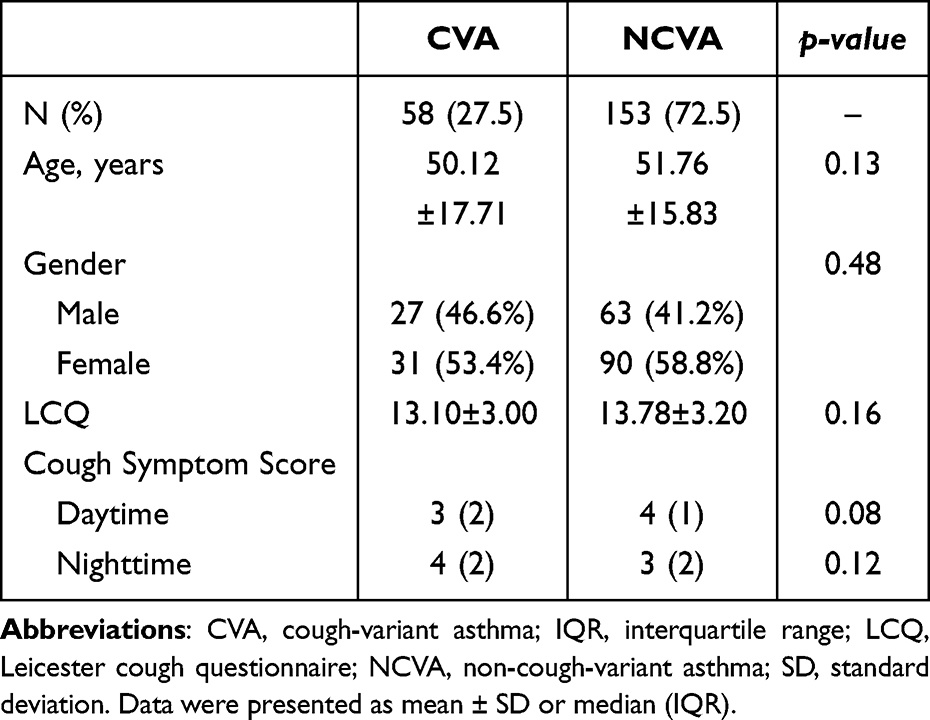 |
Table 1 Demographic Characteristics of CVA and NCVA Subjects |
Comparison of Pulmonary Function and T2 Inflammatory Biomarkers Between CVA and NCVA
Comparing pulmonary function and T2 inflammatory biomarkers between the two groups, CVA subjects have significantly lower FEV1, FEV1/FVC, FEF50%, FEF75%, and MMEF than NCVA subjects (all P< 0.01), indicating reduced small airway function. FeNO, sEOS%, tIgE, and PBEC were significantly higher in CVA subjects (all P<0.01) (Table 2).
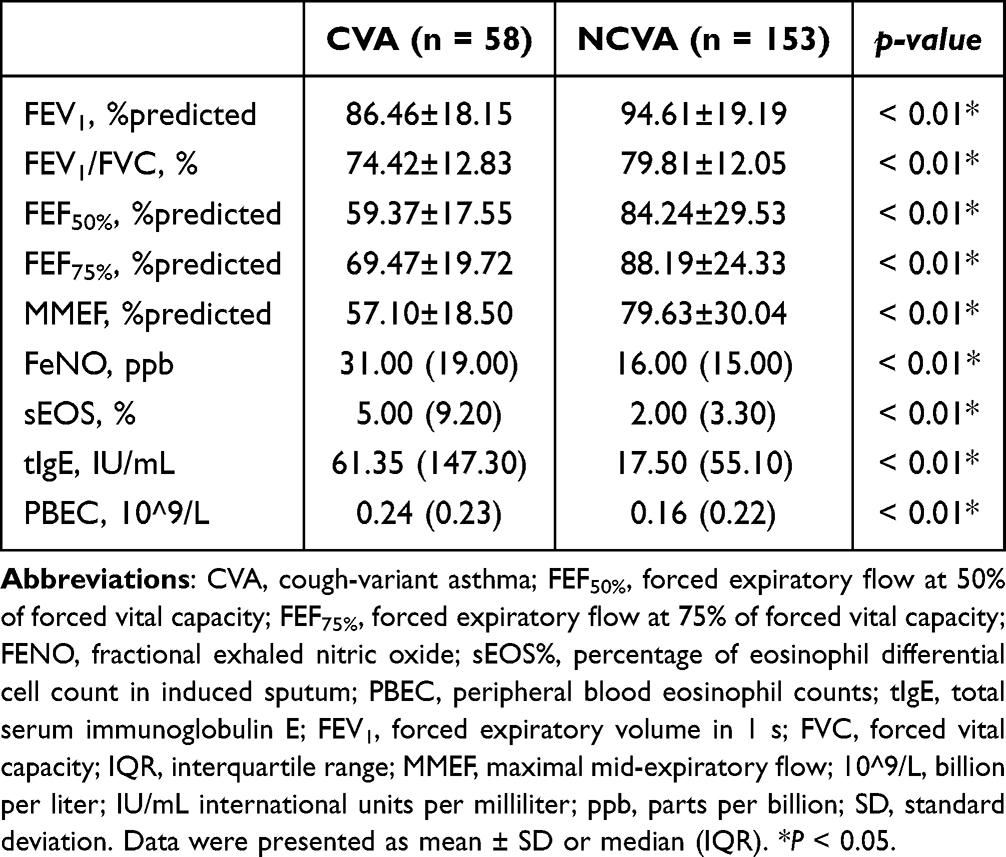 |
Table 2 Comparison of Pulmonary Function and T2 Inflammatory Biomarkers Between CVA and NCVA |
ROC Curves of Single Measurement for CVA
Significant differences in small airway function parameters and T2 inflammatory biomarkers were observed between CVA and NCVA subjects, suggesting that these could be potential indicators for diagnosing CVA in patients with chronic cough. The ROC curve was used to evaluate the diagnostic performance of these indicators, and the AUC was calculated to quantify their ability to identify CVA cases. FeNO and FEF50% exhibited the highest AUC values, indicating they are the most accurate indicators for identifying CVA. MMEF showed an AUC of 0.74, which was comparable to FEF75% (P= 0.07) but slightly lower than FEF50% (P < 0.05). There was no significant difference between the AUC of FeNO and sEOS% (P = 0.08). The AUC of tIgE and PBEC was significantly lower than that of FeNO (all P < 0.01), indicating limited diagnostic value (Table 3).
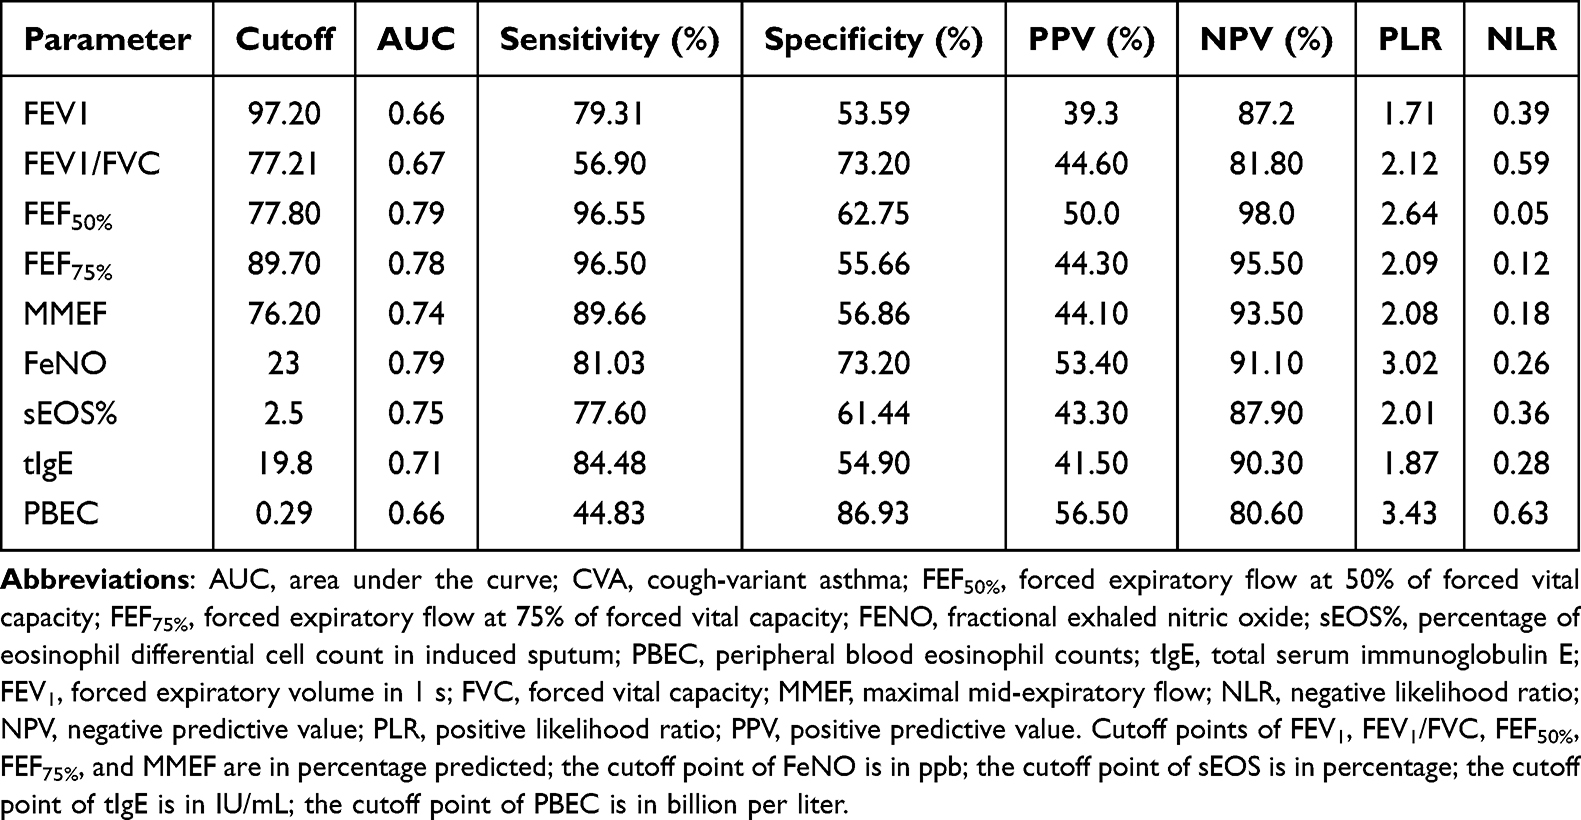 |
Table 3 Optimal Cutoff Values for Predicting CVA |
ROC Curves of T2 Inflammatory Biomarkers Combined with Small Airway Function Parameter (FEF50%) for Diagnosing CVA
According to the results in Table 3, we selected the small airway function parameter with the most accurate AUC to combine with T2 inflammatory biomarkers. The combining model was assessed using ROC curve analysis (Figure 2). Across all the models tested, the combination of FeNO or sEOS% with FEF50% showed higher AUC values compared to each marker assessed individually. In most comparisons, these improvements were statistically significant (Table 4).
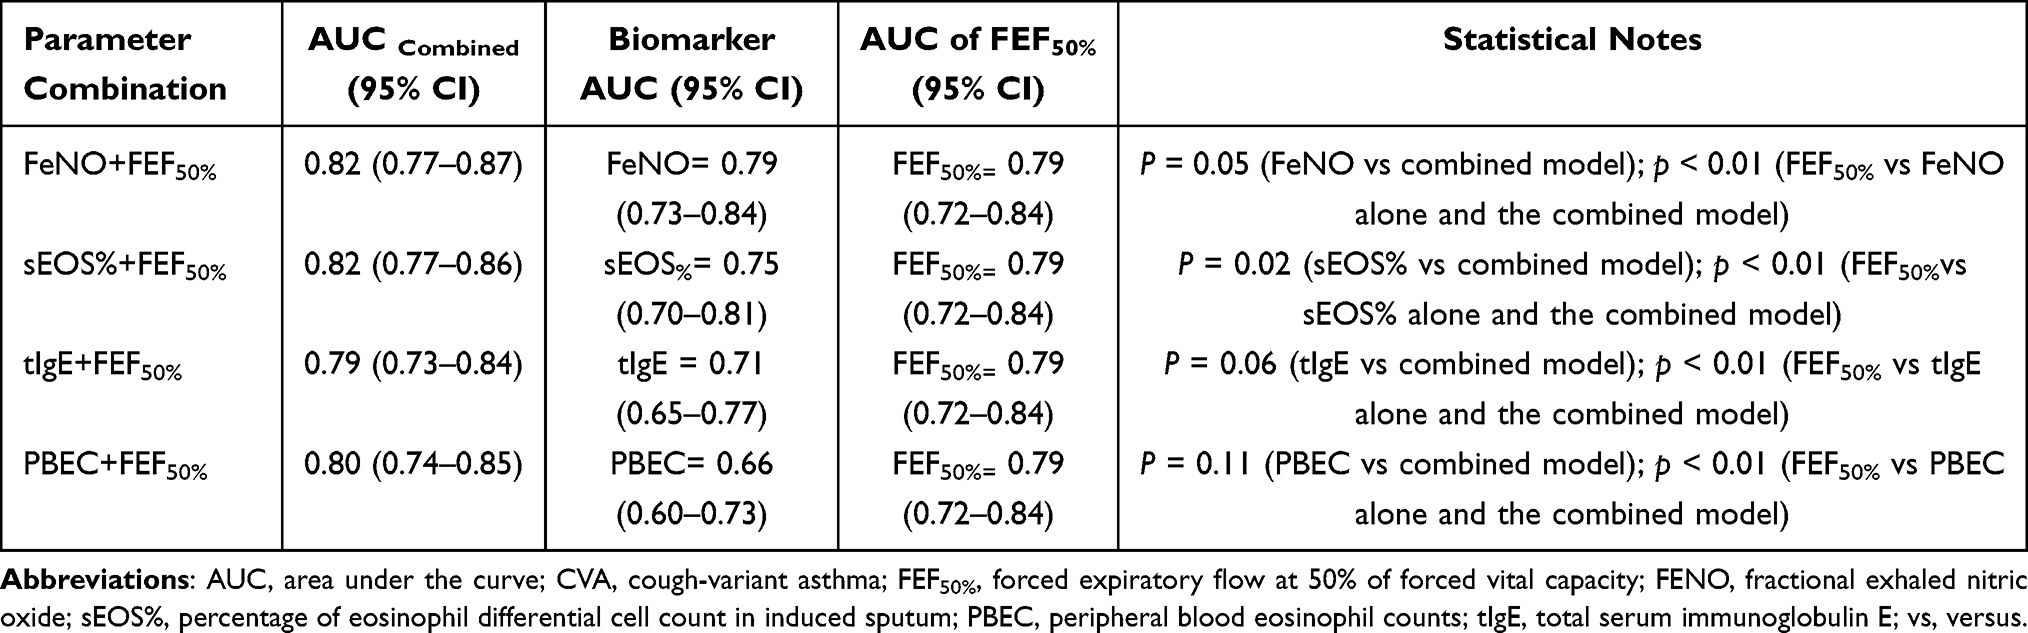 |
Table 4 Diagnosis Accuracy for Combined T2 Inflammatory Biomarkers and Small Airway Function in CVA |
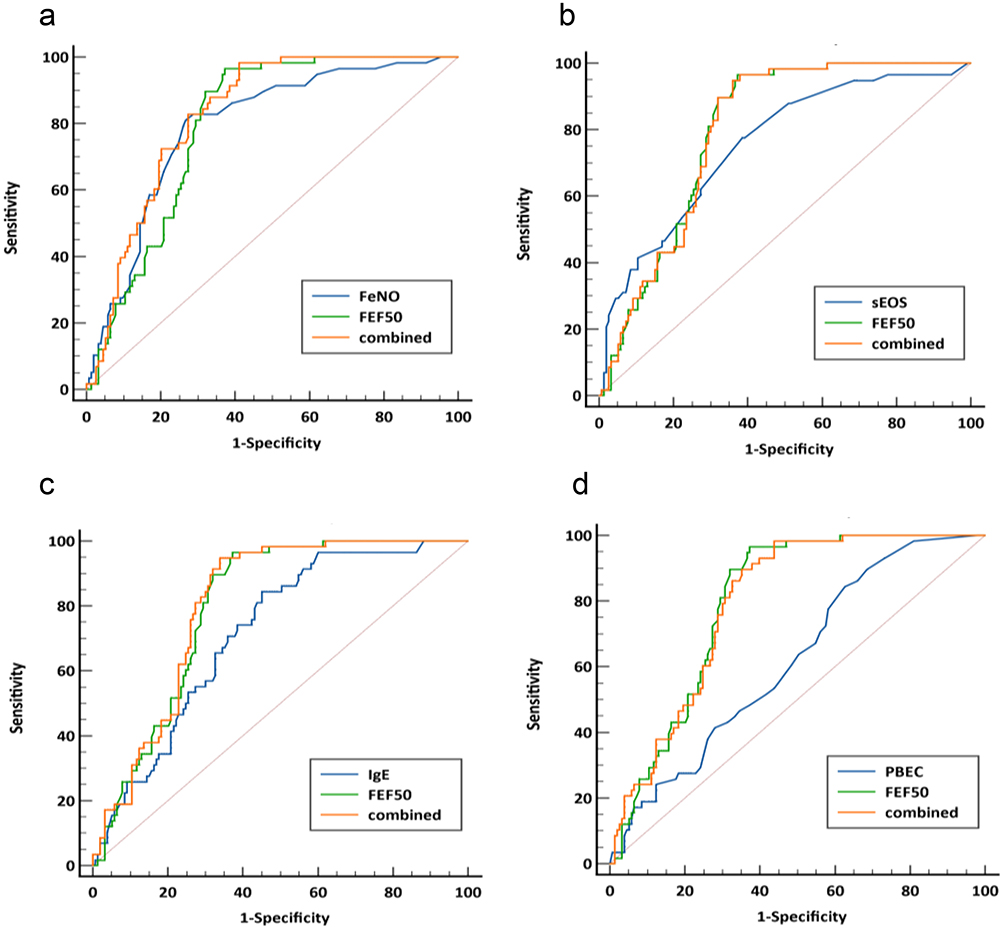 |
Figure 2 ROC curves of: (a) FeNO combined with FEF50%, (b) sEOS% combined with FEF50%, (c) tIgE combined with FEF50%, (d) PBEC combined with FEF50%, for diagnosing CVA. |
Correlation Between T2 Inflammatory Biomarkers and Small Airway Parameters in Chronic Cough Subjects with CVA
Correlation analysis (Figure 3) revealed strong positive associations among small airway function parameters. FEF50% showed a very strong correlation with MMEF (r = 0.905, p < 0.001) and a strong correlation with FEF75% (r = 0.767, p < 0.001). MMEF was also strongly correlated with FEF75% (r = 0.681, p < 0.001), confirming the consistency of these parameters in reflecting peripheral airway function. Among inflammatory biomarkers, sEOS% showed moderate negative correlations with MMEF (r = −0.356, p = 0.006), FEF50% (r = −0.386, p = 0.003), and FEF75% (r = −0.447, p < 0.001). Similarly, PBEC showed moderate negative correlations with MMEF (r = −0.417, p = 0.001), FEF50% (r = −0.421, p = 0.001), and FEF75% (r = −0.340, p = 0.009). FeNO was moderately negatively correlated with small airway parameters, including MMEF (r = −0.284, p = 0.031) and FEF50% (r = −0.295, p = 0.025), while its correlation with FEF75% did not reach statistical significance (r = −0.247, p = 0.061). tIgE showed no significant correlation with small airway function parameters, including MMEF (r = −0.057, p = 0.672), FEF50% (r = −0.120, p = 0.371), and FEF75% (r = −0.106, p = 0.430). Additionally, tIgE was not significantly correlated with FeNO (r = 0.042, p = 0.756) or PBEC (r = 0.077, p = 0.567). sEOS% was positively correlated with FeNO (r = 0.273, p = 0.038), whereas PBEC showed no significant association with FeNO (r = 0.064, p = 0.631).
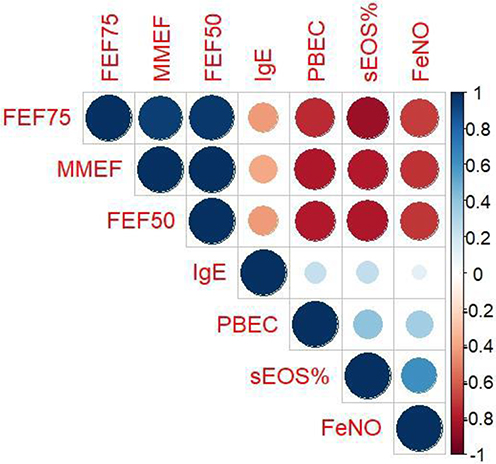 |
Figure 3 Correlations between T2 inflammatory biomarkers and small airway function for CVA. FEF50%, forced expiratory flow at 50% of forced vital capacity; FEF75%, forced expiratory flow at 75% of forced vital capacity; FENO, fractional exhaled nitric oxide; sEOS%, percentage of eosinophil differential cell count in induced sputum; PBEC, peripheral blood eosinophil counts; tIgE, total serum immunoglobulin E; MMEF, maximal mid-expiratory flow. The color scale represents Pearson correlation coefficients (r), ranging from −1 (strong negative correlation, red) to +1 (strong positive correlation, blue). Circle size and color intensity are proportional to the strength of the correlation. |
Discussion
CVA is a phenotype of asthma in which the primary, and often sole, symptom is chronic cough. CVA is one of the leading causes of chronic cough cases. More than 30% to 40% of adults with CVA who do not receive appropriate treatment may progress to CA. Our study explores the diagnostic potential of combining T2 inflammatory biomarkers with small airways function parameters, enhancing their ability to identify CVA.
In this study, CVA was identified in 27.5% of all patients with chronic cough. Comparing pulmonary function and T2 inflammatory biomarkers between the CVA and NCVA groups, we observed that CVA subjects exhibited significantly reduced pulmonary function, whereas T2 inflammatory biomarkers were notably higher.
Although CVA is often associated with normal baseline spirometry, subtle small airway dysfunction may already be present. These changes may not affect FEV1 or FEV1/FVC but can be detected using more sensitive parameters such as FEF50%, FEF75%, and MMEF. Our findings suggest that CVA is associated with early small airway impairment, consistent with a continuum toward classic asthma.
T2 inflammatory biomarkers are key clinical indicators for identifying T2 asthma and airway inflammation.12,20,21 FeNO is primarily produced in the bronchial epithelium by the enzyme inducible nitric oxide synthase (iNOS), which is upregulated in response to T2 inflammatory cytokines such as IL-4 and IL-13. Elevated FeNO levels are indicative of increased type 2 inflammation.22,23 Measuring FeNO at a flow rate of 50 mL/s (FeNO50) is indeed a well-established method for assessing central airway inflammation.10,24 Furthermore, the study by Lehtimäki et al highlights that FeNO50 is sensitive to changes in the NO dynamics in the central airways, making it a useful tool for differentiating between central and peripheral inflammation.10 Eosinophilic inflammation is a hallmark of asthma, particularly in the context of T2 immune responses. Elevated levels of eosinophils in serum and sputum further support the presence of eosinophilic inflammation in CVA.25,26 Sputum eosinophilia in CVA is not only indicative of ongoing airway inflammation but also serves as a predictor for the potential progression to CA. PBEC, while less specific than sEOS%, also reflect systemic eosinophilic activity and correlate with disease severity in asthma, including CVA.25 IgE is indeed a key mediator of T1 hypersensitivity reactions, which are central to the pathogenesis of allergic asthma.27,28 Sunyer et al reported that total serum IgE levels were associated with asthma independently of specific IgE levels to common aeroallergens.29
Consistent with previous studies, FeNO showed the best diagnostic accuracy among individual biomarkers with an AUC of 0.79. Compared with sEOS% (AUC of 0.75), PBEC (AUC of 0.66), and tIgE (AUC of 0.71). sEOS% appears to be a more consistent marker of eosinophilic airway inflammation in CVA than PBEC. tIgE reflects allergic sensitization but has moderate specificity, as it may also be elevated in other allergic conditions.
In clinical practice, MMEF, FEF50%, and FEF75% are key spirometric parameters for evaluating small airway function.28–30 Among small airway function parameters, FEF50% showed the highest diagnostic performance (AUC=0.79) and lower variability compared with MMEF and FEF75%. This suggests that FEF50% better captures early airflow limitation in the mid-small airways, where obstruction typically begins in CVA. In addition, FEF50% is less affected by measurement variability, airway closure, and technical noise than MMEF or FEF75%, making it more stable for clinical application.31 Based on these results, FEF50% was selected for inclusion in the combined diagnostic model.
The combined model consistently demonstrated superior diagnostic performance, as reflected by higher AUC values ranging from 0.79 to 0.82 compared to individual predictors. Combining FEF50% with FeNO or sEOS% provided the most accurate diagnosis of CVA, achieving an optimal AUC of 0.82, and substantially improving diagnosis accuracy over any single parameter. These findings are consistent with and extend our previous work, in which we demonstrated the diagnostic value of combining lower airway FeNO with small airway function parameters for CVA diagnosis.32 The present study further strengthens the evidence by incorporating a broader panel of T2 inflammatory biomarkers, including tIgE, sEOS% and PBEC, and by systematically evaluating their combined diagnostic performance. Despite the high diagnostic performance of sEOS% in combination with FEF50%, its clinical applicability is limited due to variability in measurements. sEOS% levels can fluctuate depending on the timing and method of sample collection. In contrast, FeNO has been validated in multiple studies as a reliable and reproducible biomarker for T2 airway inflammation.33
The present study further explored the correlation between T2 inflammatory biomarkers and decreased small airway function. A strong positive correlation was observed among FEF75%, MMEF, and FEF50%, confirming their collective utility in assessing peripheral airflow. Similarly, PBEC and sEOS% demonstrated a very strong positive correlation, indicating that they may be used interchangeably as measures of systemic eosinophilic burden. In contrast, FeNO, PBEC, and sEOS% showed a strong negative correlation with small airway parameters, suggesting that higher levels of these biomarkers are associated with poorer lung function. Additionally, a moderate association has been found between tIgE and reduced lung function.
This study has certain limitations. First, the cough assessment relied on questionnaires prone to recall bias. Measures such as cough frequency monitoring or cough reflex sensitivity testing were not included, potentially missing nuanced insights into cough severity. Second, the success rate for obtaining adequate sputum samples was not explicitly stated, but sputum induction is known to have variable success. This could introduce selection bias and underrepresent patients unable to produce sputum, affecting the accuracy of airway inflammation assessments. Third, factors such as allergen sensitization or comorbidities were not systematically controlled, potentially influencing biomarker levels or lung function parameters.
Future studies incorporating standardized objective cough assessments, improved sputum sampling reporting, and comprehensive clinical phenotyping may help refine diagnostic models for CVA.
Conclusion
In conclusion, this study suggests that T2 inflammatory biomarkers, particularly FeNO and sEOS%, as well as small airway function parameters, provide moderate diagnostic accuracy for CVA when assessed individually. Furthermore, the diagnostic performance was significantly enhanced when FeNO or sEOS% was combined with FEF50%. FeNO has been validated in multiple studies as a reliable and reproducible biomarker, supporting its potential clinical utility. However, the clinical applicability of sputum eosinophils remains limited due to technical complexity and variability in sample processing.
These findings may support earlier clinical assessment and a more individualized approach to CVA management. Nevertheless, given the single-center design, further validation in larger, multicenter studies is required before broad clinical implementation.
Data Sharing Statement
The datasets used and/or analyzed during the current study are available from the corresponding author, Xianghuai Xu, upon reasonable request.
Author Contributions
All authors made a significant contribution to the work reported, whether that is in the conception, study design, execution, acquisition of data, analysis and interpretation, or in all these areas; took part in drafting, revising or critically reviewing the article; gave final approval of the version to be published; have agreed on the journal to which the article has been submitted; and agree to be accountable for all aspects of the work.
Funding
The authors disclosed receipt of the following financial support for the research, authorship, and/or publication of this article: This study was supported by the National Natural Science Foundation of China (No. 82270114 and 82570146), the Seed Program for Research and Transformation of Medical New Technologies of the Shanghai Municipal Health Commission (2025ZZ1028), the Key Supported Discipline of Health System in Shanghai (2023ZDFC0302), Shanghai Leading Talent Program of Eastern Talent Plan (leading talent program)(BJWS2025069), the Program of Shanghai Municipal Health Commission Clinical Research (No. 20234Y0190, 20244Y0147 and 20254Y0012), Medical Research Project of China Medical and Health Development Foundation (BJ2024JCHX002).
Disclosure
Eloina Margarita Mokuy Ondo Osie, Haodong Bai, and Jianjun Liu are co-first authors for this study. The authors declare that there is no conflict of interest in this work.
References
1. Peters AT, Altman KW, Dicpinigaitis P, Drake MG, Satia I, Patel GB. Therapeutic and mechanistic advances in chronic cough. Ann Allergy Asthma Immunol. 2025;134;(6):639–11. doi:10.1016/j.anai.2024.12.021
2. Corrao WM. Pearls and pitfalls in the diagnosis of cough variant asthma. Allergy Asthma Proc. 2018;39(6):466–467. doi:10.2500/aap.2018.39.4168
3. Cox JK, Lockey R, Cardet JC. Cough-variant asthma: a review of clinical characteristics, diagnosis, and pathophysiology. J Allergy Clin Immunol Pract. 2025;13:490–498. doi:10.1016/j.jaip.2024.11.005
4. Padem N, Saltoun C. Classification of asthma. Allergy Asthma Proc. 2019;40(6):385–388. doi:10.2500/aap.2019.40.4253
5. Fireman P. Understanding asthma pathophysiology. Allergy Asthma Proc. 2003;24(2):79–83.
6. Koterba AP, Saltoun CA. Asthma classification. Allergy Asthma Proc. 2012;33(suppl 1):28–31. doi:10.2500/aap.2012.33.3539
7. Niimi A. Cough and asthma. Curr Respir Med Rev. 2011;7(1):47–54. doi:10.2174/157339811794109327
8. Niimi A. Narrative review: how long should patients with cough variant asthma or nonasthmatic eosinophilic bronchitis be treated? J Thorac Dis. 2021;13(5):3197–3214. doi:10.21037/jtd-20-2026
9. Paredi P, Kharitonov SA, Meah S, Barnes PJ, Usmani OS. A novel approach to partition central and peripheral airway nitric oxide. Chest. 2014;145(1):113–119. doi:10.1378/chest.13-0843
10. Lehtimäki L, Karvonen T, Högman M. Clinical values of nitric oxide parameters from the respiratory system. Curr Med Chem. 2020;27(42):7189–7199. doi:10.2174/0929867327666200603141847
11. Reddel HK, Bateman ED, FitzGerald JM, et al. Global strategy for asthma management and prevention: 2025 update. Global Initiative for Asthma. 2025. https://ginasthma.org
12. Woo SD, Park HS, Jang JH, et al. Biomarkers for predicting type 2-high and uncontrolled asthma in real-world practice. Ann Allergy Asthma Immunol. 2023;131(2):209–216.e2. doi:10.1016/j.anai.2023.05.011
13. Zhan W, Zhang W, Zhang Y, et al. Identification of cough-variant asthma phenotypes based on clinical and pathophysiologic data. J Allergy Clin Immunol. 2023;152(3):622–632. doi:10.1016/j.jaci.2023.04.017
14. Chen Z, Jin K, Huang K, et al. Sputum metabolomic signature and dynamic change of cough variant asthma. Am J Respir Cell Mol Biol. 2025;72(3):285–296. doi:10.1165/rcmb.2024-0219OC
15. Asthma Group of Chinese Thoracic Society. Chinese national guideline on diagnosis and management of cough (2021). Zhonghua Jie He He Hu Xi Za Zhi. 2022;45(1):13–46. doi:10.3760/cma.j.cn112147-20211101-00759.
16. American Thoracic Society; European Respiratory Society. ATS/ERS recommendations for standardized procedures for the measurement of exhaled lower respiratory nitric oxide and nasal nitric oxide. Am J Respir Crit Care Med. 2005;171(8):912–930. doi:10.1164/rccm.200406-710ST.
17. Miller MR, Hankinson J, Brusasco V, et al. Standardisation of spirometry. Eur Respir J. 2005;26(2):319–338. doi:10.1183/09031936.05.00034805
18. King GG, Bates J, Berger KI, et al. Technical standards for respiratory oscillometry. Eur Respir J. 2020;55(2):1900753. doi:10.1183/13993003.00753-2019
19. Coates AL, Wanger J, Cockcroft DW, et al. ERS technical standard on bronchial challenge testing: general considerations and performance of methacholine challenge tests. Eur Respir J. 2017;49(5):1601526. doi:10.1183/13993003.01526-2016
20. Zhu H, Zhang R, Hao C, et al. Fractional exhaled nitric oxide combined with pulmonary function parameters for the diagnosis of cough variant asthma in children. Med Sci Monit. 2019;25:3832–3838. doi:10.12659/MSM.913761
21. Chen FJ, Hu XY, Liu GP, et al. Validity of fractional exhaled nitric oxide and small airway function indices in diagnosis of cough-variant asthma. J Asthma. 2018;55(7):750–755. doi:10.1080/02770903.2017.1366509
22. Escamilla-Gil JM, Fernandez-Nieto M, Acevedo N. Understanding the cellular sources of fractional exhaled nitric oxide and its role as a biomarker of type 2 inflammation in asthma. Biomed Res Int. 2022;2022:5753524. doi:10.1155/2022/5753524
23. Rupani H, Kent BD. Using fractional exhaled nitric oxide measurement in clinical asthma management. Chest. 2022;161(4):906–917. doi:10.1016/j.chest.2021.10.015
24. Barnes PJ, Dweik RA, Gelb AF, et al. Exhaled nitric oxide in pulmonary diseases: a comprehensive review. Chest. 2010;138(3):682–692. doi:10.1378/chest.09-2090
25. Pizzichini E, Pizzichini MM, Efthimiadis A, Dolovich J, Hargreave FE. Measuring airway inflammation in asthma: eosinophils and eosinophilic cationic protein in induced sputum compared with peripheral blood. J Allergy Clin Immunol. 1997;99(4):539–544. doi:10.1016/S0091-6749(97)70082-4
26. Niimi A, Amitani R, Suzuki K, Tanaka E, Murayama T, Kuze F. Eosinophilic inflammation in cough variant asthma. Eur Respir J. 1998;11(5):1064–1069. doi:10.1183/09031936.98.11051064
27. Wu LC. Immunoglobulin E receptor signaling and asthma. J Biol Chem. 2011;286(38):32891–32897. doi:10.1074/jbc.R110.205104
28. Platts-Mills TAE. The role of immunoglobulin E in allergy and asthma. Am J Respir Crit Care Med. 2001;164(8 suppl):S1–S5. doi:10.1164/ajrccm.164.supplement_1.2103024
29. Sunyer J, Antó JM, Castellsagué J, Soriano JB, Roca J. Total serum IgE is associated with asthma independently of specific IgE levels. Eur Respir J. 1996;9(9):1880–1884. doi:10.1183/09031936.96.09091880
30. Qin R, An J, Xie J, et al. FEF25-75% is a more sensitive measure reflecting airway dysfunction in patients with asthma. J Allergy Clin Immunol Pract. 2021;9(10):3649–3659.e6. doi:10.1016/j.jaip.2021.06.027
31. Yuan H, Liu X, Li L, et al. Clinical and pulmonary function changes in cough variant asthma with small airway disease. Allergy Asthma Clin Immunol. 2019;15:41. doi:10.1186/s13223-019-0354-1
32. Bai H, Shi C, Yu S, et al. A comparative study on the value of lower airway exhaled nitric oxide combined with small airway parameters for diagnosing cough-variant asthma. Ther Adv Respir Dis. 2023;17:17534666231181259. doi:10.1177/17534666231181259
33. Dweik RA, Boggs PB, Erzurum SC, et al. An official ATS clinical practice guideline: interpretation of exhaled nitric oxide levels for clinical applications. Am J Respir Crit Care Med. 2011;184(5):602–615. doi:10.1164/rccm.9120-11ST
 © 2026 The Author(s). This work is published and licensed by Dove Medical Press Limited. The
full terms of this license are available at https://www.dovepress.com/terms
and incorporate the Creative Commons Attribution
- Non Commercial (unported, 4.0) License.
By accessing the work you hereby accept the Terms. Non-commercial uses of the work are permitted
without any further permission from Dove Medical Press Limited, provided the work is properly
attributed. For permission for commercial use of this work, please see paragraphs 4.2 and 5 of our Terms.
© 2026 The Author(s). This work is published and licensed by Dove Medical Press Limited. The
full terms of this license are available at https://www.dovepress.com/terms
and incorporate the Creative Commons Attribution
- Non Commercial (unported, 4.0) License.
By accessing the work you hereby accept the Terms. Non-commercial uses of the work are permitted
without any further permission from Dove Medical Press Limited, provided the work is properly
attributed. For permission for commercial use of this work, please see paragraphs 4.2 and 5 of our Terms.