Back to Archived Journals » Journal of Neurorestoratology » Volume 4
A combination of functional magnetic resonance imaging and diffusion tensor image to explore structure–function relationship in healthy and myelopathic spinal cord
Authors Cui JL, Li G, Mak KC, Luk KD ![]() , Hu Y
, Hu Y
Received 5 July 2016
Accepted for publication 1 August 2016
Published 6 October 2016 Volume 2016:4 Pages 69—78
DOI https://doi.org/10.2147/JN.S116450
Checked for plagiarism Yes
Review by Single anonymous peer review
Peer reviewer comments 3
Editor who approved publication: Prof. Dr. Hari Shanker Sharma
Jiao-Long Cui,1 Guangsheng Li,2 Kin-Cheung Mak,1,3 Keith Dip-Kei Luk,1 Yong Hu1-3
1Department of Orthopaedics and Traumatology, The University of Hong Kong, Hong Kong, People’s Republic of China; 2Department of Orthopaedics, Spinal Division, Affiliated Hospital of Guangdong Medical University, Guangdong, 3Shenzhen Key Laboratory for Innovative Technology in Orthopaedic Trauma, The University of Hong Kong-Shenzhen Hospital, Shenzhen, People’s Republic of China
Background: Cervical spondylotic myelopathy (CSM) is a degenerative disorder that can chronically damage the spinal cord. The aim of this study was to investigate the column-specific degeneration in the cervical cord with CSM and explore the structure–function relationship by diffusion tensor imaging (DTI) and functional magnetic resonance imaging (fMRI).
Patients and methods: DTI and blood-oxygen-level-dependent (BOLD) fMRI were obtained from 14 healthy controls and six patients with CSM at 3 T. The fractional anisotropy (FA) value of anterior, lateral, and posterior column and the BOLD signal in response to somatosensory stimulation were compared among three groups: the average value of levels from C3 to C8 in the control and CSM groups and the value at maximal compression site in the CSM (CSM-mc) group. The correlation between FA value and BOLD signal was used to assess the structure–function relationship.
Results: The FA value in CSM-mc was lower than control-ave in all the columns (P<0.01) and lower than CSM-ave in the lateral and posterior column (P<0.05). The BOLD signal in CSM was significantly higher than that in the control (P<0.001). In the posterior column, a significant correlation between BOLD signal and FA value was found (P<0.05).
Conclusion: This study demonstrated that the microstructural damage in CSM was correlated with functional changes. DTI combined with fMRI reveals the relationship between structural damage and neural activity, which might provide a promising method to reveal the underlying pathomechanism of CSM.
Keywords: spinal cord, fMRI, blood oxygen level dependent, diffusion tensor imaging, cervical spondylotic myelopathy
Introduction
Cervical spondylotic myelopathy (CSM) is a common disease of the spine in the elderly due to degenerative bony changes resulting in compression of the spinal cord.1 Currently, magnetic resonance imaging (MRI) plays an important role in the diagnosis of CSM. The conventional MRI, such as T1- and T2-weighted imaging, has provided great benefits in terms of rapid, noninvasive, and accurate imaging of cord morphology2 and of bony and soft tissues of the spine. Transverse cord area and compression ratio are used as the signs of spinal cord atrophy and spondylotic or discogenic compression. Recently, there has been growing interest in the application of diffusion tensor imaging (DTI) to investigate the spinal cord parenchyma in patients with CSM.3–6 DTI is used to detect the tissue water molecular diffusion at microscopic dimensions.7 Fractional anisotropy (FA), axial diffusivity (AD), and radial diffusivity (RD), which are derived from the eigenvalues of the diffusion tensor matrix, are commonly used in DTI analysis to describe the diffusion properties of the voxels.8 As anisotropy diffusivity is attributed to the myelin and axonal integrity in nerve tracts, changes in these measures could reflect the microstructural changes associated with the myelin loss and axonal damage in neurological injury and disease.9–11
Functional MRI (fMRI) with blood oxygen level dependent (BOLD) is playing a primary role in neuroscience study. A number of studies with spinal cord BOLD fMRI have explored neuronal activation induced by motor tasks12–16 or sensory stimuli17–20 in healthy as well as injured spinal cord.21 Some studies combining BOLD fMRI and diffusion tensor MRI were conducted in the brain to detect the relationship between functional activation and structural integrity.22–25 An analogous approach in the spinal cord may provide a deeper understanding of the pathophysiology of CSM. In particular, the mismatch between the degrees of compression in chronic myelopathy is not well correlated with functional status and clinical symptoms. Hence, in this study, we aimed to explore the quantitative relationship of structure and function in healthy and myelopathic cervical spinal cord by combining the anatomical, functional, and diffusion tensor MRI technique.
Patients and methods
Subjects
A total of 14 healthy volunteers (seven males and seven females, age =56±13 years (mean ± SD) and six patients with CSM (two males and four females: age =67±14 years) were recruited for this study with written informed consent. All volunteers were screened to confirm their eligibility. The inclusion criteria of healthy subjects were intact sensory and motor function evaluated by the Japanese Orthopaedic Association score system26 and negative Hoffman’s sign under physical examination. The exclusion criteria were having any neurological signs and symptoms or past history of neurological injury, diseases, and surgeries. The experienced spine surgeons made the clinical diagnosis of CSM based on the patients’ history, symptoms, and signs together with radiological findings. Clinical and radiological information are summarized in Table 1. The Institutional Review Board of the University of Hong Kong/Hospital Authority Hong Kong West Cluster approved all the experimental procedures in this study.
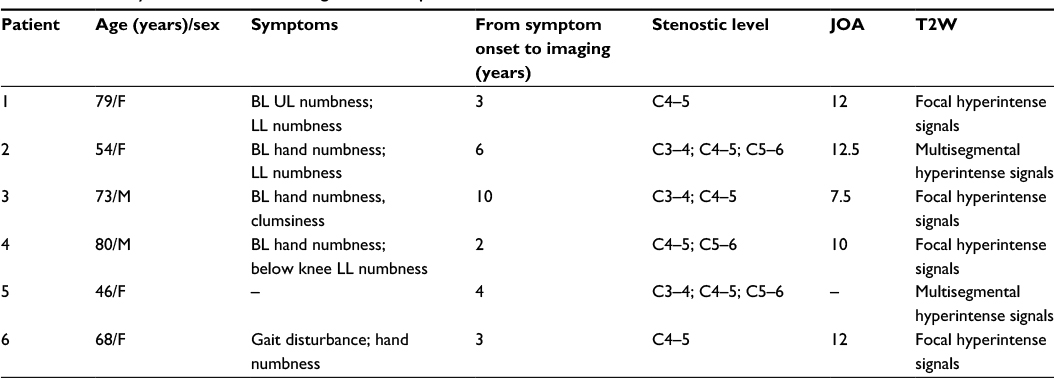 | Table 1 Summary of clinical and radiological data of patients with CSM Abbreviations: BL, bilateral; CSM, cervical spondylotic myelopathy; F, female; JOA, Japanese Orthopaedic Association; LL, lower limbs; M, male; T2W, T2 weighted; UL, upper limbs. |
Somatosensory stimuli for fMRI
Square-wave electrical stimuli were applied to the median nerve at wrists with a wavelength of 0.2 ms at a frequency of 0.4 Hz. The stimulation current (5–15 mA) was adjusted to induce the somatosensory stimuli. Subjects were instructed to relax their muscles and focus their attention on the stimulation throughout the fMRI acquisition. Electrical stimuli were delivered in 20-second blocks that alternated with 20-second blocks of rest. Five stimulation blocks were applied on the left hand, right hand, and bilateral hands in a pseudorandom order. The initial and final rest blocks were prolonged to 30 seconds. Thus, the whole run lasted 640 seconds, during which 256 volumes were acquired.
Scanning
Magnetic resonance imaging were acquired using 3.0 T MRI scanner (Philips Achieva, Best, the Netherlands). During the acquisition process, the subject was placed supine with the head and neck coil enclosing the cervical region and scanned with anatomical T1-weighted (T1W), T2-weighted (T2W), diffusion tensor, and BOLD images.
Sagittal and axial T1W and T2W images were acquired using fast spin echo sequence. For sagittal imaging, the imaging parameters were as follows: field of view (FOV) =250 mm ×250 mm, slice thickness =3 mm, slice gap =0.3 mm, fold-over direction = feet/head, number of excitation (NEX) =2, voxel size =0.49×0.49×3.0 mm3, and time of echo (TE)/time of repetition (TR) =7.2/530 ms (T1W) and 120/3,314 ms (T2W). A total of eleven sagittal images covering the whole cervical spinal cord were acquired. For axial imaging, the imaging parameters were as follows: FOV =80 mm ×80 mm, slice thickness =7 mm, slice gap =2.2 mm, fold-over direction = αnterior/posterior (AP), NEX =3, voxel size =0.56×0.56×7.0 mm3 (T1W) and 0.63×0.63×7.0 mm3 (T2W), and TE/TR =8/1,000 ms (T1W) and 120/4,000 ms (T2W). A total of 12 transverse images covering the cervical spinal cord from C1 to C7, each of which was placed at the center of either vertebra or intervertebral disk, were acquired.
DTI was acquired using sequence and parameters that were in line with the earlier study:27,28 single-shot spin-echo echo-planar imaging (EPI). Diffusion encoding was in 15 noncollinear and noncoplanar diffusion directions with b-value = 600 seconds/mm2. The imaging parameters were as follows: FOV = 80 mm × 80 mm, slice thickness = 7 mm, fold-over direction = AP, NEX =3, voxel size = 0.63×0.63×7.0 mm3, TE/TR = 60 ms per five heartbeats. Cardiac vectorcardiogram triggering was applied to minimize the pulsation artifact from cerebrospinal fluid.29 The image slice planning was the same as the anatomical axial T1W and T2W images, with 12 slices covering the cervical spinal cord from C1 to C7. The mean duration of DTI was 24 minutes per subject with an average heart rate of 60 beats/min.
BOLD functional MR (fMR) imaging were acquired with a single-shot gradient-echo EPI sequence. A total of 15, 5 mm-thick, contiguous para-axial slices were acquired covering C3–C8 vertebral levels (Figure 1A), in orienting approximately to the longitudinal axis of the spinal cord (Figure 1B). The imaging parameters were as follows: FOV =80 mm ×80 mm; rectangular FOV =45%; scan percentage =80%; voxel size =1×1×5 mm3; phase-encoding direction = AP; flip angle =45°; TR =2.5 seconds; TE =15 ms; EPI factor =29; NEX =3. Signal changes in BOLD intensity was showed in Figure 1C.
 | Figure 1 (A) Slice prescription by sagittal view of anatomical image. fMRI analysis was conducted on the data from 15 consecutive, 5 mm-thick axial slices oriented perpendicularly to the longitudinal axis of the spinal cord. (B) Representative maps from one healthy subject and one patient with CSM, showing the spatial location of activated voxels in response to bilateral stimulation. (C) Signal changes (mean ± SD) related to stimulation applied to LH, RH, and BH. Asterisks indicate significant differences (*P<0.05; **P<0.01). Abbreviations: BH, bilateral hand; CSM, cervical spondylotic myelopathy; fMRI, functional magnetic resonance imaging; LH, left hand; RH, right hand. |
Image analysis
The spinal cord morphometry was analyzed using previously reported methods,30 including the measurement of cross-sectional area and compression ratio of the spinal cord based on axial T2W images (Figure 2A and B). The compression ratio was calculated by dividing the smallest anteroposterior diameter of the cervical cord in anterior to posterior (AP) by the broadest transverse diameter (W) as AP/W.
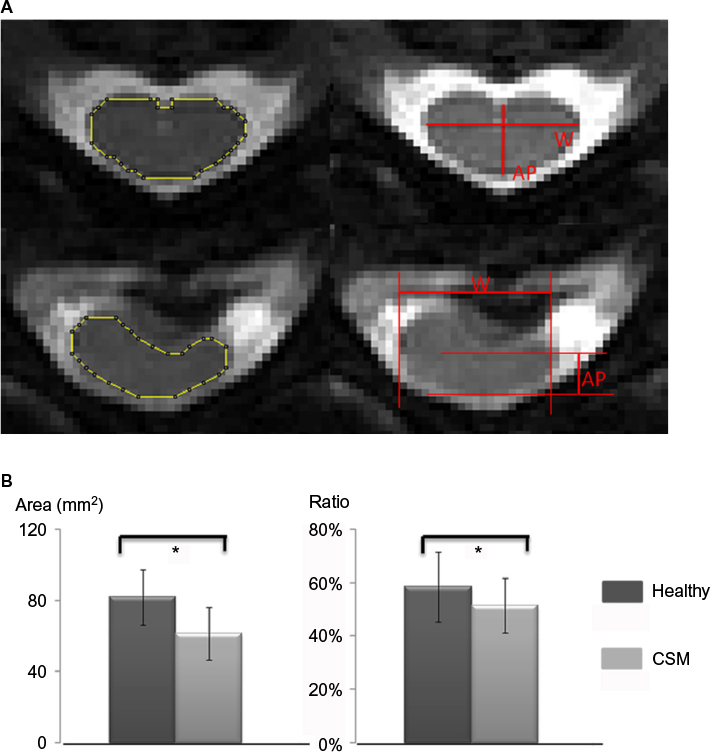 | Figure 2 Illustration of the measurement of spinal cord morphometry (mean ± SD), including cross-sectional area and compression ratio of the spinal cord based on axial T2W images in healthy subjects (upper panel of image A) and patients with CSM (lower panel of image A). Compression ratio was calculated by dividing the smallest anteroposterior diameter of the cervical cord (AP) by the broadest transverse diameter (W) as AP/W. Histogram reveals a significant decrease in cross-sectional area and compression ratio in myelopathic cord compared with healthy cord (B) (*significant difference with P<0.05). Abbreviations: AP, anterior/posterior; CSM, cervical spondylotic myelopathy; T2W, T2 weighted. |
Diffusion tensor measurement was performed using DTI Studio software (Version 2.4.01 2003; Johns Hopkins Medical Institute, Johns Hopkins University, Baltimore, MA, USA). To reduce the effect of motion artifact, image volume realignment and three-dimensional rigid body registration with different diffusion gradients were conducted. The preprocessed diffusion-weighted data sets were used for the estimation of diffusion tensors, consisting of three eigenvalues and the corresponding eigenvectors. The maps of FA, AD, and RD were derived from the diffusion matrix accordingly. The regions of interest (ROI) were defined by the B0 images to cover the spinal cord manually (Figure 3A and B). ROI definition and morphometry measurements were performed using ImageJ (National Institute of Health, Bethesda, MD, USA). The mean value of FA, AD, and RD within the ROI compared between healthy subjects and patients with CSM was used for correlation with fMRI signal changes.
 | Figure 3 Representative sagittal T2W, B0, FA, AD, and RD images at the C3–C4 level in healthy (A) and myelopathic cord (B). FA image shows the intact structural integrity of healthy cord. Structural integrity is damaged in myelopathic cord in which the disk herniation is clearly visible. Histogram (mean ± SD) reveals a significant decrease in FA value and increase in RD value in myelopathic cord, whereas there was no difference in AD value, in comparison with healthy cord (C) (**significant difference with P<0.01). Abbreviations: AD, axial diffusivity; CSM, cervical spondylotic myelopathy; FA, fractional anisotropy; RD, radial diffusivity; T2W, T2 weighted. |
fMRI data analysis
fMR images of each subject were processed by using FSL (FMRIB Software Library, www.fmrib.ox.ac.uk/fsl). Motion correction was performed using FLIRT (FMRIB’s Linear Image Registration Tool).31 For each subject, a mask of the spinal cord was manually drawn on each slice to be segmented from surrounding tissues. The FEAT (FMRI Expert Analysis Tool) with general linear model analysis (FSL toolkit) was used to identify spinal voxels demonstrating a response matching gamma-variate hemodynamic response function (mean lag: 6 seconds; width: 3 seconds) based on earlier studies.32 The time series were band-pass filtered (0.05–0.5 Hz), and no spatial smoothing was performed due to the limited dimensions of the spinal cord and the expected extent.20 Active voxels were identified as those having P<0.0025 (uncorrected), which were consistent with the earlier fMRI in the cervical spinal cord.33 The mean MRI signal change at each time point of active voxels was obtained to generate the whole time course of the hemodynamic response to the neuronal activity in the spinal cord. Values were averaged for each subject across all active voxels. A mean time course was generated by averaging over each task block from the whole time course.14 Then, the baseline corrections were applied by using the average of the three points before the onset of stimulation in each block. The signal intensity change of stimuli-induced activation was defined as the average of the 10-second time window including the highest peak (Figure 1C).32 BOLD signal change corresponding to bilateral stimulation was used to correlate with morphometry and diffusion measurements, to investigate structure–function associations of the cervical spinal cord.
Statistical analysis
The statistical analysis was performed using SPSS 15.0 analysis software (SPSS Inc., Chicago, IL, USA). Differences in compression ratio, cross-sectional area, FA, AD, and RD values and BOLD signal change in patients with CSM versus healthy subjects were evaluated using two-tailed two-sample t-tests. Pearson’s correlation coefficient was used to evaluate the relationship between BOLD signal changes and the metrics of diffusion tensor measurements or morphometry. A value of P<0.05 was set as the statistical threshold.
Results
Morphometric data
Figure 2B shows the results of comparison of cross-sectional area and compression ratio of the spinal cord in healthy and myelopathic cervical spinal cord. It was found that the cross-sectional area in healthy cord (81.78±15.59 mm2) was significantly larger than myelopathic cord (61.35±14.71 mm2; P<0.05). Meanwhile, the compression ratio of healthy cord (58.33%±13.03%) was also significantly higher in comparison with myelopathic cord (51.51%±10.13%; P<0.05).
BOLD functional activation
Functional responses in response to somatosensory stimuli could be observed in both healthy and myelopathic cord, as shown in Figure 1B. It was found that the BOLD signal change in myelopathic cord was significantly higher than that in healthy cord, which was consistently related to the stimulation applied to left hand (healthy: 5.16%±0.41%; CSM: 6.46%±1.02%, P<0.05), right hand (healthy: 5.14%±0.28%; CSM: 7.23%±1.14%, P<0.01), and bilateral hand (healthy: 5.52%±0.21%; CSM: 7.86%±0.95%, P<0.01). In addition, the signal change related to bilateral stimulation was significantly higher than unilateral stimulation in both healthy subjects or patients with CSM (P<0.05), while there was no significant difference of signal change with regard to left or right hand stimulation (P>0.05).
Diffusion tensor imaging
As shown in Figure 3C, diffusion tensor images demonstrated diffusion property changes of myelopathic cord in comparison with healthy cord. Compared with healthy subjects, the FA value of patients with CSM was significantly decreased (healthy: 0.65±0.07; CSM: 0.53±0.10; P<0.01). There was no significant difference of AD value between healthy subjects and patients with CSM (healthy: 1.71±0.14×10⁻³ mm2/s; CSM: 1.73±0.13×10⁻³ mm2/s; P>0.05), whereas RD value in patients with CSM was significantly higher in comparison with that in healthy subjects (healthy: 0.63±0.12×10⁻³ mm2/s; CSM: 1.05±0.47×10⁻³ mm2/s; P<0.01).
fMRI activation versus morphometry and diffusion measurement
The relationship of compression ratio, cross-sectional area, FA value, and RD value versus BOLD signal change was revealed separately, as shown in Figure 4. The morphometry measurement did not correlate with functional response in healthy subjects or patients with CSM (compression ratio versus BOLD signal change, healthy: r=-0.3249, P=0.2571; CSM: r=0.4733, P=0.3430). Cross-sectional area versus BOLD signal change, (healthy: r=0.1128, P=0.7011; CSM: r=-0.1712, P=0.7457). The BOLD signal change was significantly correlated with FA value in patients with CSM (r=-0.8938, P=0.0163), and a strong trend in the opposite direction was shown in healthy subjects (r=0.4887, P=0.0764). Significant correlation between BOLD signal change and RD value was found in healthy subjects (r=-0.5348; P=0.0488) and patients with CSM (r=0.8239; P=0.0438).
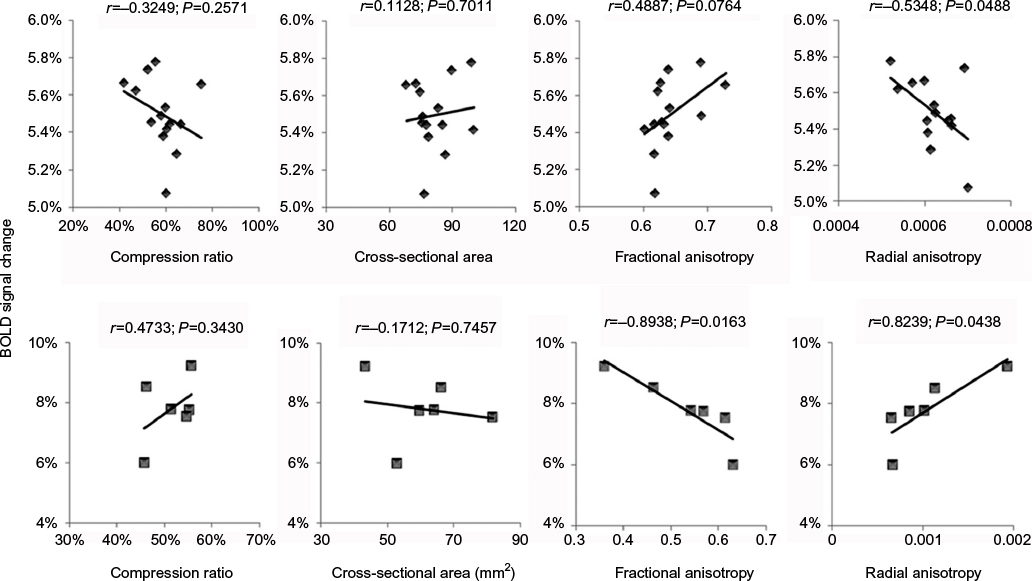 | Figure 4 Correlations of functional activation versus morphometry or microstructural integrity in healthy (upper row) and myelopathic cord (lower row). Notes: It was found that the relationship between BOLD signal change and FA value indicates a significant linear correlation in patients with CSM and a nonsignificant trend in healthy subjects. Both healthy and myelopathic cord showed a significant correlation between BOLD signal change and RD value. The correlation of functional response versus diffusion tensor measurement was much higher than that of morphometry. Abbreviations: BOLD, blood oxygen level dependent; CSM, cervical spondylotic myelopathy; FA, fractional anisotropy; RD, radial diffusivity. |
Discussion
In this study, we used conventional T2W imaging and DTI to measure the macroscopic morphometry and microstructural integrity within healthy and myelopathic spinal cord. The structural information was then correlated with a functional assessment: the neural activation of spinal cord in response to the somatosensory stimulation detected by BOLD fMRI. The result indicated that cross-sectional area, compression ratio, and FA value in myelopathic cord were all significantly lower than that in healthy cord. RD value in myelopathic cord was significantly higher than that in healthy cord. FA value exhibited a significant linear correlation with fMRI response in myelopathic cord, and a nonsignificant trend in healthy cord. Both healthy and myelopathic cord showed a significant correlation between fMRI response and RD value. This study provides the first demonstration, to the best of our knowledge, of a quantitative relationship between the structure and function in healthy and myelopathic cord by a combination of anatomical, diffusion tensor, and fMRI, and also it provides information about residual function in the compressed cord, which describes the various surgical prognoses of CSM.
Methodological considerations and spinal BOLD response related to somatosensory stimulation
We have chosen somatosensory stimulation in this study for BOLD signal acquisition because patients with CSM may have difficulty performing a motor task independently, and to avoid intersubject variability caused by different performances of the tasks.34 Compared with motor tasks, sensory input produces a more broad response, with different sensory paths forming synapses in different locations.17 The rostrocaudal of the segmental fMRI activation in response to median sensory stimuli was reported to localize at C4–T117 and C3–C8.19 Therefore, the BOLD signal was acquired from the level of C3–C8 in our study (Figure 1A). Compared with brain, the threshold used for spinal fMRI analysis was relatively lower, where Z value ranged from 1.6 to 3.1.12,15,17,20,32,33 In consideration of 256 volumes acquired in each run, the threshold for identifying the active voxels in our study is much stricter than those thresholds used in earlier spinal BOLD fMRI studies. In this study, the stimulation block applied to the left hand, right hand, and bilateral hand was designed to be given in a pseudorandom order. The result showed that BOLD signal change in response to bilateral sensory stimulation was significantly higher than unilateral stimulation in healthy and myelopathic cord. The BOLD signal change in healthy cord (5.1%–5.5%) was consistent with the earlier reports,18,20 whereas the signal change in myelopathic cord (6.5%–7.9%) was significantly higher than that in healthy cord. Earlier studies have reported that there was enhanced activation in diseased35 or injured cord36 in comparison with healthy cord. Our results indicate that this enhanced fMRI response could also be detected in CSM.
Investigation of structural integrity of cervical spinal cord via diffusion anisotropy
DTI has been widely applied in the spinal cord for detailed analyses of tissue morphology and pathology.7 By measuring changes in the directional diffusion of water, FA can reflect structural characteristics of white matter (eg, axonal diameter, fiber density, and myelination) and quantify the integrity of these structures.37 As shown in Figure 3, compared with intact healthy cord, the structural integrity of myelopathic cord was obviously impaired by compression due to disk herniation. The FA value of healthy cord found in our study was 0.65±0.07 (C2–C7), which is in agreement with earlier reports: from 0.74±0.01 (C2) to 0.56±0.02 (C7),4 0.721±0.027 (C2–C7),38 0.57±0.04 (C2–C7),39 and 0.61±0.05.40 The FA value measured in myelopathic cord was 0.53±0.10, which was also comparable with 0.311–0.62141 and 0.498±0.114.42 Notably, the FA value measured in this study is slice averaged rather than being measured at compression level or stenotic segments, due to the following reasons: 1) FA value in the spinal cord is decreased with level,38,39 thus the values at different levels should be normalized before comparison. 2) There are multilevel compression cases among patients with CSM, so that only the FA value at the most severe compression level could not represent the entire structural abnormalities of spinal cord. 3) Even in the single-level compression cases, it was found that the lowest FA value did not inevitably occur at the site of compression.28 Therefore, in the current study, we used the averaged FA value of cervical spinal cord to characterize the overall extent of microstructural integrity.
To facilitate interpretation of the FA value changes in CSM, we also examined the AD and RD value. AD describes the principal eigenvalue (λ1) and provides information about the integrity of axons, whereas RD describes the mean of remaining two minor eigenvalues (λ2 and λ3) perpendicular to the axonal fibers and provides information about the integrity of myelin.11,43 Our result demonstrates that RD value of myelopathic cord had a significant increase in comparison with healthy cord while there was no significant difference of AD value, in accordance with the earlier studies.44 The current finding tentatively suggests that the reduced integrity (decreased FA) in CSM was mainly due to myelin loss and the increased freedom of cross-fiber diffusion in nerve tracts (increased RD), rather than axonal damage (decreased AD).
Speculation on the relationship between function and structure of the spinal cord
The current study examined the relationship of functional activation versus macroscopic structure provided by the T2W images and microstructural integrity provided by diffusion tensor images in healthy and myelopathic cervical spinal cord. FA and RD values showed a much higher correlation with functional response compared with cross-sectional area or compression ratio. This result indicates that diffusion tensor measurement provides a more accurate estimation of functional behavior than morphometry. The enhanced spinal cord activation associated with structural damage may reflect the functional reorganization of the myelopathic cord. Earlier studies have investigated the functional reorganization of central nerve system by using fMRI in humans45,46 and animals.47 These studies indicated that the intact cortex or cord demonstrates profound reorganization to compensate the deficits of the injured site, which corresponds to the behavioral adaptations. Moreover, expanded cortical activation was detected in patients with CSM.48 The enhanced fMRI response of myelopathic cord might be the result of more neurons and synapses involved in performing neurological activity, corresponding to the increased area of cortical activation. Our current result also, interestingly, showed a significant linear correlation of increased BOLD signals with decreased FA and increased RD value in myelopathic cord. This finding indicates that the extent of microstructural damage is a factor relevant to the extent of functional reorganization in the CSM.
Several limitations of the current study should be considered. First, the sample size of the patients with CSM was relatively small due to the long duration of the acquisition and discomfort from somatosensory stimulation. Nevertheless, our results successfully demonstrated structural abnormalities as well as a significant correlation with the enhanced functional activation in myelopathic cord. The applicability of the combination of fMRI and DTI techniques would provide precise evaluation of the severity and the prognosis of surgical outcomes after a large-scale clinical study in the future. Second, the compromised spatial resolution of spinal cord caused the partial volume effect, which poses a difficult challenge for the analysis of diffusion MR imaging of spinal cord.49 In addition, the low spatial resolution of the BOLD fMR imaging does not allow us to clearly determine which regional increase in activation played a functional role in compensating for the structural damage in the patients. Therefore, further improvement on imaging spatial resolution to provide more spatial information about functional reorganization of spinal cord is an important future goal.
Conclusion
The current study demonstrated morphometric abnormalities and microstructural changes in myelopathic cord compared with healthy cord, as measured by conventional T2W imaging and DTI. Diffusion tensor measurements indicated a stronger correlation with BOLD functional behavior than morphometry. The decreased FA value and increased RD value were significantly and linearly related to increased functional activation, which reflects that the extent of microstructural damage is related to the extent of functional reorganization in CSM. This study shows that the assessment of spinal cord functional activity associated with microstructural integrity measurement holds significant promise to gain a deep understanding of functional reorganization and structural damage in CSM.
Acknowledgments
This study was supported by the National Natural Science Foundation of China (81572193), General Research Fund of the University Grant Council of Hong Kong (771608M), and Shenzhen Knowledge Innovation Program of Basic Research Items of Guangdong Province (JCYJ20150331142757393).
Disclosure
The authors report no conflicts of interest in this work.
References
Baptiste DC, Fehlings MG. Pathophysiology of cervical myelopathy. Spine J. 2006;6(6 suppl):190S–197S. | ||
Baron EM, Young WF. Cervical spondylotic myelopathy: a brief review of its pathophysiology, clinical course, and diagnosis. Neurosurgery. 2007;60(1 suppl 1):S35–S41. | ||
Mamata H, Jolesz FA, Maier SE. Apparent diffusion coefficient and fractional anisotropy in spinal cord: age and cervical spondylosis-related changes. J Magn Reson Imaging. 2005;22(1):38–43. | ||
Voss HU, Watts R, Ulug AM, Ballon D. Fiber tracking in the cervical spine and inferior brain regions with reversed gradient diffusion tensor imaging. Magn Reson Imaging. 2006;24(3):231–239. | ||
Ellingson BM, Salamon N, Grinstead JW, Holly LT. Diffusion tensor imaging predicts functional impairment in mild-to-moderate cervical spondylotic myelopathy. Spine J. 2014;14(11):2589–2597. | ||
Toktas ZO, Tanrikulu B, Koban O, Kilic T, Konya D. Diffusion tensor imaging of cervical spinal cord: a quantitative diagnostic tool in cervical spondylotic myelopathy. J Craniovertebr Junction Spine. 2016;7(1):26–30. | ||
Thurnher MM, Law M. Diffusion-weighted imaging, diffusion-tensor imaging, and fiber tractography of the spinal cord. Magn Reson Imaging Clin N Am. 2009;17(2):225–244. | ||
Basser PJ, Jones DK. Diffusion-tensor MRI: theory, experimental design and data analysis – a technical review. NMR Biomed. 2002;15(7–8):456–467. | ||
DeBoy CA, Zhang J, Dike S, et al. High resolution diffusion tensor imaging of axonal damage in focal inflammatory and demyelinating lesions in rat spinal cord. Brain. 2007;130(pt 8):2199–2210. | ||
Giorgio A, Palace J, Johansen-Berg H, et al. Relationships of brain white matter microstructure with clinical and MR measures in relapsing-remitting multiple sclerosis. J Magn Reson Imaging. 2010;31(2):309–316. | ||
Song SK, Sun SW, Ramsbottom MJ, Chang C, Russell J, Cross AH. Dysmyelination revealed through MRI as increased radial (but unchanged axial) diffusion of water. Neuroimage. 2002;17(3):1429–1436. | ||
Yoshizawa T, Nose T, Moore GJ, Sillerud LO. Functional magnetic resonance imaging of motor activation in the human cervical spinal cord. Neuroimage. 1996;4(3 pt 1):174–182. | ||
Madi S, Flanders AE, Vinitski S, Herbison GJ, Nissanov J. Functional MR imaging of the human cervical spinal cord. AJNR Am J Neuroradiol. 2001;22(9):1768–1774. | ||
Govers N, Beghin J, Van Goethem JW, et al. Functional MRI of the cervical spinal cord on 1.5 T with fingertapping: to what extent is it feasible? Neuroradiology. 2007;49(1):73–81. | ||
Ng MC, Wu EX, Lau HF, Hu Y, Lam EY, Luk KD. Cervical spinal cord BOLD fMRI study: modulation of functional activation by dexterity of dominant and non-dominant hands. Neuroimage. 2008;39(2):825–831. | ||
Dietz V, Macauda G, Schrafl-Altermatt M, Wirz M, Kloter E, Michels L. Neural coupling of cooperative hand movements: a reflex and fMRI study. Cereb Cortex. 2015;25(4):948–958. | ||
Backes WH, Mess WH, Wilmink JT. Functional MR imaging of the cervical spinal cord by use of median nerve stimulation and fist clenching. AJNR Am J Neuroradiol. 2001;22(10):1854–1859. | ||
Stroman PW, Ryner LN. Functional MRI of motor and sensory activation in the human spinal cord. Magn Reson Imaging. 2001;19(1):27–32. | ||
Stracke CP, Pettersson LG, Schoth F, Moller-Hartmann W, Krings T. Interneuronal systems of the cervical spinal cord assessed with BOLD imaging at 1.5 T. Neuroradiology. 2005;47(2):127–133. | ||
Summers PE, Ferraro D, Duzzi D, Lui F, Iannetti GD, Porro CA. A quantitative comparison of BOLD fMRI responses to noxious and innocuous stimuli in the human spinal cord. Neuroimage. 2010;50(4):1408–1415. | ||
Stroman PW, Tomanek B, Krause V, Frankenstein UN, Malisza KL. Mapping of neuronal function in the healthy and injured human spinal cord with spinal fMRI. Neuroimage. 2002;17(4):1854–1860. | ||
Persson J, Nyberg L, Lind J, et al. Structure-function correlates of cognitive decline in aging. Cereb Cortex. 2006;16(7):907–915. | ||
Palmer HS, Garzon B, Xu J, Berntsen EM, Skandsen T, Haberg AK. Reduced fractional anisotropy does not change the shape of the hemodynamic response in survivors of severe traumatic brain injury. J Neurotrauma. 2010;27(5):853–862. | ||
Kim DS, Kim M. Combining functional and diffusion tensor MRI. Ann N Y Acad Sci. 2005;1064:1–15. | ||
Javad F, Warren JD, Micallef C, et al. Auditory tracts identified with combined fMRI and diffusion tractography. Neuroimage. 2014;84:562–574. | ||
Yonenobu K, Abumi K, Nagata K, Taketomi E, Ueyama K. Interobserver and intraobserver reliability of the Japanese Orthopaedic Association scoring system for evaluation of cervical compression myelopathy. Spine (Phila Pa 1976). 2001;26(17):1890–1894; discussion 1895. | ||
Cui JL, Wen CY, Hu Y, Li TH, Luk KD. Entropy-based analysis for diffusion anisotropy mapping of healthy and myelopathic spinal cord. Neuroimage. 2011;54(3):2125–2131. | ||
Cui JL, Wen CY, Hu Y, Mak KC, Mak KH, Luk KD. Orientation entropy analysis of diffusion tensor in healthy and myelopathic spinal cord. Neuroimage. 2011;58(4):1028–1033. | ||
Summers P, Staempfli P, Jaermann T, Kwiecinski S, Kollias S. A preliminary study of the effects of trigger timing on diffusion tensor imaging of the human spinal cord. AJNR Am J Neuroradiol. 2006;27(9):1952–1961. | ||
Fujiwara K, Yonenobu K, Hiroshima K, Ebara S, Yamashita K, Ono K. Morphometry of the cervical spinal cord and its relation to pathology in cases with compression myelopathy. Spine (Phila Pa 1976). 1988;13(11):1212–1216. | ||
Jenkinson M, Bannister P, Brady M, Smith S. Improved optimization for the robust and accurate linear registration and motion correction of brain images. Neuroimage. 2002;17(2):825–841. | ||
Maieron M, Iannetti GD, Bodurka J, Tracey I, Bandettini PA, Porro CA. Functional responses in the human spinal cord during willed motor actions: evidence for side- and rate-dependent activity. J Neurosci. 2007;27(15):4182–4190. | ||
Giulietti G, Giove F, Garreffa G, Colonnese C, Mangia S, Maraviglia B. Characterization of the functional response in the human spinal cord: impulse-response function and linearity. Neuroimage. 2008;42(2):626–634. | ||
Giove F, Garreffa G, Giulietti G, Mangia S, Colonnese C, Maraviglia B. Issues about the fMRI of the human spinal cord. Magn Reson Imaging. 2004;22(10):1505–1516. | ||
Agosta F, Valsasina P, Caputo D, Stroman PW, Filippi M. Tactile-associated recruitment of the cervical cord is altered in patients with multiple sclerosis. Neuroimage. 2008;39(4):1542–1548. | ||
Kornelsen J, Stroman PW. Detection of the neuronal activity occurring caudal to the site of spinal cord injury that is elicited during lower limb movement tasks. Spinal Cord. 2007;45(7):485–490. | ||
Mukherjee P, Berman JI, Chung SW, Hess CP, Henry RG. Diffusion tensor MR imaging and fiber tractography: theoretic underpinnings. AJNR Am J Neuroradiol. 2008;29(4):632–641. | ||
Xiangshui M, Xiangjun C, Xiaoming Z, et al. 3 T magnetic resonance diffusion tensor imaging and fibre tracking in cervical myelopathy. Clin Radiol. 2010;65(6):465–473. | ||
Lindberg PG, Feydy A, Maier MA. White matter organization in cervical spinal cord relates differently to age and control of grip force in healthy subjects. J Neurosci. 2010;30(11):4102–4109. | ||
Wheeler-Kingshott CA, Hickman SJ, Parker GJ, et al. Investigating cervical spinal cord structure using axial diffusion tensor imaging. Neuroimage. 2002;16(1):93–102. | ||
Kara B, Celik A, Karadereler S, et al. The role of DTI in early detection of cervical spondylotic myelopathy: a preliminary study with 3-T MRI. Neuroradiology. 2011;53(8):609–616. | ||
Lee JW, Kim JH, Park JB, et al. Diffusion tensor imaging and fiber tractography in cervical compressive myelopathy: preliminary results. Skeletal Radiol. 2011;40(12):1543–1551. | ||
Budde MD, Kim JH, Liang HF, et al. Toward accurate diagnosis of white matter pathology using diffusion tensor imaging. Magn Reson Med. 2007;57(4):688–695. | ||
Hesseltine SM, Law M, Lopez S, Babb J, Johnson G. Diffusion tensor imaging evaluation of the cervical spinal cord in spondylosis: evaluation of changes in major and minor eigenvalues. Proceeding of the ISMRM. Seattle, WA, USA; 2006. | ||
Agosta F, Valsasina P, Rocca MA, et al. Evidence for enhanced functional activity of cervical cord in relapsing multiple sclerosis. Magn Reson Med. 2008;59(5):1035–1042. | ||
Schaechter JD, Perdue KL, Wang R. Structural damage to the corticospinal tract correlates with bilateral sensorimotor cortex reorganization in stroke patients. Neuroimage. 2008;39(3):1370–1382. | ||
Sydekum E, Baltes C, Ghosh A, Mueggler T, Schwab ME, Rudin M. Functional reorganization in rat somatosensory cortex assessed by fMRI: elastic image registration based on structural landmarks in fMRI images and application to spinal cord injured rats. Neuroimage. 2009;44(4):1345–1354. | ||
Holly LT, Dong Y, Albistegui-DuBois R, Marehbian J, Dobkin B. Cortical reorganization in patients with cervical spondylotic myelopathy. J Neurosurg Spine. 2007;6(6):544–551. | ||
Maier SE, Mamata H. Diffusion tensor imaging of the spinal cord. Ann N Y Acad Sci. 2005;1064:50–60. |
 © 2016 The Author(s). This work is published and licensed by Dove Medical Press Limited. The
full terms of this license are available at https://www.dovepress.com/terms
and incorporate the Creative Commons Attribution
- Non Commercial (unported, 3.0) License.
By accessing the work you hereby accept the Terms. Non-commercial uses of the work are permitted
without any further permission from Dove Medical Press Limited, provided the work is properly
attributed. For permission for commercial use of this work, please see paragraphs 4.2 and 5 of our Terms.
© 2016 The Author(s). This work is published and licensed by Dove Medical Press Limited. The
full terms of this license are available at https://www.dovepress.com/terms
and incorporate the Creative Commons Attribution
- Non Commercial (unported, 3.0) License.
By accessing the work you hereby accept the Terms. Non-commercial uses of the work are permitted
without any further permission from Dove Medical Press Limited, provided the work is properly
attributed. For permission for commercial use of this work, please see paragraphs 4.2 and 5 of our Terms.