Back to Journals » International Journal of Nanomedicine » Volume 15
A Cleverly Designed Novel Lipid Nanosystem: Targeted Retention, Controlled Visual Drug Release, and Cascade Amplification Therapy for Mammary Carcinoma in vitro
Authors Zhao XZ ![]() , Zhang W, Cao Y, Huang SS
, Zhang W, Cao Y, Huang SS ![]() , Li YZ
, Li YZ ![]() , Guo D, Wang XY, Ran HT
, Guo D, Wang XY, Ran HT ![]()
Received 4 January 2020
Accepted for publication 5 May 2020
Published 3 June 2020 Volume 2020:15 Pages 3953—3964
DOI https://doi.org/10.2147/IJN.S244743
Checked for plagiarism Yes
Review by Single anonymous peer review
Peer reviewer comments 2
Editor who approved publication: Dr Linlin Sun
Xiang-Zhi Zhao, 1, 2 Wei Zhang, 1 Yang Cao, 1, 3 Shuai-Shuai Huang, 4 Yi-Zhen Li, 5 Dan Guo, 1 Xing-Yue Wang, 1 Hai-Tao Ran 1, 3
1Ultrasound Department of the Second Affiliated Hospital of Chongqing Medical University, Chongqing Key Laboratory of Ultrasound Molecular Imaging, Chongqing 400016, People’s Republic of China; 2Department of Cardiovascular Ultrasound, Affiliated Hospital of Southwest Medical University, Luzhou 646000, Sichuan Province, People’s Republic of China; 3Ultrasound Department, The Second Affiliated Hospital of Chongqing Medical University, Chongqing 400010, People’s Republic of China; 4Department of Renal Disease, Urology and Nephrology Hospital of Ningbo University, Ningbo 315100, Zhejiang, People’s Republic of China; 5Department of Cardiovascular Ultrasound and Noninvasive Cardiology, Sichuan Academy of Medical Sciences & Sichuan Provincial People’s Hospital, Chengdu, Sichuan 610072, People’s Republic of China
Correspondence: Hai-Tao Ran
Ultrasound Department of the Second Affiliated Hospital of Chongqing Medical University, No. 76, Linjiang Road, Chongqing, Yuzhong District 400010, People’s Republic of China
Email [email protected]
Objective: To construct an ideal theranostic nanoplatform (LIP3); to clarify its physicochemical properties; to confirm its characteristics of dual-modality imaging, active-targeting, and cascade amplification therapy for mammary carcinoma; and to perform a preliminary exploration of the cytotoxicity mechanism.
Design: A self-prepared liposome nanosystem, LIP3, can actively target 4T1 cells because the surface is linked with C-RGD. Haematoporphyrin monomethyl ether (HMME), an excellent sonosensitizer entrapped in the lipid bilayer, can function in photoacoustic imaging. Low-intensity focused ultrasound (LIFU) of ultrasound-targeted microbubble destruction (UTMD) promotes localized drug delivery into tumours because PFH, a phase-change substance, is loaded in the LIP3 core, achieving visualization of targeted drug release, and sonodynamic therapy (SDT) can kill tumour cells. SDT provides a favourable environment for AQ4N, resulting in amplification of LIP3 treatment. Therefore, LIP3 shows targeted aggregation and targeted release, integrating dual-mode imaging and precise treatment.
Results: The self-prepared lipid nanosystem, LIP3, meets the above expectations and has ideal physicochemical properties, with a regular sphere with uniform distribution. Contrast-enhanced ultrasound (CEUS), photoacoustic imaging, and bimodal imaging were effective in vitro. In 4T1 cell experiments, the cell capacity was as high as 42.9%, and the cytotoxicity to 4T1 was more than 5 times that of LIP1 (containing AQ4N only) and more than 2 times that of LIP2 (containing only HMME), achieving comparable results as cascade therapy for mammary cancer.
Conclusion: LIP3, a theranostic nanoplatform, was successfully constructed and conformed to the physicochemical characterization of ideal nanoparticles, with active-targeting, dual-modality imaging, visualized drug release, and precise treatment under the action of LIFU. SDT provides a favourable environment for AQ4N, resulting in amplification of LIP3 treatment. Therefore, LIP3 shows targeted aggregation and targeted release, integrating dual-mode imaging, and precise cascade treatment. This unique theranostic NPS with multiple capabilities is expected to be a favourable anti-cancer method in the future.
Keywords: LIFU, SDT, HMME, AQ4N
Corrigendum for this paper has been published
Introduction
Because of their advantages of drug loading and controlled and targeted release, various nanomaterials have been developed; such materials represent promising cancer treatment strategies. Nanoparticles with a size between 1 and 200 nm can be fully dispersed in aqueous solution, and various forms can avoid complement cascade activation and ultimately clearance by immune cells and macrophages.1 The advancement of nanotechnology has made it possible to diagnose diseases in the early stages and has enabled image-guided and personalized therapy.2–4 Nanoparticle system (NPS)-integrated diagnosis and therapy allow nanoparticles to be used to monitor bioaccumulation sites and evaluate therapeutic effectiveness both in vitro and in vivo.5 Currently, the optimal combination of ultrasound and molecular biology techniques with nanoparticles can achieve the integration of diagnosis and treatment, visualization, and targeted diagnosis and therapy. Many studies in my laboratory have proven the potential of these systems.6–8 Ultrasonic molecular contrast agents can be made from various materials. Liposomes are highly efficient and excellent drug carriers.9–11 First, liposomes are amphiphilic carriers that can be loaded with hydrophobic drugs and hydrophilic substances. Second, liposomes can passively target tumour cells because tumour cells are rich in LDL receptors. In addition, their excellent biocompatibility and degradation properties make liposomes an ideal drug carrier, and these structures have been studied by many scholars.12–14
Sonodynamic therapy (SDT) exploits low-intensity focused ultrasound (LIFU) and sonosensitizer agents to cause profound physicochemical changes in cell structure. Several studies have confirmed that SDT has notable therapeutic effects on various tumour cell lines and tumours without obvious toxic side effects.15 However, the extremely hypoxic tumour microenvironment resulting from the production of high levels of reactive oxygen species (ROS) in the process of SDT causes poor results in conventional chemotherapy. Recently, many scholars have proposed the full use of this hypoxic environment to improve the antitumour effects.16 The tumour cytotoxicity of prodrugs stimulated by hypoxia has attracted extensive attention from many scholars.17 AQ4N is an aromatic bioreductive prodrug and shows no toxicity in healthy cells. Moreover, it will react with cytochrome 450 and produce the tumour-cytotoxic products AQ4 and AQ4M in a hypoxic environment. Currently, AQ4N is the only topoisomerase II inhibitor that can inhibit cell proliferation and promote apoptosis.
Based on the above background, we designed a lipid NPS, LIP3, which features a core-shell structure: a lipid bilayer acts as the shell, and the liquid-gas phase change material PFH and the water-soluble prodrug AQ4N act as the core. The bilayer contains an excellent sonosensitizer, haematoporphyrin monomethyl ether (HMME), and the LIP3 surface is linked with the polypeptide C-RGD, which can actively target 4T1 cells (Figure 1A). Consequently, in terms of therapy, the LIP3 can be used in combination with LIFU to achieve the targeted release of drugs for the ideal therapeutic effect under the synergy of SDT and AQ4N. The mechanism and process are illustrated in Figure 1B. With respect to imaging, LIP3 is responsive to bimodal, photoacoustic (PA) and contrast-enhanced ultrasound (CEUS) imaging. Therefore, LIP3 integrates diagnosis with therapy, achieving targeted drug delivery and targeted therapy (Figure 1B). In addition, the lipid material has good biocompatibility and no toxic side effects. LIP3 also has the following characteristics in terms of tumour targeting and retention: 1. The surface is connected to C-RGD, which can actively target breast cancer cells. 2. Tumour cells contain higher concentrations of phosphatase and acylase than normal cells, as well as more LDL receptors, which can promote the local aggregation of lipid nanoparticles in tumour tissues. 3. Due to the enhanced penetration and retention effects in the tumour environment, nanoparticles will undergo increased passive targeted accumulation in the tumour region.
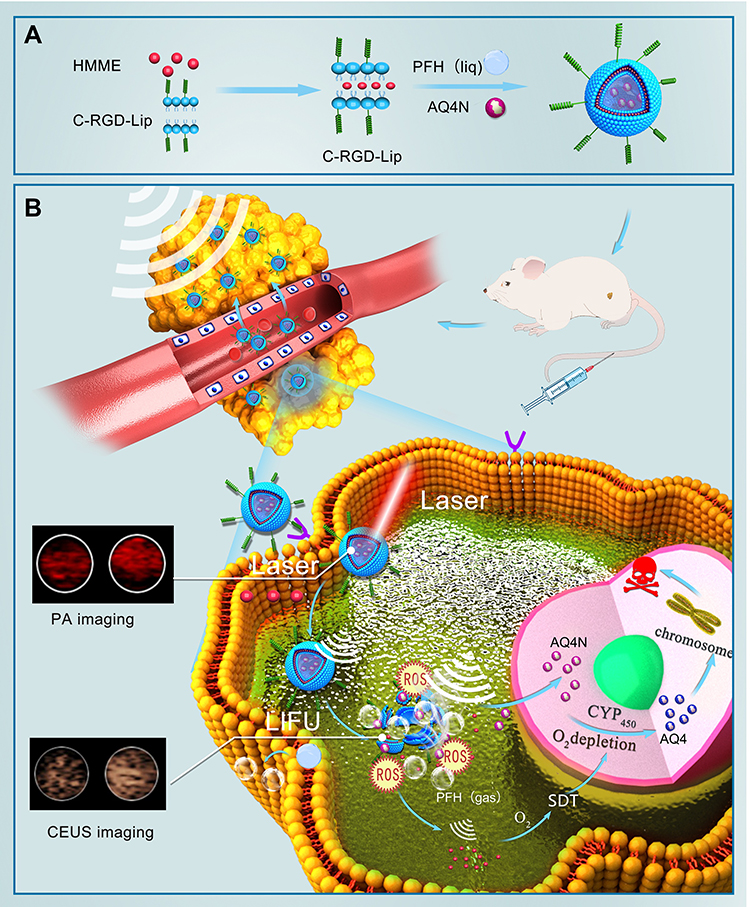 |
Figure 1 Mechanistic schematic of LIP3. (A) Synthesis process of LIP3. (B) Mechanistic schematic of LIP3 bimodal imaging and therapy. |
Materials and Methods
Materials
Distearoylphosphatidylglycerol (DPPG), 1,2-dipalmitoyl-sn-glycero-3-phosphocholine (DPPC), and DC-cholesterol (DC-CHOL) were all provided by Avanti Polar Lipids (700 Industrial Park Drive, Alabaster, Alabama, USA). Additionally, 1,2-distearoyl-sn-glycero-3-phosphoethanolamine-N-[methoxy(polyethyleneglycol)]-2000&C-RGD (DSPE-2000&C-RGD) were purchased from Xi’an Ruixi Biological Technology Co., Ltd. Banoxantrone (AQ4N) and perfluorohexane (PFH) were supplied by Abcam and Sigma-Aldrich, respectively. Haematoporphyrin monomethyl ether (HMME) was purchased from Macklin Bio Co., Ltd. The 4T1 mouse mammary carcinoma cell line and the human umbilical vein endothelial cell line (HUVECs) were supplied by Nanjing Ke Bai Biotechnology Co., Ltd. Cell Counting Kit-8 (CCK-8) was purchased from Dojindo. Singlet oxygen sensor green (SOSG) was purchased from Invitrogen. Furthermore, 4,6-diamidino-2-phenylindole (DAPI) was purchased from Wuhan Boster Biotech Company, and 2′,7′-dichlorofluorescein diacetate (DCFH-DA) was purchased from Shanghai Beyotime Biotechnology Co., Ltd.
Methods
Preparation of LIP0, LIP1, LIP2, and LIP3
The conventional film dispersion-ultrasonic oscillation method was used; the synthesis process is shown in Figure 1A. Briefly, the mixed lipids and liposoluble drug were weighed according to a specific ratio (DPPC:DPPG:DSPE&C-RGD/DSPE:CHOL:HMME=mass ratio: 5:2:1.5:1.5:2) and dissolved in an organic solvent, which was removed by a rotary evaporator in the next step until a uniform thin film formed. Then, it was dissolved with phosphate-buffered saline (PBS). Next, PFH (120 μL) and AQ4N (120 μL, 2 mg/mL) were added. Finally, the LIPs were obtained by ultrasonic oscillation with a sonicator, and low-temperature centrifugation was performed. All processes were performed in lucifugal surroundings. LIP1 refers to a lipid with a C-RGD peptide nanoparticle platform loaded with AQ4N and PFH; LIP2 was loaded with PFH and HMME; and LIP3 was loaded with PFH, AQ4N and HMME; LIP0 was another LIP3, that is, with no target (C-RGD) connected to LIP3. Its structure is shown in Figure 2A.
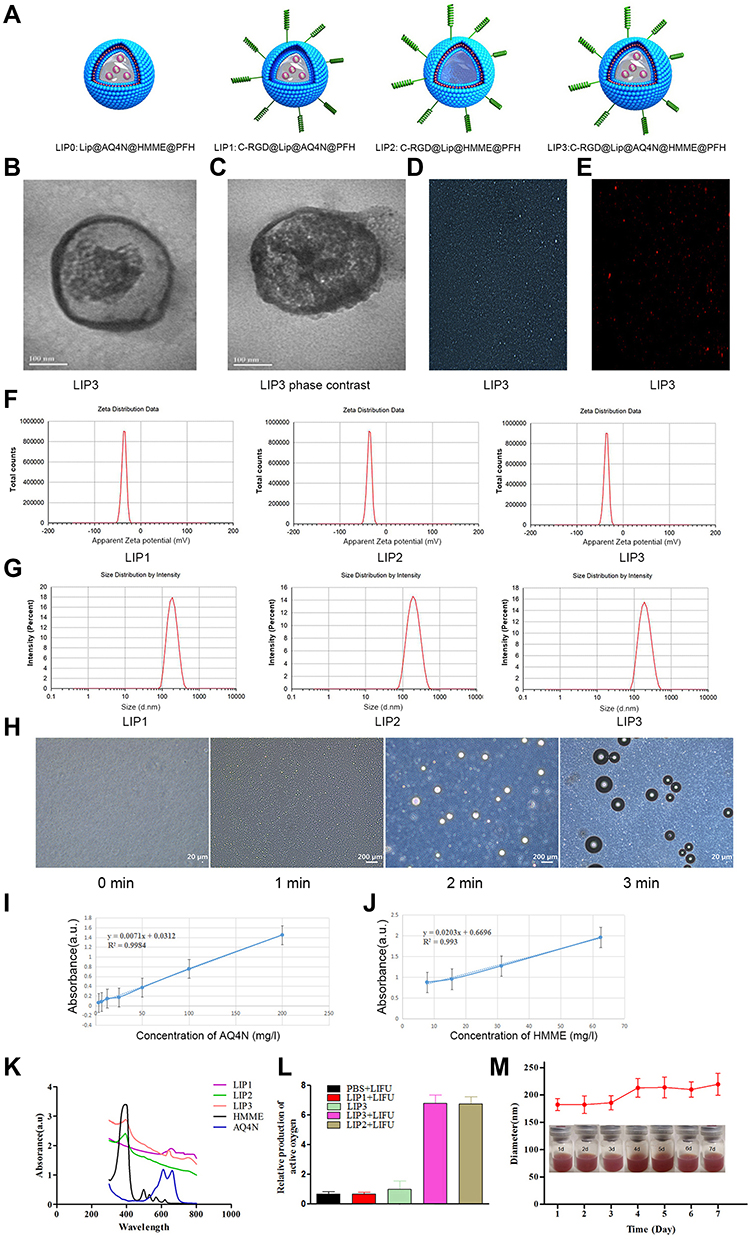 |
Figure 2 General physicochemical properties of LIP3. (A) Structure illustration of LIP0, LIP1, LIP2, and LIP3. (B) TEM of LIP3. (C) Phasing sign TEM of LIP3. (D) Light microscopy image of LIP3. (E) Fluorescence microscope image of DiI-stained LIP3 NPs (×400). (F) Zeta potential of LIP1, LIP2, and LIP3. (G) Size of LIP1, LIP2, and LIP3. (H) LIP3 light microscopy image of the sonogenic phase transition (× 400). (I) Correlation between concentration of AQ4N and absorbance. (J) Correlation between concentration of HMME and absorbance. (K) UV-vis–NIR absorbance spectra of LIP1, LIP2, and LIP3 and free HMME, AQ4N. (L) Relative production of active oxygen of LIP3. (M) LIP3 size distribution with prolonged time duration. Insert: digital photos of the LIP3 NPs dispersed in PBS (2.5 mg/mL). |
Observation of the Physicochemical Properties of LIP3
The morphology of LIP3 was observed under transmission electron microscopy (TEM), light microscopy, and fluorescence microscopy, and the size, polydispersion index (PDI) and surface potential were determined by a Malvern particle size analyser. A UV–Vis–NIR spectrometer was used to acquire the absorbance spectra of free HMME and AQ4N at wavelengths of 401 nm and 610 nm, respectively. A series of solutions of free HMME and AQ4N, which were used to construct a concentration-absorbance standard curve, were prepared, and a linear correlation equation was obtained. Then, 2 mL of LIP1, LIP2 and LIP3 were dissolved in 2 mL of DMSO, and the DMSO solution containing the nanoparticles was diluted to ensure that the concentrations of HMME and AQ4N in them were within the range of the standard curve (the middle of the standard curve was targeted), and the absorbance value was measured. The linear equation obtained from the standard curve was used to calculate the HMME and AQ4N contents in the measured LIP3; then, we calculated the HMME and AQ4N drug loading of LIP3. The mean particle sizes of LIP3 NPs dissolved in PBS were examined with prolonged time duration (1, 2, 3, 4, 5, 6 and 7 days). Additionally, the gross appearance differences were observed in digital photographs.
Evaluation of LIP3 Singlet Oxygen Production
Experimental groups: LIP1 + LIFU, LIP2 + LIFU, LIP3, and LIP3 + LIFU; control group: PBS + LIFU. LIP1, LIP2 and LIP3 were adjusted to the same concentration (1 mg/mL) in solution. The LIFU parameters were set to 2 W/cm2 and 1 MHz. The above LIP nanoparticles were placed in a 24-well plate, and an equal amount of singlet oxygen sensor green (SOSG) dissolved in PBS was added to the plate. The +LIFU groups were subjected to LIFU irradiation for 1 min in the dark. Them, 100 µL of the above solution was sampled at 30 seconds to observe the SOSG fluorescence intensity (FI), which was measured with a multifunctional enzyme labelling instrument. Relative ROS production=(experimental group FI − blank control group FI)/blank control group FI.
Observation of the Acoustic Droplet Vaporization of LIP3 Under LIFU Irradiation
The LIP3 concentration was set to 1 mg/mL. Then, 50 µL of LIP3 was placed in a 36-well cell plate, and the nanoparticles were irradiated with LIFU (3 W/cm2) for 30s. Then, the degrees of phase transition were observed at 0, 1, 2, and 3 min with 10 μL of nanoparticles, which were placed on a glass slide under a light microscope.
PA and CEUS Bimodal Imaging in vitro
To investigate the relationship between the CEUS imaging capabilities and the LIFU parameters and time, acoustic intensity (AI) groups of 2, 4 and 6 W/cm2 were used, and CEUS images of the LIP3 were collected at 1, 2, 3, and 4 min after LIFU irradiation by a colour ultrasonic diagnostic apparatus. DFY, an echo intensity analysis software programme, was used to obtain the echo intensity of each group. The LIFU parameters was set as follows: 1 MHz, focal length 1.5 cm, duty cycle 50%, and pulse mode.
Different concentrations of LIP3 emulsion were prepared, 0.25, 0.5, 1.0, 2.0, 4.0, and 8.0 mg/mL, and PBS was used as a control. LIP3 emulsion in an agarose gel model was irradiated by a 690-nm laser in the PA imager. The images displayed on the screen were saved, as were the PA signal values, and the correlations between different concentrations of LIP3 emulsion and the PA imaging results were then determined.
The Capacity of LIP3 to Target 4T1 Cells
HUVECs and 4T1 cells in the logarithmic growth phase were harvested, resuspended and adjusted to a cell density of 1×10⁵. Then, 100 µL of the above cell suspension was seeded into a CLSM petri dish and placed in an incubator at 37 °C under 5% CO2. The cells were incubated for 24 h until adherently grown. The freshly prepared LIP3 was diluted to 2 mg/mL and then mixed with the cell medium. The mixture was added to the above culture dish. The cells were incubated in the incubator for 1, 2, or 3 h; the mixture was discarded, and the cells were rinsed with PBS. Then, the tissues were fixed with 4% paraformaldehyde and stained with 50 μL of DAPI for 5 min. Confocal laser scanning microscopy (CLSM) was used to observe the binding of LIP3 with 4T1 cells and HUVECs.
To detect targeted binding efficiency between LIP3 and 4T1 cells, freshly prepared LIP3 and no-target (no C-RGD was connected to DSPE) LIP3 (denoted to LIP0) were prepared. The above cell suspensions in 100 µL were seeded into a 6-well plate and incubated until adherently grown. Then, the freshly prepared LIP3 and LIP0 (2 mg/mL) were added into and co-incubated for 3 h with HUVECs and 4T1 cells. Next, the cells were digested, centrifuged, resuspended, and analysed using flow cytometry (FCM, CytoFLEX, Beckman Coulter, USA).
Investigation of the Cytotoxicity of AQ4N in vitro
To investigate the cytotoxicity of AQ4N alone, prepared LIP1 nanoparticles and different concentrations of LIP1 (containing 0, 2.5, 5, 10, or 20 μM of AQ4N) were one experimental factor, and the hypoxic culture environment was another factor. First, 4T1 cells in the logarithmic growth phase were seeded at 1×10⁴ cells/well into 96-well plates and incubated in a cell incubator for 24 h. The cells were divided into two equal portions for culture in hypoxic and normoxic environments, and each group was further divided into 5 groups according to the concentration of LIP1, with 3 replicate wells in each group. The cells were incubated for 24 h in the incubator and rinsed 3 times with PBS. Then, the culture medium was added, and the cells were incubated for 24 h under normal oxygen conditions. The cells were rinsed 3 times with PBS, cell culture medium and 10 μL of CCK-8 reagent were added, and the cells were incubated for another 4 h. The optical density (OD) at 450 nm was measured using a multifunctional enzyme labelling instrument to reflect the number of viable cells. Cell viability (%)=(OD test group/OD control group)×100%.
Cytotoxicity of LIP3 Combined with LIFU and SDT Against 4T1 Cells in vitro
To further elucidate the synergistic effect of LIP3 nanoparticles, we designed the following experiment after demonstrating the cytotoxicity of LIP3. Different concentrations of LIP2 and LIP3 (HMME dose=0, 2.5, 5, 10, or 20 μM) were used as one experimental factor, and LIFU irradiation was used as another factor; ie, the experimental groups were subjected to LIFU irradiation, and no LIFU irradiation was used as a control. First, 4T1 cells in the logarithmic growth phase were seeded in a 96-well plate at a density of 1×10⁴ cells/well and incubated for 24 h in a cell incubator. Different concentrations of freshly prepared LIP2 and LIP3 were added and incubated. There were 6 duplicate wells in each concentration group in the cell plate. All the cells were placed in the incubator for 4 h in a normal oxygen environment and then rinsed with PBS 3 times, and cell culture medium was added. At this time, the cells were divided into two groups: LIFU and no LIFU. The LIFU group was subjected to LIFU irradiation for 30 s. All cells were incubated for 24 h under normal oxygen; then, the cells were rinsed with PBS 3 times, 10 μL of CCK-8 reagent was added, and the OD value at 450 nm was read by a multifunctional enzyme labelling instrument to assess the viability of the 4T1 cells.
Singlet Oxygen Production by LIP3 Combined with LIFU in 4T1 Cells
First, 4T1 cells in the logarithmic growth phase were divided into the LIP3+LIFU, LIP3, and PBS (blank control) groups. The cells were seeded in a laser confocal dish at a density of 1×10⁵ cells/well and incubated for 24 h. After the cells were rinsed with PBS, 1 mL of LIP3 (1 mg/mL) or 1 mL of PBS was added, and an equal amount of cell medium was added as well. The cells were incubated for 4 h. LIFU irradiation was performed in the LIP3+LIFU group. The LIFU parameter settings were 1.5 W/cm2 and 30 s. DCFH-DA (1:1000 serum-free medium dilution) was then added to each well, and the cells were incubated for 30 min. Finally, CLSM was used to observe the production of ROS.
Preliminary Observations of the Biosafety of LIP3 in vitro
A prepared erythrocyte suspension was made with 3–5 mL of fresh rabbit whole blood. Six clean glass tubes, each of them were filled into 0.2 mL of 2% erythrocyte suspension first, then, 4.8 mL of distilled water, or saline and LIP3 (5 mg/5 mL, 2.5 mg/5 mL, 1.25 mg/5 mL and 0.625mg/5 mL) was added respectively. The samples were incubated at 37ºC in a bath box for 4 h, and haemolytic reactions in the different groups were observed under LM. The samples were then centrifuged (1500r/min, 10 min), and the supernatants were observed by digital photograph, and a UV–Vis–NIR spectrometer was used for quantitative analysis of heme absorbance.Lastly, the hemolysis rate was calculated on the basis of peak absorbance data, that is, hemolysis rate=OD (sample-negative)/OD (positive-negative) ×100%.
Results and Discussion
To achieve a targeted drug concentration at the tumour, dual-modal imaging, accurate drug release, a synergistic therapeutic effect, and a good safety profile, we prepared a LIP3 nanosystem, choosing a mixed lipid component as the carrier. LIP3 is expected to be a core-shell structure; the lipid bilayer with HMME inside serves as the shell, the liquid phase-changeable PFH and the water-soluble AQ4N are the core, and the surface is linked to the polypeptide C-RGD, which actively targets breast cancer cells. Therefore, theoretically, LIP3 should show multiple-target tumour aggregation; PA imaging with HMME and CEUS imaging should show this as well since PFH can be phase-changed to respond to the action of LIFU. LIFU and HMME work together (accurate drug release under ultrasound) in SDT, which causes extreme hypoxia in the tumour microenvironment. This provides extremely favourable conditions for the reduction of AQ4N, and AQ4N exerts antitumour effects. Thus, our experiments were performed to verify the above theoretical expectations in vitro.
First, the general physical and chemical properties of the nanosystem will be discussed. TEM showed that LIP3 had a relatively regular spherical structure with a uniform particle size distribution, and the granular material in the core was AQ4N or PFH (Figure 2B). The particle size was approximately 200 nm. Because PFH is wrapped in LIP3, the high-speed electron beam used during TEM affected the sample, and liquid could easily be phase-changed in a vacuum; therefore, LIP3 has a phase change sign (Figure 2C). The pictures (Figure 2D and E) of LIP3 under light microscopy (LM) and fluorescence microscopy also reveal that LIP3 has the above general morphology. To further describe the physical characteristics of LIP3, we measured the particle size and potential of LIP1, LIP2, and LIP3 using a Malvern laser particle size analyser. The zeta potentials of the three materials were −37.1 mV, −36.3 mV, and −35.9 mV, respectively (Figure 2F). This result indicates that LIP3 has low agglomeration. The particle sizes and PDI were 180.5 nm (0.079), 184.5 nm (0.114), and 183.9 nm (0.116) (Figure 2G). The PDI were uniform, demonstrating self-prepared NPS. The optimal particle size of liposomes in tumour drug delivery systems is 100 nm;17 thus, the manufacturing process and distribution ratio of LIP3 need to be further optimized. The zeta potential results theoretically show that LIP3 is stable and easily stored. To investigate the theoretical and practical consistency, we observed LIP3 and measured the particle size for 7 days. The results showed that no significant change occurred within 7 days. Next, a UV spectrophotometer measured the absorbance of free HMME, AQ4N and LIP1, LIP2, and LIP3 at different wavelengths of visible light and obtained spectra for the five substances (Figure 2K). The absorption peaks of LIP1, LIP2, and LIP3 occurred at wavelengths of 665, 390, and 400/660 nm, respectively, which indicates that AQ4N is encapsulated in LIP1, HMME is encapsulated in LIP2, and both of them are encapsulated in LIP3. Then, on the basis of the standard curves (Figure 2I and J) of AQ4N and HMME, we obtained drug loadings of AQ4N and HMME in them of 1.879% and 9.954%, respectively, which are lower than other values reported; thus, the production process and feeding ratio need to be further optimized. Next, the acoustic droplet vaporization of LIP3 under LIFU irradiation was confirmed. The results showed that LIP3 has a core-shell structure with the granular drug distributed relatively uniformly in the core, and the size gradually increased as the irradiation time increased (Figure 2H). At 3 min, the core became small and compressed, and an increasing amount of gas formed by PFH gasification around the shell. This process demonstrates that LIP3 carrying PFH has a strong acoustic phase transition capability. LIP3 is expected to produce singlet oxygen, the most important mechanism of SDT. Therefore, we designed five groups, PBS+LIFU, LIP1+LIFU, LIP2+LIFU, LIP3, and LIP3+LIFU, and the singlet oxygen production of each group was determined (Figure 2L). There was no significant difference between the PBS+LIFU, LIP1+LIFU and LIP3 groups (P>0.05), a significant difference between the LIP3+LIFU group and the aforementioned groups (P<0.01), and no significant difference between the LIP2+LIFU and LIP3+LIFU groups (P>0.05). These results demonstrated that LIP2 and LIP3 can produce sufficient singlet oxygen to act on tumour cells under the action of LIFU, but pure LIFU and LIFU with the non-sound-sensitive agent LIP1 cannot produce singlet oxygen. Meanwhile, there was no appreciable difference in particle size of LIP3 dissolved in PBS, and the NPS suspension with a brown-red appearance did not produce any agglutination or precipitate within 7d, revealing the stability of the LIP3 stored at 4ºC (Figure 2M). Since the C-RGD linked to the LIP3 surface was purchased through commercial channels, no experiment could be designed to verify the connection targets.
After confirming the general physicochemical characteristics, LIP3 bimodal imaging in vitro was performed. In the CEUS imaging, different AI (2 W/cm2, 4 W/cm2, 6 W/cm2) and different times (1 min, 2 min, 3 min, and 4 min) were considered. The echo signal of CEUS was significantly enhanced over time under the same AI (Figure 3A). Furthermore, with increasing AI, the clarity of the CEUS imaging was increased. This result indicates that PFH in LIP3 is gradually phase-changed. Notably, there was no obvious echo signal difference under an AI of 6 W/cm2 at 3 and 4 min, indicating that the maximum value was reached at this point and that the phase-change of PFH occurred. Then CEUS imaging was analysed by DFY software, which provided specific grey values for each group (Figure 3A). The results further confirmed the above results. In vitro PA imaging showed that with increasing concentration, the PA signal was enhanced accordingly (Figure 3B). Quantitative analysis of the relationship between them showed a linear correlation (Figure 3B) with a correlation coefficient of r=0.992 (P<0.01). In conclusion, the more LIP3 aggregation at the tumour location, the better the in vivo PA imaging was.
 |
Figure 3 LIP3 bimodal imagining in vitro. (A) LIP3 CEUS imaging and grey value histogram of different groups in vitro. (B) LIP3 PA imaging and PA value scatter diagram with different concentrations in vitro. |
The above results demonstrated that LIP3 meets the theoretically expected in vitro characteristics. Then, we assessed whether the toxic effect on 4T1 cells occurred as expected. We first investigated the targeting ability. LIP3 was co-incubated with 4T1 cells and HUVECs separately and observed under CLSM. LIP3 showed red fluorescence, and 4T1 cells and HUVECs showed blue fluorescence. The HUVEC group showed no red fluorescence within 3 h, which proves that LIP3 does not target HUVECs (Figure 4A). The 4T1 cell group continuously showed red fluorescence, which demonstrated that LIP3 and the adherent 4T1 cells were bound together without being eluted by PBS. As shown in Figure 4A, they were combined and phagocytosed into the cells. The above results of CLSM were further quantitatively confirmed by FCM, As shown in Figure 4B and C. The statistical analysis of FCM is as following: the connection rate of LIP3 nanoparticles and 4T1 cells is the highest, reaching 42.9 ± 5.84%, which is statistically significant compared with the other three groups (P < 0.0001), indicating that LIP3 has a higher active targeting on 4T1 cells; the connection rate of LIP3 and HUVECs cells is the lowest, only 2.94 ± 0.97%, hardly been detected by FCM, as shown in Figure 4B, which indicates that LIP3 has the ability to distinguish 4T1 cells from HUVECs, that it has obvious active targeting to 4T1 cells, but obvious safety to normal cells. The connection rate of LIP0 with HUVECs cells and 4T1 cells has no statistical difference (P > 0.05), indicating that LIP0 has no ability to distinguish 4T1 cells from normal cells. Therefore, compared with the biosafety of LIP3, LIP0 may be a little of toxic to normal cells. In addition, there is no significant difference in the binding rate between LIP3 + HUVECs and LIP0 + HUVECs groups (P > 0.05), which is a potential evidence of liposome biosafety. It is worth mentioning that there is a statistical difference between the two groups mentioned above and LIP0 + 4T1 group (P < 0.05), indicating that liposome itself has the characteristics of targeting cancer cells. Therefore, LIP3 possesses strong active targeting to 4T1 cells and no targeting to HUVECs. Then, we examined the LIP3 cytotoxicity. To confirm the synergistic antitumour effect, we designed LIP1 with PFH and AQ4N in the core and no HMME, in contrast to the design of LIP3. Thus, no SDT will be performed on 4T1 cells. The results are as follows (Figure 4D): (1) Under normal oxygen, 4T1 cells at any LIP1 concentration exhibited a high livability, with no statistically significant difference (P>0.05). However, as the concentration increased, the livability decreased slightly. It is speculated that the higher the concentration, the worse the LIP3 stability was; furthermore, fusion rupture and a phase change occurred. Thus, AQ4N was released and produced a weak cytotoxic effect. (2) Under hypoxic conditions, there was no significant difference between the control group and any groups in normal oxygen (P>0.05). These results indicated that the presence of LIP1 and a hypoxic environment are essential for inducing the significant toxic effects on 4T1 cells. (3) Under hypoxic conditions, the toxic effects of LIP1 on 4T1 cells increased as concentrations increased, and there was a significant difference between the groups (P<0.001). In particular, in the 2.5 μg/mL and 5 μg/mL groups, the cell livability decreased exponentially, and the difference between the groups was significant (P<0.0001). The results showed that the cytotoxicity began to be prominent at an AQ4N concentration of 5 μg/mL. The most cytotoxicity was found for AQ4N at 20 μg/mL; cell livability was only 0.20±0.02. AQ4N must be reduced to AQ4 in a hypoxic environment to exert cytotoxic effects. The establishment of a hypoxic environment in the body requires SDT because ROS are produced during SDT, which exceeds the cell tolerance level, leading to oxidative stress and oxidative damage in the cell structure while consuming a large amount of oxygen and resulting in a hypoxic state. Now, only LIFU combined with HMME (contained in LIP3) generated high levels of ROS. This process digests a large amount of oxygen and increases the hypoxia in the microenvironment. The SDT effect of LIFU combined with LIP3 was confirmed. The results showed the following (Figure 4E): (1) There was no significant difference in cell livability in the no-LIFU LIP3 groups (P>0.05); no-LIFU LIP3 displayed no cytotoxicity. (2) In the no-LIFU groups, the livability slightly decreased as LIP3 concentration increased, which indicates that LIP3 exhibits little agglomeration, phase change, and release when the concentration increases. (3) Under LIFU, no LIP3 was not cytotoxic, and there was no significant difference between the no-LIFU groups (P>0.05). LIFU and LIP3 have been confirmed to be two necessary factors for SDT. (4) In the LIFU groups, cell livability was significantly different (P<0.01); the 20 μg/mL group had the lowest livability of 0.24±0.01. This result suggests that to achieve a significant effect on the tumour, HMME in LIP3 at the tumour site must reach 20 μg/mL. (5) The cell livability of LIP3 (HMME: 20 μg/mL+LIFU) and LIP1 (AQ4N: 20 μg/mL+hypoxic) was basically the same, and the AQ4N drug loading of LIP3 was less than 20% that of HMME; that is, combined with SDT, the effect of AQ4N was amplified by more than 5-fold. Meanwhile, the cytotoxicity of LIP2 on 4T1 cells was achieved, as shown in Figure 4E. In the 20 μg/mL HMME+LIFU groups (Figure 4E), LIP3 cytotoxicity was double that of LIP2 (P<0.0001). At 10 μg/mL, the cytotoxicity of LIP3 was not statistically significantly different from LIP2 (P>0.05), while the cell livability value of LIP3 was lower than that of LIP2, presumably because of the lower AQ4N contents and the small samples; at 2.5 and 5 μg/mL, the two exhibited no significant difference. The result can be explained by the result of LIP1+hypoxia; the latter antitumor effects began to emerge at an AQ4N concentration of 2.5 μg/mL and were prominent at 5 μg/mL. Accordingly, the synergistic and cascade effects of LIP3 began at HMME 12.5 μg/mL because the AQ4N loading is less than 20% of that of HMME in LIP3. This result demonstrated that LIP3 that combined SDT with AQ4N has synergistic and cascade effects. To further confirm that LIP3 +LIFU can produce high levels of ROS, a DCFH-DA kit was used to examine intracellular ROS. No green fluorescence was detected in the cells of the PBS and pure LIP3 groups, while the LIP3+LIFU group showed significant green fluorescence (Figure 4F). These images proved that LIP3+LIFU can produce ROS and therefore exert therapeutic effects on SDT.
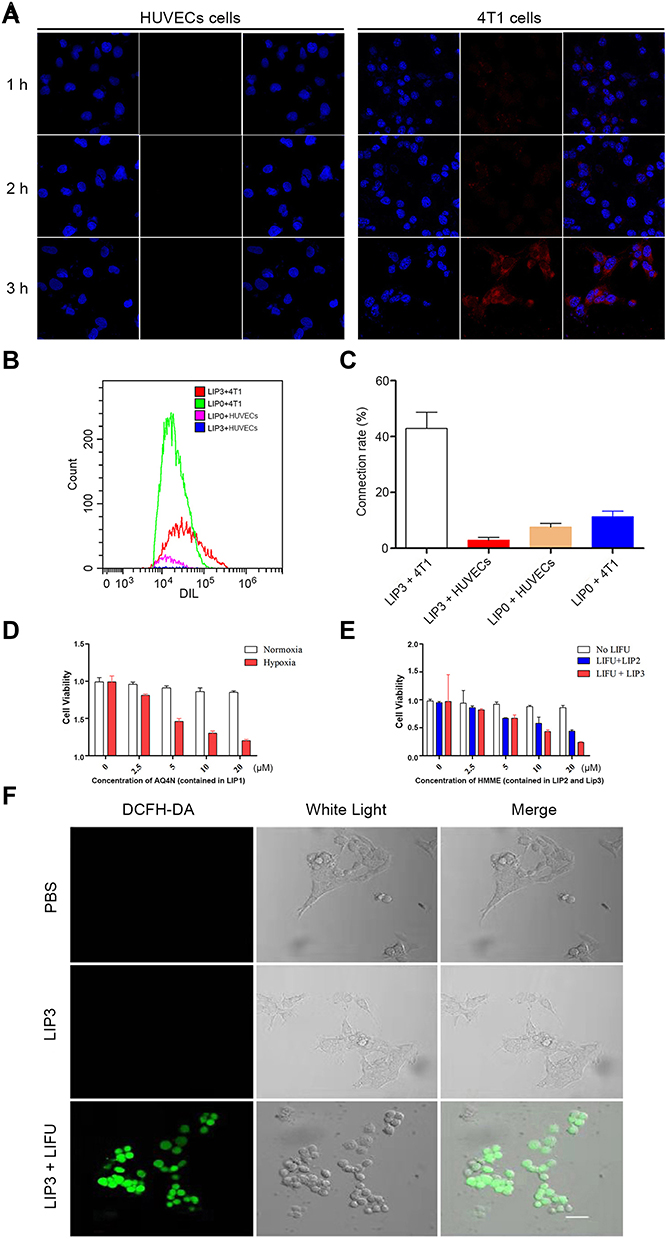 |
Figure 4 Cellular characterizations of LIP3. (A) CLSM of LIP3 targeting on HUVECs and 4T1 cells. (B) The connection between NPs and cells detected by FCM. (C) Quantitative analysis of the connection between NPs and cells in (B). (D) Cell cytotoxicity histogram of LIP1. (E) Cell cytotoxicity histogram of LIP2 and LIP3. (F) CLSM of intracellular ROS produced by LIP3. |
Finally, it is important to preliminarily observe the biosafety of LIP3 in vitro. The degree of haematolysis showed the blood compatibility of LIP3, which may verify that LIP3 has good biosafety properties in vitro. As shown in Figure 5C–F, erythrocytes with different concentrations of LIP3 did not induce any haematolysis, the same as in the negative control group (with physiological saline), shown in Figure 5B; while the positive control group (with distilled water) produced mass plasmorrhexis (in Figure 5A). The photograph in Figure 5G demonstrates that haemolytic reactions in groups with different concentrations of LIP3 had been ruled out, just as in the negative control group, because their supernatants were almost water-white liquid. The spectral data for haemoglobin (shown in Figure 5H) and the haemolysis ratio (shown in Figure 5I) in the supernatant, in the condition of including the HMME in LIP3, also substantially support the gross appearance. Thus, it may be said that LIP3 possesses the best hemocompatibility.
 |
Figure 5 Hemocompatibility of LIP3 in vitro. (A) Light microscopy image of supernatant in distilled water group (positive control). (B) Light microscopy image of supernatant in 0.9% saline group (negative control). (C) Light microscopy image of supernatant in LIP3 (5mg/5mL) group. (D) Light microscopy image of supernatant in LIP3 (2.5mg/5mL) group. (E) Light microscopy image of supernatant in LIP3 (1.25mg/5mL) group. (F) Light microscopy image of supernatant in LIP3 (0.625mg/5mL) group. (G) The supernatants were observed by digital photograph. (H) UV−vis–NIR absorbance spectra of supernatant in different groups. (I) Histogram of quantitative analysis of the hemolysis rate in every group. |
Conclusions
LIP3, a theranostic nanoplatform, was successfully constructed and conformed to the physicochemical characterization of ideal nanoparticles, with active-targeting and dual-modality imaging and with visualized drug release and precise treatment under the action of LIFU. SDT provides a favourable environment for AQ4N, resulting in amplification of LIP3 treatment. Therefore, LIP3 shows targeted aggregation and targeted release, integrating dual-mode imaging and precise cascade treatment. This unique theranostic NPS with multiple capabilities and advantages is expected to be a favourable anti-cancer method in the future.
Acknowledgments
We would like to acknowledge the financial support from the National Natural Science Foundation of China (NSFC) under Grant 81630047.
Disclosure
The authors report no conflicts of interest in this work.
References
1. Xu H, Zhang X, Han R, et al. Nanoparticles in sonodynamic therapy: state of the art review. RSC Adv. 2016;6:50697–50705. doi:10.1039/C6RA06862F
2. Fruscella M, Ponzetto A, Crema A, Carloni G. The extraordinary progress in very early cancer diagnosis and personalized therapy: the role of oncomarkers and nanotechnology. J Nanotechnol. 2016;2016:18. doi:10.1155/2016/3020361
3. Sahakyan N, Haddad A, Richardson S, et al. Personalized nanoparticles for cancer therapy: a call for greater precision. Anticancer Agents Med Chem. 2017;17:1033–1039. doi:10.2174/1871520617666170102150730
4. Yaari Z, Da Silva D, Zinger A, et al. Theranostic barcoded nanoparticles for personalized cancer medicine. Nat Commun. 2016;7:13325. doi:10.1038/ncomms13325
5. Rizzo LY, Theek B, Storm G, Kiessling F, Lammers T. Recent progress in nanomedicine: therapeutic, diagnostic and theranostic applications. Curr Opin Biotechnol. 2013;24:1159–1166. doi:10.1016/j.copbio.2013.02.020
6. Zhao H, Wu M, Zhu L, et al. Cell-penetrating peptide-modified targeted drug-loaded phase-transformation lipid nanoparticles combined with low-intensity focused ultrasound for precision theranostics against hepatocellular carcinoma. Theranostics. 2018;8:1892–1910. doi:10.7150/thno.22386
7. Wu M, Zhao H, Guo L, et al. Ultrasound-mediated nanobubble destruction (UMND) facilitates the delivery of A10-3.2 aptamer targeted and siRNA-loaded cationic nanobubbles for therapy of prostate cancer. Drug Deliv. 2018;25:226–240. doi:10.1080/10717544.2017.1422300
8. Sheng D, Liu T, Deng L, et al. Perfluorooctyl bromide & indocyanine green co-loaded nanoliposomes for enhanced multimodal imaging-guided phototherapy. Biomaterials. 2018;165:1–13. doi:10.1016/j.biomaterials.2018.02.041
9. Luo D, Carter KA, Razi A, et al. Porphyrin-phospholipid liposomes with tunable leakiness. J Control Release. 2015;220:484–494. doi:10.1016/j.jconrel.2015.11.011
10. Luo D, Li N, Carter KA, et al. Rapid light-triggered drug release in liposomes containing small amounts of unsaturated and porphyrin-phospholipids. Small. 2016;12:3039–3047. doi:10.1002/smll.201503966
11. Feng L, Gao M, Tao D, et al. Cisplatin‐prodrug‐constructed liposomes as a versatile theranostic nanoplatform for bimodal imaging guided combination cancer therapy. Adv Funct Mater. 2016;26:2207–2217. doi:10.1002/adfm.201504899
12. Beloqui A, Del Pozo-Rodríguez A, Isla A, Rodríguez-Gascón A, Solinís MÁ. Nanostructured lipid carriers as oral delivery systems for poorly soluble drugs. J Drug Deliv Sci Technol. 2017;42:144–154. doi:10.1016/j.jddst.2017.06.013
13. Witayaudom P, Klinkesorn U. Effect of surfactant concentration and solidification temperature on the characteristics and stability of nanostructured lipid carrier (NLC) prepared from rambutan (Nephelium lappaceum L.) kernel fat. J Colloid Interface Sci. 2017;505:1082–1092. doi:10.1016/j.jcis.2017.07.008
14. Singh Y, Meher JG, Raval K, et al. Nanoemulsion: concepts, development and applications in drug delivery. J Control Release. 2017;252:28–49. doi:10.1016/j.jconrel.2017.03.008
15. Matthew T. Using the Promise of Sonodynamic Therapy in the Clinical Setting against Disseminated Cancers. Chemother Res Pract. 2015;2015:1–16. doi:10.1155/2015/316015
16. Patel A, Sant S. Hypoxic tumor microenvironment: opportunities to develop targeted therapies. Biotechnol Adv. 2016;34:803–812. doi:10.1016/j.biotechadv.2016.04.005
17. Borad MJ, Reddy SG, Bahary N, et al. Randomized Phase II trial of gemcitabine plus TH-302 versus gemcitabine in patients with advanced pancreatic cancer. J Clin Oncol. 2015;33:1475–1481. doi:10.1200/JCO.2014.55.7504
 © 2020 The Author(s). This work is published and licensed by Dove Medical Press Limited. The
full terms of this license are available at https://www.dovepress.com/terms
and incorporate the Creative Commons Attribution
- Non Commercial (unported, 3.0) License.
By accessing the work you hereby accept the Terms. Non-commercial uses of the work are permitted
without any further permission from Dove Medical Press Limited, provided the work is properly
attributed. For permission for commercial use of this work, please see paragraphs 4.2 and 5 of our Terms.
© 2020 The Author(s). This work is published and licensed by Dove Medical Press Limited. The
full terms of this license are available at https://www.dovepress.com/terms
and incorporate the Creative Commons Attribution
- Non Commercial (unported, 3.0) License.
By accessing the work you hereby accept the Terms. Non-commercial uses of the work are permitted
without any further permission from Dove Medical Press Limited, provided the work is properly
attributed. For permission for commercial use of this work, please see paragraphs 4.2 and 5 of our Terms.