Back to Journals » Drug Design, Development and Therapy » Volume 20
A Brainstem-Thalamic-Cortex Glutamatergic Neuron Pathway Modulates Propofol Anesthesia
Authors Wang J, Gao J, Qin C, Dai N, Pu Q, Fu B ![]()
Received 10 September 2025
Accepted for publication 3 April 2026
Published 16 April 2026 Volume 2026:20 566561
DOI https://doi.org/10.2147/DDDT.S566561
Checked for plagiarism Yes
Review by Single anonymous peer review
Peer reviewer comments 3
Editor who approved publication: Prof. Dr. Georgios Panos
Jing Wang,1,* Jingyan Gao,1,2,* Chang Qin,1,3,* Ninan Dai,1 Qing Pu,4 Bao Fu1,4
1Department of Critical Care Medicine, Affiliated Hospital of Zunyi Medical University, Zunyi, Guizhou, People’s Republic of China; 2Intensive Care Unit, Shandong Provincial Hospital Affiliated to Shandong First Medical University, Jinan, Shandong, People’s Republic of China; 3Department of Critical Care Medicine, Xiangya Hospital of Central South University, Changsha, Hunan, People’s Republic of China; 4Key Laboratory of Anesthesia and Organ Protection of Ministry of Education (In Cultivation), Zunyi Medical University, Zunyi, Guizhou, People’s Republic of China
*These authors contributed equally to this work
Correspondence: Bao Fu, Department of Critical Care Medicine, Affiliated Hospital of Zunyi Medical University, Dalian Road 149, Zunyi, Guizhou, 563000, People’s Republic of China, Email [email protected]
Background: The precise mechanisms underlying the modulation and transformation of consciousness during propofol anesthesia remain inadequately understood. Both the paraventricular thalamus (PVT)-medial prefrontal cortex (mPFC) pathway and the parabrachial nucleus (PB) are implicated in the regulation of sleep-wake cycles. Consequently, this study aimed to explore whether projections from the PB to the PVT-mPFC pathway are involved in the effects of propofol anesthesia.
Methods: Anterograde and retrograde viral tracing techniques were employed to map the projections from the PB to the PVT and from the PVT to the mPFC. The activity within this pathway was monitored using fiber photometry during propofol anesthesia. The study further examined the role of this pathway during the induction and emergence phases of propofol anesthesia through optogenetic modulation in conjunction with cortical electroencephalography (EEG) recordings.
Results: Glutamatergic neurons in the PB exhibit dense projections to the PVT, and in turn, PVT glutamatergic neurons project densely to the mPFC. Administration of propofol resulted in a reduction of calcium signals in the parabrachial glutamatergic nucleus to paraventricular thalamus (PBGlu-PVT) pathway. Moreover, it has been observed that optogenetic activation of the PBGlu-PVT pathway significantly enhances cortical activation during propofol anesthesia, whereas optogenetic inhibition of this pathway yields the opposite effect. Additionally, optogenetic stimulation of the PVTGlu-mPFC pathway accelerates the induction of propofol anesthesia but prolongs the emergence time. Conversely, inhibition of the PVTGlu-mPFC pathway facilitates cortical activation under propofol anesthesia.
Conclusion: Collectively, this study provides supportive evidence for the involvement of a brainstem-thalamic-cortical glutamatergic circuit in propofol anesthesia. The findings offer a preliminary perspective on how propofol may modulate consciousness and highlight potential pathways worthy of further investigation.
Keywords: propofol, optogenetics, paraventricular thalamus, parabrachial nucleus, medial prefrontal cortex, glutamatergic neurons
Introduction
Propofol, an intravenous anesthetic, has been extensively utilized in clinical surgery and intensive care unit (ICU) sedation for numerous years. Despite its widespread use, the precise mechanisms underlying the modulation of consciousness during propofol anesthesia remain inadequately understood. Recent research has indicated that propofol exerts its anesthetic effects by influencing sleep-wake circuit nuclei, such as the paraventricular thalamus (PVT) and basal forebrain (BF), which are shared with general anesthesia pathways.1,2 Additionally, in terms of neural network transmission, propofol-induced loss of consciousness is closely associated with the enhancement of inhibitory synaptic transmission mediated by gamma-aminobutyric acid type A receptors (GABAAR).3–5 Nevertheless, the GABAergic mechanism alone does not fully elucidate the complex transitions of conscious states observed during propofol anesthesia.6 Emerging studies have highlighted that the activation of glutamatergic neurons in the lateral habenula can potentiate isoflurane anesthesia and augment the sedative effects of propofol.7,8 Consequently, the glutamatergic neural network may constitute an additional critical mechanism underlying the loss of consciousness induced by propofol.
Previous studies have demonstrated intricate interactions and significant synchronization between the cortex and thalamus during propofol-induced unconsciousness.9–11 However, this synchrony is not consistent between the induction and emergence phases of propofol anesthesia, with thalamocortical synchronization being anatomically dissociated during the emergence phase.12 The PVT, located in the midline thalamus beneath the medial aspect of the third ventricle, plays a crucial role in behavioral modulation, including fear modulation, arousal, and feeding.13–15 Among the thalamocortical pathways, the PVT-prefrontal cortex (PFC) pathway is functionally associated with arousal, visceral pain, and behavioral modulation.16–18 Nevertheless, its specific contribution to consciousness modulation during propofol administration remains undetermined.
The parabrachial nucleus (PB), located in the dorsolateral region of the pons and encircling the cerebellar peduncle, extends nerve fibers to multiple brain regions, including the cerebral cortex, thalamus, hypothalamus, and basal forebrain. It is integral to the regulation of various physiological functions, such as sleep-wake cycles, pain perception, feeding behavior, and sensory transmission.19,20 Prior research has indicated that the PB is implicated in the anesthetic mechanisms of propofol.21,22 Nonetheless, as an essential component of the ascending arousal system, the PB may exert influence on propofol anesthesia via its projections to the PVT and the subsequent PVT-PFC pathway. This potential mechanism remains to be elucidated. Consequently, we hypothesize the existence of a brainstem-thalamic-cortex circuit capable of modulating consciousness transitions during propofol anesthesia. To investigate this hypothesis, the present study aims to elucidate the central role of this pathway in propofol anesthesia by integrating anterograde and retrograde virus tracing techniques, optogenetic modulation, in vivo calcium signaling recordings, and electroencephalography. This approach seeks to establish a novel framework for understanding the neural loop mechanisms that underlie consciousness modulation during anesthesia.
Methods
Animals
Healthy male C57BL/6J mice, aged 8–12 weeks, weighing about 20–25g, were purchased from Hunan Slake Kingda Laboratory Animal Company of China. Healthy male Vglut2-cre mice, aged 8–12 weeks, weighing about 20–25g, were provided by Wuhan Yudu Biotechnology Company of China. They were bred in the Experimental Animal Centre of Zunyi Medical University, and the offspring were taken out at 8 weeks of age and used for experiments after genetic identification. All experiments were carried out in the Zunyi Medical University Key Laboratory of Anesthesia and Organ Protection of the Ministry of Education of Guizhou Province. Mice were allowed free access to water, food, and activities, and the animal house was maintained under a 12-hour light and 12-hour dark cycle, with temperature and humidity levels set to 23 ± 2 °C and 55 ± 5%, respectively. All male mice were randomly assigned to each experimental group. All experimental procedures complied with the regulations of the Ethics Committee of the Affiliated Hospital of Zunyi Medical University, Ethical Review No. KLLY (A)-2020-070.
Sample Size Justification
Sample sizes were justified using the Resource Equation Method (REM), targeting an E range of 10–20 to balance statistical error minimization with the 3Rs principle of reduction, with the animal treated as the independent experimental unit. For between-subject designs, E was calculated as E=N−k, where N is the total number of experimental units and k is the number of groups; for within-subject repeated-measures designs, residual degrees of freedom were calculated as (a−1)(b−1) for a one-way repeated-measures ANOVA with a animals and b conditions. In the behavioral experiments using a two-group independent design (Light-off vs. Light-on), N=12 and k=2, yielding E=10. For the arousal scores analyzed with a Friedman test, the within-subjects design included 6 animals and 3 conditions, providing residual degrees of freedom of (6−1)(3−1)=10. The calcium signal analysis, performed with one-way repeated-measures ANOVA (Greenhouse-Geisser correction), involved 9 animals and 3 conditions, giving residual degrees of freedom of (9−1)(3−1)=16. For the EEG data analyzed with Welch’s t-tests and Holm-Šídák correction, a two-group between-subjects design was used (N=12 animals, 6 per group, k=2), resulting in E=10. Across all analyses, the achieved sample sizes align with the target E-range or are supported by adequate residual degrees of freedom from the respective statistical models; repeated observations were treated as nested within animals and do not replace biological replicates.
Surgical Operation
The mice were anesthetized and sustained under isoflurane inhalation. After the loss of righting reflex (LORR), the mice were secured within a stereotactic apparatus (RWD Life Science, China). Erythromycin ointment was administered to the ocular surface and subsequently covered with cotton balls. The cranial fur was excised, and the skin was meticulously disinfected with iodophor. After the administration of a subcutaneous injection of 1% lidocaine, the skin was incised in order to fully expose both lambda and bregma points of the skull. The meninges on the surface of the mouse skull were wiped clean with hydrogen peroxide to clearly expose the cranial sutures. The skull was leveled based on the lambda and bregma points, and the corresponding nucleus positions were located using a stereotactic apparatus according to the fourth edition of the mouse brain atlas (PVT injection site: AP = −1.50 mm, ML = 0.00 mm, DV = −3.00 mm; PB injection site: AP = 5.20 mm, ML = ±1.25 mm, DV = −3.45 mm). A small perforation was made on the surface of the skull above the corresponding site. A microinjection pump (RWD Life Science, China) was used to inject the appropriate viral solution through a glass electrode (PVT: 80 nL, PB: 200 nL for each side) at a speed of 50 nL/min into the brain region (Details about the virus injected are presented in Table 1). The glass electrode was slowly withdrawn after 10 minutes. An optical fiber (Inper Ltd, Hangzhou, China, diameter: 200 μm) was inserted 0.05 mm above the injection site. Four small holes were precisely drilled at coordinates AP: +1.00 mm, ML: ±1.50 mm, and AP: −3.50 mm, ML: ±1.00 mm utilizing a cranial drill. Subsequently, four cranial screws were inserted to secure the electrodes in place. Dental cement was employed to coat the surface of the skull in order to secure the optical fiber and electrodes. Subsequent to the surgical procedure, mice were individually housed in a sanitized, temperature-controlled cage positioned on a heating pad until they fully recovered from anesthesia. During this period, the mice were closely monitored until they regained consciousness, exhibited purposeful movement, and were able to maintain sternal recumbency. For the initial 72 hours post-surgery, monitoring occurred at a minimum interval of every 12 hours. The primary parameters assessed included activity level, posture, wound appearance, and food and water intake. The mice were allowed to recover for 3 weeks for stable viral expression before subsequent experiments.
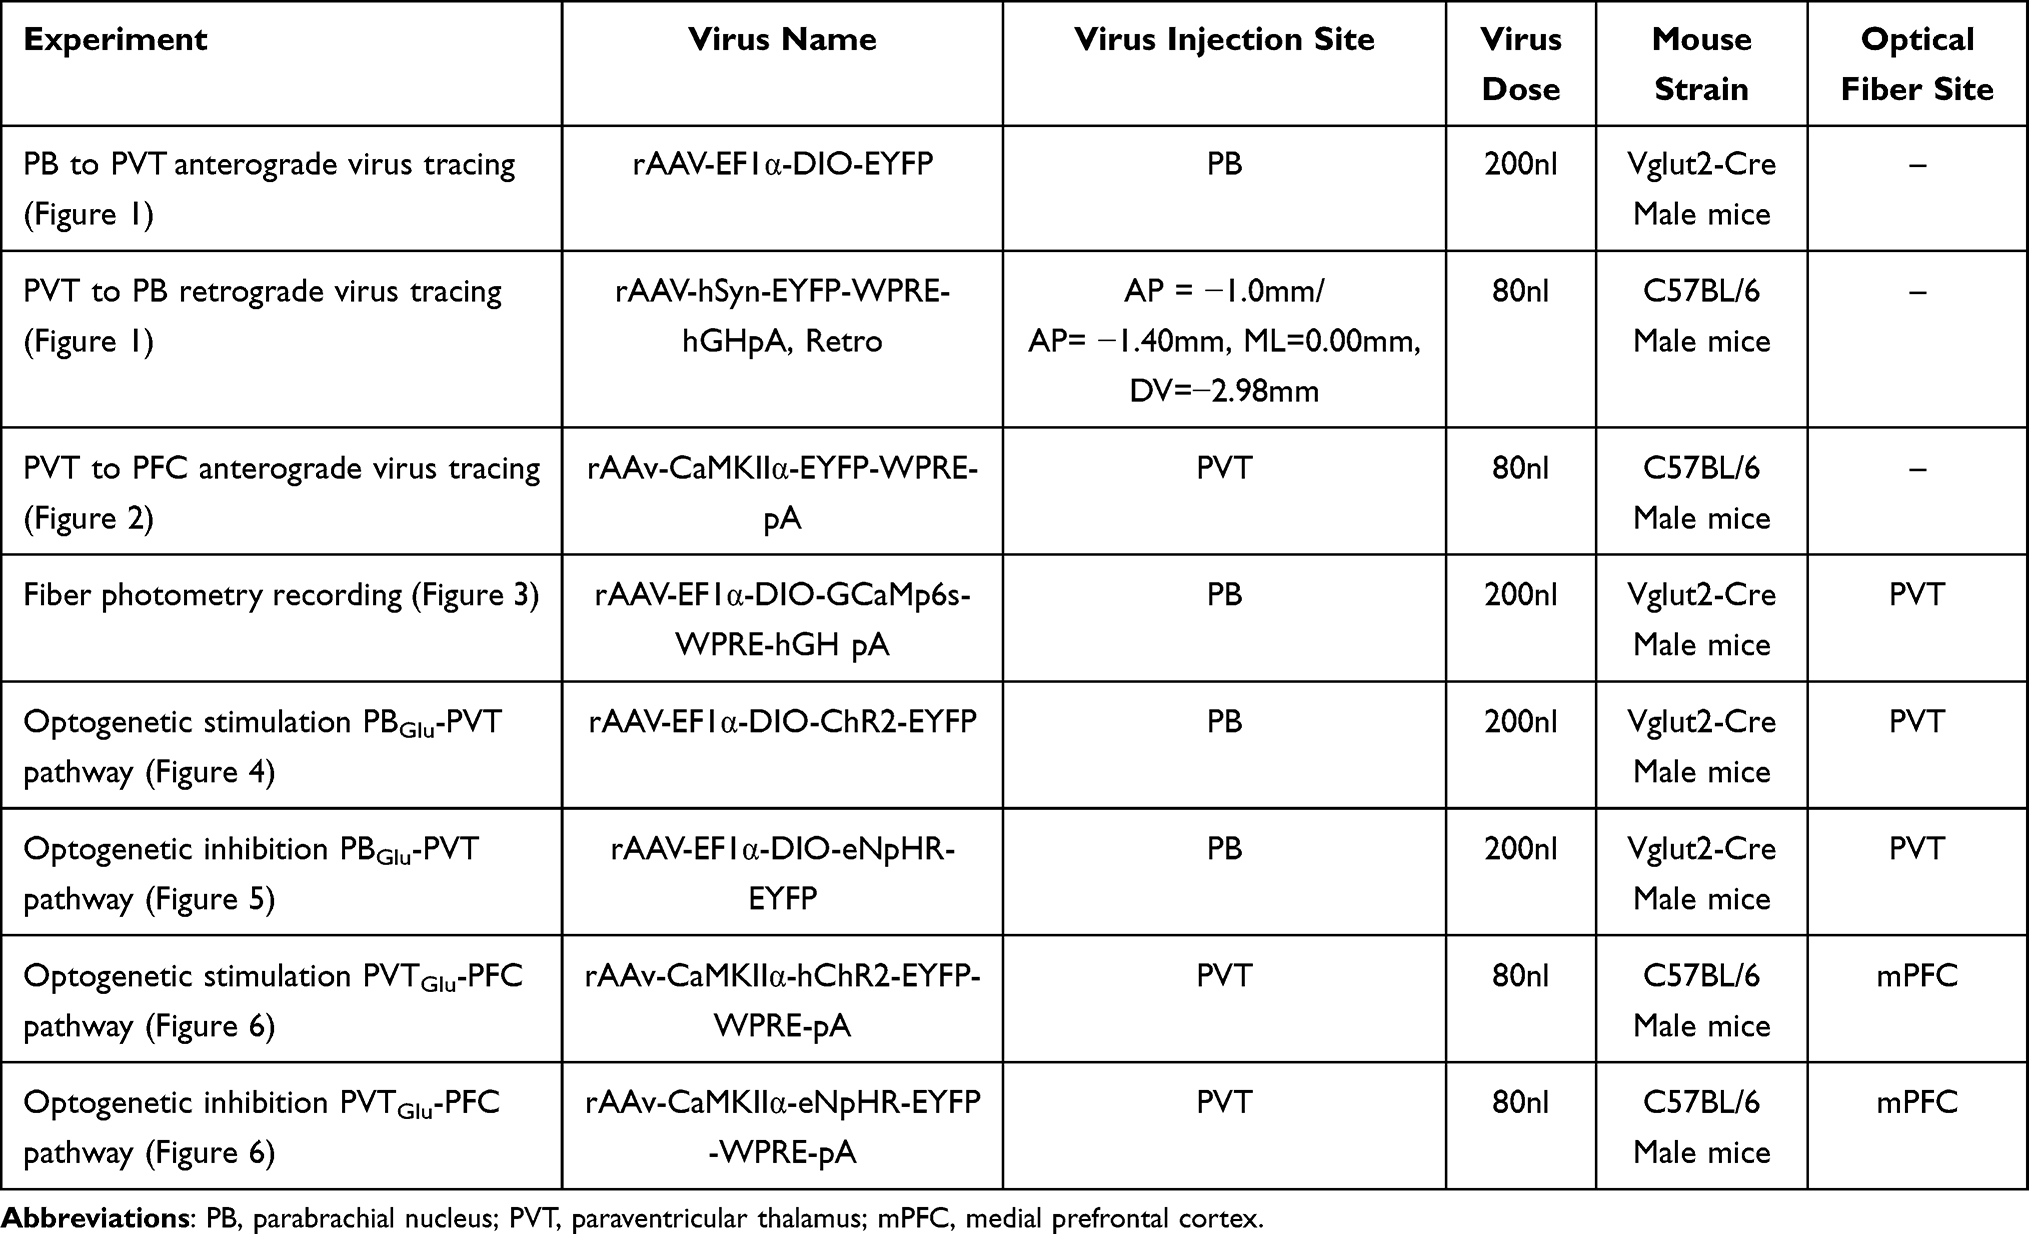 |
Table 1 Details About the Virus Injection |
 |
Figure 1 Retrograde and anterograde tracing in mice reveals that PB provides dense input to PVT. (A) Sketch of retrograde tracer virus injection strategy of C57BL/6 mice. (B) Fluorescence of in situ viral injections in PVT. (C) Retrograde EYFP fluorescence derived from PVT to PB. The white dashed box in the lower-right corner marks an enlarged view. (D) Sketch of the strategy for the injection of anterograde tracer virus of Vglut2-Cre mice. (E) Fluorescence of in situ viral injection in PB. (F) Representative image of fluorescence of nerve terminals of PB glutamatergic neurons projecting to the PVT. (G) Demonstration of the position relationship between NeuN fluorescence staining in the PVT and EYFP fluorescence from PB glutamatergic neuron projections. The white arrows pointing to PVT neurons. Scale bars: (B), 500um; (C) 500 um, bottom right, 250 um; (E and F), 500 um; (G) 125 um. |
 |
Figure 2 Anterograde tracing in mice reveals that PVT provides dense input to mPFC. (A) Sketch of the retrograde tracer virus injection strategy of C57BL/6 mice. (B) Fluorescence of in situ viral injection in PVT. (C) Representative images of fluorescence of nerve terminals of PVT glutamatergic neurons projecting to the mPFC. Scale bars: (B and C) 200 um. |
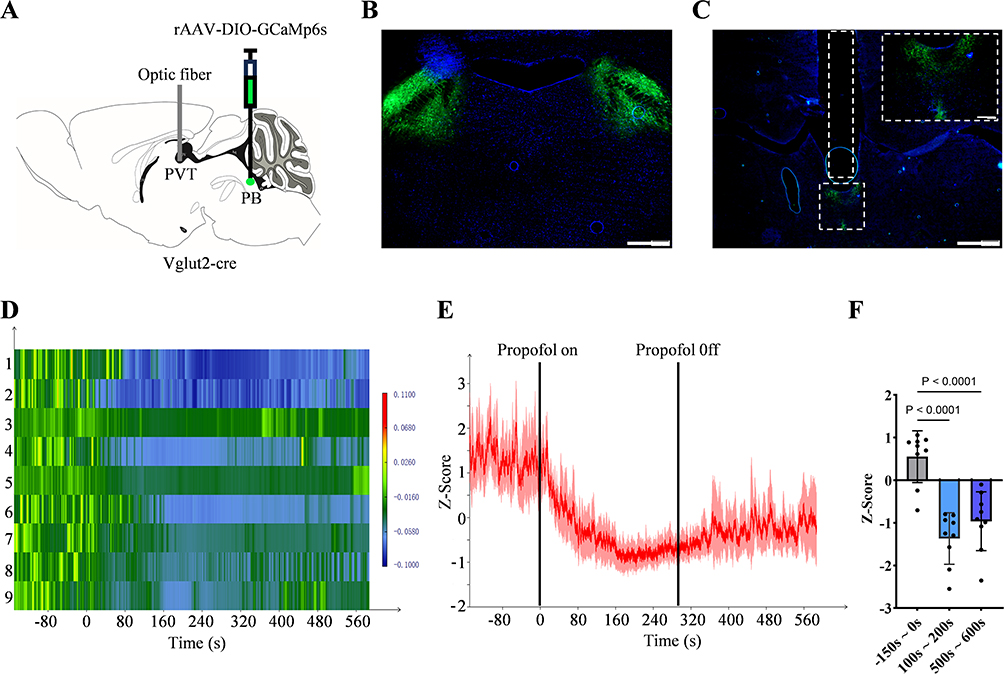 |
Figure 3 Changes in the activity of the PBGlu-PVT pathway during propofol anaesthesia. (A) Schematic diagram of virus injection and optic fibre implantation. (B) Fluorescence of in situ viral injection in PB. (C) Fluorescence of the PB nerve terminal at PVT and optic fibre position (white dashed box) is shown. The white dashed box in the top-right corner marks an enlarged view. (D) Heatmap of calcium signalling changes in the PBGlu-PVT pathway corresponding to (E). (E) Changes in calcium signalling of the PBGlu-PVT pathway under propofol anesthesia. (F) Quantification of fibre photometry signals during the three predefined epochs: pre-anesthesia (baseline, –150 s to 0 s), during anesthesia (100 s to 200 s), and post-anesthesia (500 s to 600 s). Data are presented as the average Z-score per epoch for each mouse (n = 9). One-way repeated-measures ANOVA with Greenhouse–Geisser correction followed by Tukey post hoc tests. Error bars indicate SD. Scale bars: (B) 500 um; (C) 500 um, top right, 100 um. |
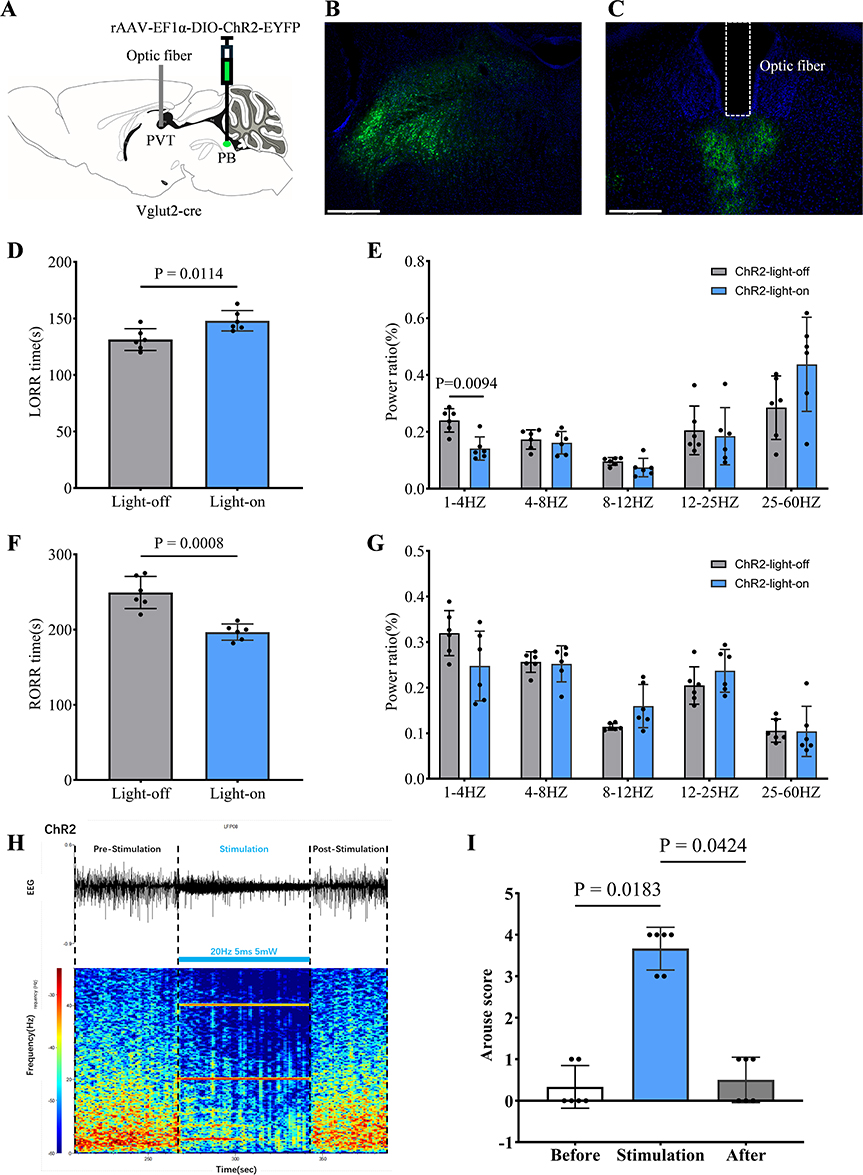 |
Figure 4 Optogenetic activation of the PBGlu-PVT pathway promotes propofol anesthesia cortical arousal. (A) Schematic diagram of virus injection and optic fibre implantation. (B) Fluorescence of in situ viral injection in PB. (C) Fluorescence of the PB nerve terminal at PVT and optic fibre position (white dashed box) is shown. (D) LORR time of ChR2-light-off and ChR2-light-on group mice, n = 6 for each group. (E) Relative EEG total power in ChR2-light-off and ChR2-light-on group mice during the induction period, n = 6 for each group. (F) RORR time of ChR2-light-off and ChR2-light-on group mice, n = 6 for each group. (G) Relative EEG total power in ChR2-light-off and ChR2-light-on group mice during the emergence period, n = 6 for each group. (H) Representative image showing EEG trace and EEG spectrograms of blue light optogenetic stimulation (473nm, 5ms, 20Hz) during propofol-induced burst suppression of deep anesthesia. (I) Statistical plot showing arousal scores before, during, and after blue light stimulation, n = 6. (E and G) Welch’s t-tests with multiple comparison correction using the Holm-Šídák method; (D and F) two-tailed unpair Welch’s t-test; (I) Dunn’s multiple comparisons test after Friedman test. Error bars indicate SD. Scale bars: (B) 500 um; (C) 500 um. |
 |
Figure 5 Optogenetic suppression of the PBGlu-PVT pathway attenuates cortical arousal during propofol anesthesia. (A) Schematic diagram of virus injection and optic fibre implantation. (B) Fluorescence of in situ viral injection in PB. (C) Fluorescence of the PB nerve terminal at PVT and optic fibre position (white dashed box) is shown. (D and E) Representative image showing EEG trace and EEG spectrograms of eNpHR-light-off and eNpHR-light-on group mouse during propofol anesthesia. The yellow transparent column represents yellow light optogenetic stimulation (589nm, 5ms, 10Hz) during the induction period and emergence period. (F) LORR time of eNpHR-light-off and eNpHR-light-on group mice, n = 6 for each group. (G) Relative EEG total power in eNpHR-light-off and eNpHR-light-on group mice during the induction period, n = 5 for each group. (H) RORR time of eNpHR-light-off and eNpHR-light-on group mice, n = 6 for each group. (I) Relative EEG total power in eNpHR-light-off and eNpHR-light-on group mice during the emergence period, n = 5 for each group. (G and I): Welch’s t-tests with multiple comparison correction using the Holm-Šídák method; (F and H) two-tailed unpair Welch’s t-test. Error bars indicate SD. Scale bars: (B) 500 um; (C) 500 um. Abbreviation: Pro, propofol. |
 |
Figure 6 Optogenetic modulation of the PVTGlu-mPFC pathway regulates propofol anesthesia. (A) Schematic diagram of virus injection and optic fibre implantation. (B) Fluorescence of in situ viral injection in PVT. (C) Fluorescence of the PVT nerve terminal at mPFC and optic fibre position (white dashed box) is shown. (D and E) Representative image showing EEG trace and EEG spectrograms of ChR2-light-off and ChR2-light-on group mouse during propofol anesthesia. The blue transparent column represents blue light optogenetic stimulation (473nm, 5ms, 10Hz) during the induction period and emergence period. (F) The left graph represents LORR time of ChR2-light-off and ChR2-light-on group mice, n = 6 for each group. The right graph represents EEG total power during the induction period, n = 12 for each group. (G) The left graph represents RORR time of ChR2-light-off and ChR2-light-on group mice, n = 6 for each group. The right graph represents EEG total power during the emergence period, n = 12 for each group. (H and I), Representative image showing EEG trace and EEG spectrograms of eNpHR-light-off and eNpHR-light-on group mouse during propofol anesthesia. The yellow transparent column represents yellow light optogenetic stimulation (589nm, 5ms, 10Hz) during the induction period and emergence period. (J) The left graph represents LORR time of eNpHR-light-off and eNpHR-light-on group mice, n = 6 for each group. The right graph represents EEG total power during the induction period, n = 6 for each group. (K) The left graph represents RORR time of eNpHR-light-off and eNpHR-light-on group mice, n = 6 for each group. The right graph represents EEG total power during the emergence period, n = 6 for each group. Right panel of (F, G, J and K): Welch’s t-tests with multiple comparison correction using the Holm-Šídák method; Left panel of (F, G, J and K): two-tailed unpair Welch’s t-test. Error bars indicate SD. Scale bars: (B and C) 500 um. Abbreviation: Pro, propofol. |
Propofol Administration and Behavioral Test
The mice were positioned in a tail vein fixator, and their tail veins were punctured with a 31G needle utilizing a mouse tail injection vein visualizer (Calvin Biotechnology, Nanjing, China). Subsequently, after being placed in an induction chamber, the mice received continuous tail vein perfusion delivered through a micro-injection pump (RWD Life Science, China).
In all experiments, the impact of general anesthesia caused by intravenous propofol (10 mg/kg/min) administered through the tail was examined using behavioral tests of the righting reflex. The loss of righting reflex (LORR) is the behavioral surrogate for loss of consciousness in rodents. Similarly, recovery of righting reflex (RORR) represents the recovery of consciousness. After commencing propofol infusion, the induction box was carefully rotated every 15 seconds to evaluate its ability to right itself. The LORR time point was defined as the moment when mice completely failed to right themselves spontaneously. The time interval from the initiation of propofol infusion to the onset of LORR was designated as the LORR time and induction analysis time window. The RORR time (emergence analysis time window) was defined as the time interval from the termination of propofol infusion to the spontaneous righting of mice (all four paws on the floor).1 By observing a stable burst of inhibitory brain wave patterns as the beginning of stopping pumping propofol, we avoided potential interference with the RORR in mice due to environmental noise, individual differences, and other factors.
Fiber Photometry Recording
After the mice had adapted to the experimental environment, the implanted optical fiber was coupled to an input cable (200 um o.d., NA: 0.37, 1.5 m length) and the laser output at the fiber tip was adjusted to 20–40 μW. A two-colour fibre optic recording device (Inper Ltd, Hangzhou, China) was utilised to record the calcium signals under propofol anesthesia in the mice. Fiber photometry data were analyzed and processed using InperDataProcess (Inper Ltd, Hangzhou, China) software. Z-score calculation: Z=[F(t)–μ]/σ. Z is the Z-score value; F(t) is the value of the original fluorescence signal; μ is the average of all the data, and σ is its standard deviation. For each mouse, three predefined epochs were selected based on the propofol administration protocol: pre-anesthesia (baseline, –150 s to 0 s), during anesthesia (100 s to 200 s), and post‑anesthesia (500 s to 600 s). Within each epoch, the Z-score values were averaged to obtain a single summary measure per mouse per epoch. A one-way repeated-measures ANOVA with Greenhouse–Geisser correction was then performed on these summary measures, with epoch as the within-subject factor and each mouse treated as an independent experimental unit. Post hoc comparisons were performed using Tukey’s test for multiple comparisons.
Optogenetic Modulation
After the mice were acclimatised, the baseline of the EEG was recorded for 5 min in the awake state. Propofol tail vein injection induced LORR while blue light (473nm, 5ms, 10 Hz, 3 to 7mW) or yellow light (589nm, 5ms, 10Hz, 3 to 7mW) optogenetic stimulation was delivered using a wired laser stimulator (Inper Ltd, Hangzhou, China). The blue light or yellow light optogenetic stimulation was stopped after the appearance of LORR. We stopped pumping propofol when stable burst suppression occurred. The blue light or yellow light optogenetic stimulation was also applied during the period when the pumping of propofol was stopped until the occurrence of RORR. To observe burst suppression during propofol-induced deep anesthesia, blue light optogenetic stimulation (473 nm, 20 Hz, 5 ms, 5 mW) was delivered one minute after the burst suppression pattern had stabilized.
EEG Recordings and Analysis
EEG recordings were time-locked to behavioral tests. The EEG recording sampling rate was 1000 Hz. The amplification of EEG signals was conducted using a Model-3000 amplifier (A-M Systems, United States), with the subsequent collection of signals being facilitated by an Apollo system (Bio-Signal Technologies, U.S.A). The data were then subjected to digitalisation and analysis using the Spike2 software (Cambridge Electronic Design, Cambridge, United Kingdom) with band-pass filtering (0.1–60 Hz). Then converted to frequency-domain data via FFT with a Hanning window to calculate the absolute power of δ (1–4 Hz), θ (4–8 Hz), α (8–12 Hz), β (12–25 Hz), and γ (25–60 Hz) bands by integrating power spectral density, followed by computation of power ratios (band power/total power ×100%).15,23 During the course of the study, the final sample size for EEG analysis differed from the initial cohort in two instances. In the EEG analysis of the part involving optogenetic inhibition of the PBGlu-PVT pathway, one mouse was excluded due to electrode failure. For the experiments involving optogenetic activation of the PVTGlu-mPFC pathway, the cohort was supplemented with an additional six mice to rule out the possibility that a lack of statistically significant findings in the EEG analysis was due to an undersized sample.
Arousal Scoring
The scoring criteria refer to previous studies:24,25 1. respiratory rate (mice with increased respiratory rate, 2 scores; no, 0 scores); 2. limb movement (limbs shaking intensely, 2 scores; limbs shaking slightly, 1 score; no, 0 scores); 3. neck movement (lifting the head for 5s, 2 scores; no, 0 scores); 4. righting (can be righted, 2 scores; no, 0 scores); 5. walking (righting the abdomen and walking off the ground, 2 scores; righting the abdomen and unable to walk off the ground, 1 score; no, 0 scores).
Fluorescent Histological Localization Validation
Fluorescent histological localization validation was performed to confirm the accuracy of viral injection sites. After the experimental recordings were completed, mice were anesthetized using isoflurane. The limbs of the mice were fixed, and the hearts of the mice were fully exposed. A vacuum centrifugal pump was used to perfuse Phosphate Buffered Saline (PBS) through the heart, which was then replaced by 4% paraformaldehyde perfusion for fixation of brain tissues. Brain tissues were stripped and stored in 4% paraformaldehyde solution for 12 h, and then replaced with 30% sucrose for dehydration. After sufficient dehydration, frozen sections were made at a thickness of 30 µm, and the brain slices were attached to slides and placed in a humidor. Slices were blocked with DAPI (4’, 6-diamidino-2-phenylindole dihydrochloride) blocking agent to ensure that the fluorescence was not quenched. Finally, a fluorescence microscope (Olympus, Japan) was used for observation, and photographs were taken.
Statistical Analysis
Statistical analysis and graphical representation were conducted with GraphPad Prism software (v9.0, GraphPad Software, Inc). Data are expressed as mean (standard deviation) [Mean (SD)]. Normality was evaluated using the Shapiro–Wilk test and Q–Q plots. Given the small sample size (n < 10), to avoid low power bias from homogeneity tests, robust variance methods (Welch’s t-test) were used for normally distributed data, treating the light-off and light-on groups as independent groups for these comparisons, while non-parametric tests were applied to non-normal data. Behavioural differences were analyzed using a two-tailed unpaired Welch’s t-test. To examine differences in EEG across multiple frequency bands, unpaired t-tests with Welch’s correction were applied, followed by Holm–Šidák correction for multiple comparisons to control Type I error. Arousal scores were analyzed using Dunn’s multiple comparisons test after the Friedman test. Fiber photometry data were assessed using one-way repeated-measures ANOVA with Greenhouse–Geisser correction, followed by Tukey post hoc tests for multiple comparisons. Statistical significance was defined as P < 0.05 (two-tailed).
Results
Neural Tracings of the PBGlu-PVT Pathway
To determine whether projections exist from PB glutamatergic neurons to the PVT, we employed retrograde neural tracing combined with a Cre-dependent anterograde tracing strategy. A retrograde tracing virus with the broad-spectrum promoter hSyn was injected into the PVT of C57BL/6J mice (Figure 1A and B). Due to the substantial size of the PVT, viral injections were delivered at two stereotaxic coordinates (1.0 mm and 1.4 mm posterior to bregma) to ensure comprehensive coverage of the nucleus. Abundant green fluorescence was observed retrogradely labeled in the neuronal cytosol within the PB, predominantly in its lateral division (Figure 1C).
To further validate this projection, a Cre-dependent anterograde tracing virus was injected into the PB of Vglut2-cre mice (Figure 1D and E). The results show dense nerve terminal fluorescence in the PVT (Figure 1F). Immunofluorescence staining with the NeuN antigen in the PVT revealed green fluorescent nerve terminals densely surrounding red fluorescent neurons, further supporting the presence of neural projections from PB glutamatergic neurons to the PVT (Figure 1G). These findings collectively indicate that PB glutamatergic neurons have extensive projections to the PVT.
Neural Tracing of the PVTGlu-mPFC Pathway
To verify the projection of PVT glutamatergic neurons to the mPFC, anterograde tracer viruses were injected into the PVT (Figure 2A and B). As a result, dense EYFP fluorescence of the nerve terminals of PVT glutamatergic neurons was found in the mPFC. At the same time, fewer projections can be seen in the dorsolateral orbital cortex (DLO) (Figure 2C).
The PBGlu-PVT Pathway is Involved in Propofol Anesthesia
To determine the involvement of the PBGlu-PVT pathway in propofol anesthesia, we injected rAAV-EF1-DIO-GCaMP6s-WPRE-pA into the PB of Vglut2-cre mice and implanted an optical fiber in the PVT (Figures 3A–C). After a 4-week recovery, in vivo fiber photometry recording was employed to record calcium signals of PBGlu-PVT pathway under propofol anesthesia. Following propofol infusion, a significant decrease in calcium signaling was observed in the PBGlu-PVT neurons. Furthermore, this inhibitory state persisted for some time after the discontinuation of propofol anesthesia. These dynamic changes were also visually represented in the corresponding heatmaps (Figure 3D–F). These preliminary results suggest that the PBGlu-PVT pathway may be involved in modulating propofol anesthesia.
Optogenetic Activation of the PBGlu-PVT Pathway Promotes Cortical Arousal During Propofol Anesthesia
In order to explore the regulatory function of the PBGlu-PVT pathway during propofol anesthesia, we bilaterally injected an adeno-associated virus (rAAV-EF1α–DIO–ChR2–EYFP) encoding the light-sensitive protein Channelrhodopsin-2 (ChR2) into the PB of Vglut2-cre mice and implanted an optical fiber in the PVT (Figure 4A–C). Experiments were conducted 4 weeks post-viral transduction. Behavioral changes and EEG recordings were assessed during continuous propofol infusion. Compared to the ChR2-light-off control group, optogenetic activation (ChR2-light-on) significantly prolonged the time to LORR during the induction period [148 (8.99) s vs. 131.33 (9.65) s; n = 6; P = 0.0114; Figure 4D]. EEG analysis revealed that during LORR, optogenetic activation decreased the power of δ wave (1–4 Hz) (P = 0.0094; Figure 4E). Conversely, activation shortened the time to RORR following propofol cessation [196.67 (10.8) s vs. 249.33 (21.35) s; n = 6; P = 0.0008; Figure 4F]. However, no significant difference was observed in EEG activity during RORR.
To assess burst suppression during deep anesthesia, one minute of blue light stimulation was delivered after the burst suppression waveform had stabilised for one minute. The EEG traces and spectrograms showed that burst suppression was significantly reduced and recovered after stimulation ceased (Figure 4H). Video recordings of the behavioural changes of mice in the deep anesthesia stage were made for one minute each before, during, and after the blue light stimulation. These were then scored. The final score was calculated, with a maximum score of 10. During activation, scores increased significantly compared to before [stimulation: 3.67 (0.52) vs. before: 0.33 (0.52), n = 6, P = 0.0183, Figure 4I], suggesting behavioural arousal in mice. Cessation of stimulation resulted in a decline in scores [after: 0.5 (0.55) vs. stimulation: 3.67 (0.52), n = 6, P = 0.0424, Figure 4I], suggesting that arousal behaviours disappeared. As can be seen from the scores, arousal behaviour was mainly focused on changes in respiratory rate and limb movement. This partially demonstrates that activation of the PBGlu-PVT pathway promotes cortical arousal during propofol anaesthesia.
Optogenetic Suppression of the PBGlu-PVT Pathway Attenuates Cortical Arousal During Propofol Anesthesia
A further exploration was conducted to ascertain the effects of the inhibition of the PBGlu-PVT pathway on behavioural and cortical EEG in mice during propofol anesthesia. The injection of rAAV-EF1α-DIO-eNpHR-EYFP viruses was conducted into the PB of Vglut2-cre mice, with the fibre optics subsequently placed at the PVT (Figures 5A–C).
Analysis of EEG spectrograms during the induction and emergence phase showed that compared with the eNpHR-light-off group, the eNpHR-light-on group had increased power density in the low-frequency band (Figures 5D and E). The findings demonstrated that, in comparison with the eNpHR-light-off group, the LORR time was significantly reduced in the eNpHR-light-on group during induction [101.3 (16.95) s vs. 135 (11.68) s, n = 6, P = 0.0032; Figure 5F], and EEG analysis revealed increased δ (1–4 Hz) power during LORR (P = 0.0064, Figure 5G). The RORR time was prolonged in the eNpHR-light-on group during emergence [420.5 (123.9) s vs. 251.5 (44.55) s, n = 6, P = 0.0188; Figure 5H]. And we observed elevated δ (1–4 Hz) power and θ (4–8 Hz) power, alongside reduced β (8–12 Hz) and γ (25–60 Hz) power (P = 0.0104, P = 0.0336, and P = 0.0212, P = 0.0104 respectively; Figure 5I). These findings suggest that suppressing the PBGlu-PVT pathway inhibits cortical arousal during propofol anesthesia.
Optogenetic Activation of the PVTGlu-mPFC Pathway Suppresses Behavioral Arousal During Propofol Anesthesia
Building upon the established role of the PBGlu-PVT pathway in regulating consciousness transitions during propofol anesthesia, this study further investigated the contribution of the PVTGlu-mPFC pathway. Wild-type mice received viral injections (rAAv-CaMKIIα-hChR2-EYFP-WPRE-pA) into the PVT and optic fiber implantation targeting the mPFC (Figures 6A–C), followed by EEG electrode placement.
Analysis of EEG spectrograms during the induction phase showed that compared with the ChR2-light-off group, the ChR2-light-on group had increased power density in the low-frequency band and a slight decrease in power in the high-frequency band. Observation of EEG spectrograms during the recovery phase revealed that the low-frequency band power density of the ChR2-light-on group was slightly higher than that of the ChR2-light-off group (Figure 6D and E).
During anesthesia induction, optogenetic activation of PVTGlu-mPFC neurons significantly shortened the LORR time [122.3 (9.730) s vs. 168.0 (8.764) s, n = 6, P < 0.0001; Figure 6F]. Analysis of frequency band power indicated an increase in δ wave (1–4 Hz) power and a decrease in γ wave (25–60 Hz) power; however, these changes did not reach statistical significance (P > 0.05) (Figure 6F). During the emergence phase, optogenetic activation of PVTGlu-mPFC neurons prolonged the recovery time [434.7 (52.51) s vs. 358.0 (47.43) s, n = 6, P = 0.0241; Figure 6G]. There was no significant change in high-frequency band power; the power of low-frequency δ waves (1–4 Hz) increased slightly, but this difference was also not statistically significant (P > 0.05) (Figure 6G). These findings indicate that optogenetic activation of the PVTGlu-mPFC pathway suppressed behavioral arousal during the induction and recovery phase of propofol anesthesia.
Optogenetic Inhibition of the PVTGlu-mPFC Pathway Promotes Cortical Arousal During Propofol Anesthesia
To further investigate the effects of inhibiting the PVTGlu-mPFC pathway on behavioral and cortical EEG responses during propofol anesthesia, wild-type mice underwent viral injection into the PVT (rAAV-CaMKIIα-eNpHR-EYFP-WPRE-pA) and optical fiber implantation targeting the mPFC (Figures 6A–C). Analysis of EEG spectrograms showed that during the anesthesia induction phase, compared with the eNpHR-light-off group, the eNpHR-light-on group had lower power density in the low-frequency band; in the late induction phase, however, the power density of its high-frequency band increased. During the anesthesia emergence phase, the low-frequency band power density of the eNpHR-light-on group was significantly lower than that of the eNpHR-light-off group (Figure 6H and I).
Compared with the eNpHR-light-off group, the eNpHR-light-on group had a significantly shorter LORR time during the induction phase [159.5 (14.60) s vs. 247.3 (24.59) s, n = 6, P < 0.0001; Figure 6J]. Simultaneous EEG recordings revealed that during the LORR period, inhibition of the PVTGlu-mPFC pathway resulted in a decrease in the power of low-frequency δ waves (1–4 Hz) and an increase in the power of high-frequency β waves (12–25 Hz) and γ waves (25–60 Hz) (P < 0.0006, P = 0.0045, P = 0.026, respectively; Figure 6J). During the emergence phase, the RORR time was prolonged [530.7 (80.48) s vs. 233.2 (37.06) s, n = 6, P < 0.0001; Figure 6K]. EEG analysis during the RORR period similarly showed a significant decrease in the power of δ waves (1–4 Hz) (P = 0.0453, Figure 6K). These results suggest that optogenetic inhibition of the PVTGlu-mPFC pathway promotes cortical arousal during both induction and emergence from propofol anesthesia, indicating an important role of the PVTGlu-mPFC pathway in regulating the consciousness transitions for propofol anaesthesia.
Discussion
In this study, we explored the potential role of the PB-PVT-PFC circuit and its glutamatergic components under propofol anesthesia. Initially, viral tracing and in vivo fiber photometry recording revealed the presence of neural pathways linking the PB to the PVT, as well as the PVT to the mPFC, and suggested that this neural circuit may be involved in propofol anesthesia. Subsequently, through bidirectional optogenetic modulation of this pathway, it was indicated that activation of the PBGlu-PVT pathway enhances cortical arousal during propofol anesthesia, whereas its inhibition yields the opposite effect. Conversely, optogenetic stimulation of the PVTGlu-mPFC pathway was found to suppress cortical arousal, while inhibition of the PBGlu-PVT pathway seemed to facilitate cortical arousal during propofol anesthesia. This study thus elucidates the role of a glutamatergic neural pathway extending from the brainstem through the thalamus to the cortex in the anesthetic process of propofol.
Previous research has identified increased δ wave power and suppressed high-frequency wave activity as characteristic EEG spectral features during anesthesia.26,27 Our findings corroborate these observations, demonstrating that inhibition of the PBGlu-PVT pathway increases δ and θ wave power while decreasing β and γ wave power, thereby suppressing cortical arousal. Conversely, activation of the PBGlu-PVT pathway and inhibition of the PVTGlu-mPFC pathway resulted in reduced δ wave power, enhanced high-frequency wave power, and promoted cortical arousal.
The prevailing consensus suggests that the disruption of dynamic stability in neural activity across different brain regions constitutes a fundamental neural mechanism underlying the loss of consciousness during anesthesia.12,27,28 Moreover, research suggests that the onset of burst suppression on the EEG serves as a reliable marker for determining whether experimental subjects have entered a state of unconsciousness or deep anesthesia.29,30 Although our EEG recordings confirmed that mice achieved a stable burst suppression state during the experiment, optogenetic stimulation of the PVTGlu-mPFC pathway suppressed behavioral awakening during propofol anesthesia, without accompanying changes in cortical EEG activity. This discrepancy between cortical arousal and behavioral awakening levels may indicate a disruption in neural dynamic stability. Another plausible explanation is that activation of this specific pathway inhibits behavioral responsiveness without directly interfering with the core mechanisms underlying propofol anesthesia. However, in the current research on general anesthesia mechanisms, relying solely on the righting reflex as a behavioral assessment is insufficient. Additional behavioral tests, such as the auditory startle response and tactile stimulation, should be incorporated to more accurately evaluate the state of consciousness in mice.
In light of recent studies on propofol-induced transitions of consciousness, the prevailing perspective predominantly emphasizes the role of inhibitory synaptic transmission mediated by GABAA receptors and their subsequent effects on other neurons, including glutamatergic neurons. For example, propofol reduces glutamatergic neuron excitability through GABAA receptors, enhancing anesthesia.3,31–33 It also acts on GABAergic neurons in the ventrolateral preoptic area and indirectly on glutamatergic afferents to increase glutamate release, producing sedation.34 However, activating GABAergic neurons in the ventral pallidum and hypothalamic tuberomammillary nucleus can weaken propofol’s anesthetic effect.35,36 This indicates that its action is not solely due to the GABAergic system. Propofol influences various brain regions and neurotransmitter interactions.37–39 By specifically focusing on glutamatergic neurons, our research contributes to expanding the scope of investigation into the effect of the glutamate system on propofol anesthesia mechanisms.
Under propofol anesthesia, phosphorylation of ionotropic glutamate receptors in the frontal cortex decreases, inhibiting normal glutamatergic synaptic transmission.40 However, Gao-Lin Qiu et al found that mPFC glutamate levels increase dose-dependently during propofol anesthesia.41 Propofol also affects NMDA and AMPA receptor subunit phosphorylation in hippocampal neurons,42,43 suggesting that glutamatergic transmission inhibition might be due to indirect modulation of these receptors. It is unclear if the rise in mPFC glutamate levels is partly due to increased PVT input. Our study showed that optogenetic stimulation of the PVTGlu-mPFC pathway delayed anesthetic awakening in mice, indicating that high PFC glutamate levels might contribute to the delayed awakening caused by high propofol doses. Additionally, activating the PBGlu-PVT and PVTGlu-mPFC pathways had opposite effects. This suggests that axonal terminals from the PB likely connect with local inhibitory interneurons in the PVT, rather than directly with PVT-PFC glutamatergic projection neurons. These inhibitory neurons then suppress the PVT-PFC projection neurons, explaining our behavioral observations. Therefore, the mechanism by which PB glutamatergic neurons indirectly modulate the PFC by driving local inhibition in the PVT provides a compelling interpretation of our findings. However, the involvement of glutamatergic neural pathways in propofol anesthesia is certain, and their function cannot be ignored.
The anesthetic state induced by propofol is likely a result of its concurrent action on various receptor systems across different brain regions, collectively mediating effects such as unconsciousness and immobility. For example, continuous infusion of propofol enhances the activation of GABAergic neurons in the pre-Bötzinger complex (PrBo), a core component of the respiratory rhythmogenesis nucleus, leading to respiratory inhibition.44 Additionally, propofol may contribute to cerebellar dysfunction through its interaction with NMDA receptors.45 Specifically, the lateral PB and the Kölliker-Fuse nucleus (KF) play crucial roles in the regulation of respiration.46 Experimental evidence shows that the administration of NBQX (an AMPA receptor antagonist) and AP5 (an NMDA receptor antagonist) into the PB and KF, respectively, results in a decreased respiratory rate, with this effect persisting even when the order of drug administration is altered.47 Although the critical roles of the Bötzinger and KF complexes in respiratory regulation have been characterized, current data are insufficient to precisely identify the specific neuronal subtypes within these nuclei that are primarily responsible for mediating the respiratory depression associated with propofol anesthesia. To accurately identify the specific neurons involved in this process, future research could employ a robust methodology that integrates TRAP technology with immunofluorescent co-staining. However, the absence of detailed recordings of respiratory, circulatory, and other physiological parameters in mice during propofol anesthesia in this experiment precludes further investigation into whether modulation of the PB-PVT pathway may influence both the state of consciousness and respiratory drive. Moreover, the potential role of sex differences in regulating anesthesia via this pathway merits further exploration.
Conclusion
This study contributes a systematic analysis of the dynamic integration of the PB-PVT-mPFC loop in propofol anesthesia, complementing existing research that predominantly focuses on individual brain regions. These preliminary findings may offer novel insights and inform potential therapeutic strategies for addressing delayed recovery of consciousness following propofol anesthesia.
Funding
This study was supported by the National Natural Science Foundation of China (Grant No. 8206050737).
Disclosure
The authors report no conflicts of interest in this work.
References
1. Wang YL, Wang L, Xu W, et al. Paraventricular thalamus controls consciousness transitions during propofol anaesthesia in mice. Br J Anaesth. 2023;130(6):698–16. doi:10.1016/j.bja.2023.01.016
2. Cai S, Tang A, Luo T, et al. Effect of basal forebrain somatostatin and parvalbumin neurons in propofol and isoflurane anesthesia. CNS Neurosci Ther. 2021;27(7):792–804. doi:10.1111/cns.13635
3. Chen L, Lai YZ, Cheng J, et al. Propofol decreases the excitability of cholinergic neurons in mouse basal forebrain via GABAA receptors. Acta Pharmacol Sin. 2019;40(6):755–761. doi:10.1038/s41401-018-0168-6
4. Bai D, Pennefather PS, MacDonald JF, Orser BA. The general anesthetic propofol slows deactivation and desensitization of GABA(A) receptors. J Neurosci. 1999;19(24):10635–10646. doi:10.1523/JNEUROSCI.19-24-10635.1999
5. Hemmings HC, Riegelhaupt PM, Kelz MB, et al. Towards a comprehensive understanding of anesthetic mechanisms of action: a decade of discovery. Trends Pharmacol Sci. 2019;40(7):464–481. doi:10.1016/j.tips.2019.05.001
6. Philip AB, Brohan J, Goudra B. The role of GABA receptors in anesthesia and sedation: an updated review. CNS Drugs. 2025;39(1):39–54. doi:10.1007/s40263-024-01128-6
7. Gelegen C, Miracca G, Ran MZ, et al. Excitatory pathways from the lateral Habenula enable propofol-induced sedation. Curr Biol. 2018;28(4):580–587.e5. doi:10.1016/j.cub.2017.12.050
8. Liu C, Liu J, Zhou L, et al. Lateral Habenula glutamatergic neurons modulate isoflurane anesthesia in mice. Front Mol Neurosci. 2021;14:628996. doi:10.3389/fnmol.2021.628996
9. Bastos AM, Donoghue JA, Brincat SL, et al. Neural effects of propofol-induced unconsciousness and its reversal using thalamic stimulation. eLife. 2021;10:e60824. doi:10.7554/eLife.60824
10. Wu T, Grandjean J, Bosshard SC, Rudin M, Reutens D, Jiang T. Altered regional connectivity reflecting effects of different anaesthesia protocols in the mouse brain. Neuroimage. 2017;149:190–199. doi:10.1016/j.neuroimage.2017.01.074
11. Chen X, Cramer SR, Chan DCY, Han X, Zhang N. Sequential deactivation across the thalamus-hippocampus-mPFC pathway during loss of consciousness. bioRxiv. 2024;2024:1. doi:10.1101/2024.05.20.594986
12. Flores FJ, Hartnack KE, Fath AB, et al. Thalamocortical synchronization during induction and emergence from propofol-induced unconsciousness. Proc Natl Acad Sci U S A. 2017;114(32):E6660–E6668. doi:10.1073/pnas.1700148114
13. Penzo MA, Robert V, Tucciarone J, et al. The paraventricular thalamus controls a central amygdala fear circuit. Nature. 2015;519(7544):455–459. doi:10.1038/nature13978
14. Kirouac GJ. Placing the paraventricular nucleus of the thalamus within the brain circuits that control behavior. Neurosci Biobehav Rev. 2015;56:315–329. doi:10.1016/j.neubiorev.2015.08.005
15. Ren S, Wang Y, Yue F, et al. The paraventricular thalamus is a critical thalamic area for wakefulness. Science. 2018;362(6413):429–434. doi:10.1126/science.aat2512
16. Jurik A, Auffenberg E, Klein S, et al. Roles of prefrontal cortex and paraventricular thalamus in affective and mechanical components of visceral nociception. Pain. 2015;156(12):2479–2491. doi:10.1097/j.pain.0000000000000318
17. Liang HY, Chen ZJ, Xiao H, et al. nNOS-expressing neurons in the vmPFC transform pPVT-derived chronic pain signals into anxiety behaviors. Nat Commun. 2020;11(1):2501. doi:10.1038/s41467-020-16198-5
18. Gao C, Leng Y, Ma J, et al. Two genetically, anatomically and functionally distinct cell types segregate across anteroposterior axis of paraventricular thalamus. Nat Neurosci. 2020;23(2):217–228. doi:10.1038/s41593-019-0572-3
19. Qiu MH, Chen MC, Fuller PM, Lu J. Stimulation of the pontine parabrachial nucleus promotes wakefulness via extra-thalamic forebrain circuit nodes. Curr Biol. 2016;26(17):2301–2312. doi:10.1016/j.cub.2016.07.054
20. Li YA, Yao J, Li X, Hu KH. Arousal-promoting effect of the parabrachial nucleus and the underlying mechanisms: recent advances. Prog Neuropsychopharmacol Biol Psychiatry. 2025;136:111226. doi:10.1016/j.pnpbp.2024.111226
21. Zhang Q, Ke J, Cui G, et al. The neural ensembles activated by propofol and isoflurane anesthesia across the whole mouse brain. Neurosci Lett. 2025;846:138080. doi:10.1016/j.neulet.2024.138080
22. Luo T, Yu S, Cai S, et al. Parabrachial neurons promote behavior and electroencephalographic arousal from general anesthesia. Front Mol Neurosci. 2018;11:420. doi:10.3389/fnmol.2018.00420
23. Bu X, Chen Y, Lv P, Fu X, Fu B. Glutamatergic neurons in paraventricular nucleus of the thalamus regulate the recovery from isoflurane anesthesia. BMC Anesthesiol. 2022;22(1):256. doi:10.1186/s12871-022-01799-y
24. Reed SJ, Plourde G, Tobin S, Chapman CA. Partial antagonism of propofol anaesthesia by physostigmine in rats is associated with potentiation of fast (80-200 Hz) oscillations in the thalamus. Br J Anaesth. 2013;110(4):646–653. doi:10.1093/bja/aes432
25. Taylor NE, Van Dort CJ, Kenny JD, et al. Optogenetic activation of dopamine neurons in the ventral tegmental area induces reanimation from general anesthesia. Proc Natl Acad Sci U S A. 2016;113(45):12826–12831. doi:10.1073/pnas.1614340113
26. Pal D, Hambrecht-Wiedbusch VS, Silverstein BH, Mashour GA. Electroencephalographic coherence and cortical acetylcholine during ketamine-induced unconsciousness. Br J Anaesth. 2015;114(6):979–989. doi:10.1093/bja/aev095
27. Eisen AJ, Kozachkov L, Bastos AM, et al. Propofol anesthesia destabilizes neural dynamics across cortex. Neuron. 2024;112(16):2799–2813.e9. doi:10.1016/j.neuron.2024.06.011
28. Varley TF, Sporns O, Puce A, Beggs J. Differential effects of propofol and ketamine on critical brain dynamics. PLOS Comput Biol. 2020;16(12):e1008418. doi:10.1371/journal.pcbi.1008418
29. Yi T, Wang N, Huang J, et al. A sleep-specific midbrain target for Sevoflurane anesthesia. Adv Sci. 2023;10(15):2300189. doi:10.1002/advs.202300189
30. Bao WW, Xu W, Pan GJ, et al. Nucleus accumbens neurons expressing dopamine D1 receptors modulate states of consciousness in sevoflurane anesthesia. Curr Biol CB. 2021;31(9):1893–1902.e5. doi:10.1016/j.cub.2021.02.011
31. hua FC, Du XN, Wang Z, Wu T, Zhang LN. The activity of cholinergic neurons in the basal forebrain interferes with anesthesia-arousal process of propofol. Neuropeptides. 2024;107:102449. doi:10.1016/j.npep.2024.102449
32. Li Y, Chen L, Zhu D, Chen Y, Qin W, Cui J. Propofol downregulates the activity of glutamatergic neurons in the basal forebrain via affecting intrinsic membrane properties and postsynaptic GABAARs. Neuroreport. 2020;31(17):1242–1248. doi:10.1097/WNR.0000000000001540
33. Huang Y, Xiao Y, Li L, Feng X, Ding W, Cai F. Propofol-induced anesthesia involves the direct inhibition of glutamatergic neurons in the lateral hypothalamus. Front Neurosci. 2024;18:1327293. doi:10.3389/fnins.2024.1327293
34. Li KY, Zhong GY, Krnjević K, Ye JH. Propofol facilitates glutamatergic transmission to neurons of the ventrolateral preoptic nucleus. Anesthesiology. 2009;111(6):1271–1278. doi:10.1097/ALN.0b013e3181bf1d79
35. Zhou Y, Dong W, Qiu YK, et al. Regulating the activity of GABAergic neurons in the ventral pallidum alters the general anesthesia effect of propofol. Neuropharmacology. 2024;257:110032. doi:10.1016/j.neuropharm.2024.110032
36. Liu J, Liu X, Zhou WY, et al. The activation of GABAergic neurons in the hypothalamic tuberomammillary nucleus attenuates sevoflurane and propofol-induced anesthesia in mice. Front Pharmacol. 2023;14:1153735. doi:10.3389/fphar.2023.1153735
37. Zhang Y, Fu B, Liu C, et al. Activation of noradrenergic terminals in the reticular thalamus delays arousal from propofol anesthesia in mice. FASEB J. 2019;33(6):7252–7260. doi:10.1096/fj.201802164RR
38. Li K, Zhou Y, Fu B. Dopaminergic D1 receptors in the nucleus basalis modulate recovery from propofol anesthesia in rats. Iran J Basic Med Sci. 2019;23(Online First):298–302. doi:10.22038/IJBMS.2019.37716.8962
39. Guo M, Wang J, Yuan Y, et al. Role of adenosine A2A receptors in the loss of consciousness induced by propofol anesthesia. J Neurochem. 2023;164(5):684–699. doi:10.1111/jnc.15734
40. Snyder G, Galdi S, Hendrick J, Hemmingsjr H. General anesthetics selectively modulate glutamatergic and dopaminergic signaling via site-specific phosphorylation in vivo. Neuropharmacology. 2007;53(5):619–630. doi:10.1016/j.neuropharm.2007.07.008
41. Qiu GL, Peng LJ, Wang P, et al. In vivo imaging reveals a synchronized correlation among neurotransmitter dynamics during propofol and sevoflurane anesthesia. Zool Res. 2024;45(3):679–690. doi:10.24272/j.issn.2095-8137.2023.302
42. Mao LM, Hastings JM, Fibuch EE, Wang JQ. Propofol selectively alters GluA1 AMPA receptor phosphorylation in the hippocampus but not prefrontal cortex in young and aged mice. Eur J Pharmacol. 2014;738:237–244. doi:10.1016/j.ejphar.2014.05.053
43. Kozinn J, Mao L, Arora A, Yang L, Fibuch EE, Wang JQ. Inhibition of glutamatergic activation of extracellular signal-regulated protein kinases in hippocampal neurons by the intravenous anesthetic propofol. Anesthesiology. 2006;105(6):1182–1191. doi:10.1097/00000542-200612000-00018
44. Jiang J, Jiao Y, Gao P, et al. Propofol differentially induces unconsciousness and respiratory depression through distinct interactions between GABAA receptor and GABAergic neuron in corresponding nuclei. Acta Biochim Biophys Sin. 2021;53(8):1076–1087. doi:10.1093/abbs/gmab084
45. Zhang XY, Zhang YD, Cui BR, et al. Propofol facilitates climbing fiber-Purkinje cell synaptic transmission via NMDA receptor in vitro in mice. Eur J Pharmacol. 2020;887:173474. doi:10.1016/j.ejphar.2020.173474
46. Dutschmann M, Dick TE. Pontine mechanisms of respiratory control. Compr Physiol. 2012;2(4):2443–2469. doi:10.1002/cphy.c100015
47. Navarrete-Opazo AA, Cook-Snyder DR, Miller JR, et al. Endogenous glutamatergic inputs to the parabrachial nucleus/kölliker-fuse complex determine respiratory rate. Respir Physiol Neurobiol. 2020;277:103401. doi:10.1016/j.resp.2020.103401
 © 2026 The Author(s). This work is published and licensed by Dove Medical Press Limited. The
full terms of this license are available at https://www.dovepress.com/terms
and incorporate the Creative Commons Attribution
- Non Commercial (unported, 4.0) License.
By accessing the work you hereby accept the Terms. Non-commercial uses of the work are permitted
without any further permission from Dove Medical Press Limited, provided the work is properly
attributed. For permission for commercial use of this work, please see paragraphs 4.2 and 5 of our Terms.
© 2026 The Author(s). This work is published and licensed by Dove Medical Press Limited. The
full terms of this license are available at https://www.dovepress.com/terms
and incorporate the Creative Commons Attribution
- Non Commercial (unported, 4.0) License.
By accessing the work you hereby accept the Terms. Non-commercial uses of the work are permitted
without any further permission from Dove Medical Press Limited, provided the work is properly
attributed. For permission for commercial use of this work, please see paragraphs 4.2 and 5 of our Terms.