Back to Journals » Therapeutics and Clinical Risk Management » Volume 12
A benefit–risk assessment model for statins using multicriteria decision analysis based on a discrete choice experiment in Korean patients
Authors Byun J, Kwon S, Ha J, Lee E ![]()
Received 12 November 2015
Accepted for publication 9 April 2016
Published 13 June 2016 Volume 2016:12 Pages 965—974
DOI https://doi.org/10.2147/TCRM.S100438
Checked for plagiarism Yes
Review by Single anonymous peer review
Peer reviewer comments 2
Editor who approved publication: Professor Garry Walsh
Ji-Hye Byun,1 Sun-Hong Kwon,1 Ji-Hye Ha,2 Eui-Kyung Lee1
1School of Pharmacy, Sungkyunkwan University, Suwon-si, Gyeonggi-do, 2Ministry of Food and Drug Safety, Cheongju-si, Chungcheongbuk-do, South Korea
Purpose: The benefit–risk balance for drugs can alter post approval owing to additional data on efficacy or adverse events. This study developed a quantitative benefit–risk assessment (BRA) model for statins using multicriteria decision analysis with discrete choice experiments and compared a recent BRA with that at the time of approval.
Patients and methods: Following a systematic review of the literature, the benefit criteria within the statin BRA model were defined as a reduction in the plasma low-density lipoprotein cholesterol level and a reduction in myocardial infarction incidence; the risk criteria were hepatotoxicity (Liv) and fatal rhabdomyolysis (Rha). The scores for these criteria were estimated using mixed treatment comparison methods. Weighting was calculated from a discrete choice experiment involving 203 Korean patients. The scores and weights were integrated to produce an overall value representing the benefit–risk balance, and sensitivity analyses were conducted.
Results: In this BRA model, low-density lipoprotein (relative importance [RI]: 37.50%) was found to be a more important benefit criterion than myocardial infarction (RI: 35.43%), and Liv (RI: 16.28%) was a more important risk criterion than Rha (RI: 10.79%). Patients preferred atorvastatin, and the preference ranking of cerivastatin and simvastatin was switched post approval because of the emergence of additional risk information related to cerivastatin.
Conclusion: A quantitative statin BRA model confirmed that the preference ranking of statins changed post approval because of the identification of additional benefits or risks.
Keywords: multicriteria decision analysis, statin, quantitative benefit–risk assessment, discrete choice experiment
Introduction
Health care decision makers require continuous benefit–risk assessment (BRA) of drugs from their development to administration. Decision makers, including regulators, physicians, and patients, evaluate the BRA of drugs based on their knowledge and judgment, but they often arrive at different BRAs for a drug because it is difficult to exclude subjective judgments. These differences have sometimes resulted in conflict between regulators, physicians, and patients. For example, natalizumab was suspended by regulators in 2005 but was remarketed owing to patient requests in 2006.1 Naturally, regulatory authorities have an interest in the BRA methods used for drugs, considering patients’ subjective judgments. In particular, the Innovative Medicines Initiative (IMI) of the Pharmacoepidemiological Research on Outcomes of Therapeutics by a European Consortium (PROTECT), which consists of the European Medicines Agency, an academic research center, and pharmaceutical companies, has released reports on various BRA methods.2 IMI-PROTECT has recommended some relevant BRA methods; multicriteria decision analysis (MCDA) has been identified by the IMI-PROTECT as an appropriate method for the quantitative BRA of drugs.3 MCDA is a comprehensive term used to indicate a process utilizing qualitative and quantitative methods that considers a range of factors concurrently.4 In fact, MCDA has already been widely used in health care research to inform resource allocation decision making in clinical applications.5 Although the development of models using MCDA can be complicated and time-consuming,6,7 MCDA can support decision makers and facilitate consistent and transparent decisions regarding health care issues.8 Owing to these advantages of MCDA, it is considered the most favorable method for BRA of drugs. Recently, Tervonen et al9 conducted a quantitative BRA of statins using the MCDA method. They suggested seven important steps of MCDA using the BRAs of six statins (atorvastatin, fluvastatin, lovastatin, pravastatin, rosuvastatin, and simvastatin). The seven steps were identified as follows: define the decision problem, select the evaluation criteria, synthesize and summarize the available data, translate relative outcomes based on the respective evidence to an absolute outcome, define a scale range for each criterion, elicit preference information, and incorporate uncertainty into the analysis. Other previous studies have also proven MCDA to be a useful approach because BRA decisions for drugs require the consideration of multiple benefits and risks.10,11
In this context, we compared a recent BRA with another available at the time of initial approval and used an MCDA model, including Korean patients’ subjective judgments as a supportive method for health technology assessment. To attain our objectives, we defined the process of MCDA for our study and developed the MCDA model for three statins (atorvastatin, simvastatin, and cerivastatin) and a placebo. Statins were used to demonstrate the BRA model because they were widely used to decrease cholesterol, although there is a controversy about their safety. Cerivastatin was withdrawn from the market because additional adverse events were reported post approval.12 Therefore, this study aimed to develop a quantitative BRA model for statins using MCDA with discrete choice experiments (DCEs) and compared a recent BRA with another at the time of approval and evaluated how much the withdrawal of cerivastatin affected its BRA from its initial approval to the present compared with other alternative statins. The subjective judgments of Korean patients were used to reflect their preference weights throughout the study. We also attempted to confirm whether the Korean patients agreed the to withdrawal of cerivastatin.
Patients and methods
MCDA, a method used to support decision makers in their evaluation of alternatives with multiple and conflictive criteria, was used to develop a BRA model for statins. The MCDA process involves: 1) structuring problems; 2) searching for evidence; 3) identifying criteria; 4) scoring criteria; 5) weighting criteria; 6) integrating scores and weights; and 7) analyzing sensitivity (Figure 1).13,14
 | Figure 1 MCDA process used to develop the benefit–risk assessment model for statins. |
Structuring problems
The first stage of MCDA is structuring problems to identify the interventions and their key issues. The benefits and risks associated with three statins – atorvastatin, simvastatin, and cerivastatin – have changed continuously post approval. Atorvastatin15 and simvastatin16 have been shown to prevent myocardial infarction (MI). The use of high-dose (80 mg) simvastatin17 has been prohibited by regulatory agencies because it causes muscle damage. Cerivastatin was approved in 1997 but was withdrawn by the US Food and Drug Administration (FDA) in 2001 following reports of fatal rhabdomyolysis.12 Thus, our research focused on the change in BRA for these statins, in order to compare the BRA at the time of initial approval with that in September 2013.
Searching for evidence
A literature review was performed to search for evidence relating to the benefits and risks of atorvastatin, simvastatin, and cerivastatin. The evidence at the time of approval was obtained from publicly available FDA drug information,18–20 from clinical trials published in MEDLINE, and from the Cochrane Central Register of Controlled Trials.21–23 The evidence relating to the benefits and risks of statins subsequent to their approval was identified by a systematic review of literature published between January 1989 and September 2013. In accordance with the predefined inclusion/exclusion criteria, 18 systematic literature reviews were selected from which 26 clinical trials were included. Our inclusion/exclusion criteria for the trials were defined as follows: 1) they must have included adult patients (older than 18 years) with dyslipidemia; 2) they must have reported a change in low-density lipoprotein (LDL) or total cholesterol concentrations while taking the specified statin over 4 weeks; 3) they must have reported the elevation of liver enzymes such as alanine aminotransferase and/or aspartate aminotransferase in those treated with the statins compared with other statins or the placebo; and 4) they must have objectively reported evidence evaluating fatal rhabdomyolysis or creatine kinase >10× the normal upper limit.
In addition, the incidence of statin-associated rhabdomyolysis resulting in hospitalization (Rha) was determined using the FDA adverse event reports,24 because this was not reported by clinical trials, even if it was the reason for cerivastatin withdrawal.
Identifying criteria
The statin BRA criteria were based on the primary end points and the serious adverse events reported in the literature. The benefit criteria were defined as the reduction in the level of LDL-cholesterol and the reduction in the incidence of MI. The risk criteria were established as hepatotoxicity (Liv) and Rha. Some outcome variables such as the incidence of diabetes, cognitive impairment, or cancer were excluded from this study because it was unclear whether these effects were statin related.
Scoring criteria
Criteria were scored by comparing alternatives with the results of clinical trials. We searched the head-to-head clinical trials relating to atorvastatin, simvastatin, and cerivastatin. However, the head-to-head literature relating to the three statins was not adequate, and a mixed treatment comparison (MTC) was conducted. The MTC was performed to estimate values for each statin criterion using OpenBUGS version 1.4.3 statistical software (MRC Biostatistics Unit, Cambridge, UK). The random-effects MTC model was applied because there was heterogeneity among the atorvastatin, simvastatin, and cerivastatin studies.25 The median MTC was calculated for atorvastatin, simvastatin, cerivastatin, and the placebo at the time of approval and at the September 2013 time point.
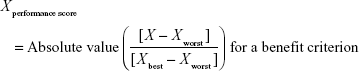
Direct comparison of scores was not possible because each clinical trial employed different units and ranges, depending on the criteria involved. To facilitate comparison of these results, a performance score (PS) was calculated by normalization using a best–worst scale.26 The PSs of the respective statins were estimated using a simple linear additive model for value-based measurement methods27 as follows:
|
|
|
|
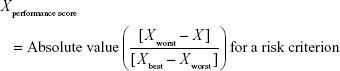
Xperformance score was the normalized value based on X, which was the original median value of the MTC of clinical trials with respect to a particular criterion and statin. For the benefit criterion, Xbest was the most effective score reported and Xworst was the least effective score. For the risk criterion, Xbest was the lowest adverse event rate, while Xworst was the highest adverse event rate. PS easily displays the changing clinical information for alternatives between the time of approval and post approval. It also clearly shows that some treatments have unique characteristics for each criterion compared with other treatments.
Weighting criteria
Ethical approval from the Sungkyunkwan University Institutional Review Board for this study was not required, because this study was approved by the Korean Ministry of Food and Drug Safety, and the aims of this paper were for in the public interest. Participants who voluntarily agreed to participate in the study were included, and prior to their inclusion in the study, written informed consents were obtained from all participants.
The weights of the statin BRA criteria were calculated using the DCE method in Korean patients receiving antihypertensive or cholesterol-lowering drugs. The DCE method was used because it provides a flexible methodology that permits evaluation of multiple conflicting preferences by MCDA.13,28–31
To design the DCE, criteria levels were determined using the MTC results for atorvastatin, simvastatin, and cerivastatin (Table 1). Eighty-one hypothetical DCE scenarios could be developed in total for each of the three levels of four criteria (ie, 34=81). However, we structured ten scenario sets for the four criteria with reference to “a library of orthogonal arrays”32 using the fold-over method. This method satisfied three essential requirements of the scenario sets (orthogonality, minimum overlapping, and equal balance), without overburdening the survey participants.
 | Table 1 Criteria and levels of atorvastatin, simvastatin, and cerivastatin |
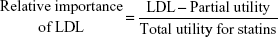
The DCE questionnaires had ten choice sets, including one rational judgment choice. All the respondents repeatedly estimated these sets for the hypothetical drugs A and B with different levels of appraisal criteria and no labels of ingredients or product names to prevent respondent bias. The survey was conducted over 2 months, from September 2013 to October 2013. Two hundred and five patients over the age of 18 years were recruited, in accordance with the age and sex distribution of the Health Insurance Review and Assessment Service patient database33 (E78 code: disorders of lipoprotein metabolism and other lipidemias) and the patients database with essential hypertension and other hypertension in the Korean National Health Insurance Statistical Yearbook.34 All subjects were interviewed by interviewers who were trained to explain the questionnaire without introducing bias. The respondents who did not select the dominant option between the two alternatives were excluded because that meant that they had made an irrational choice. Data were categorized by an effects-coded model based on previously published guidelines.35 The collected binary data were analyzed by mixed logistic regression using the SAS 9.3 software. The coefficients estimated in the mixed logistic model could be important factors affecting treatment preference when they had statistical significance. A higher positive coefficient indicated a higher relative importance; the reverse was true for negative coefficients.36,37 The calculated relative importance was used as the MCDA weighting.31 Normalized weights enable the weight of a specific criterion to be used as part of the total weight.8 Criteria were assigned a greater weight when they were considered by the patients surveyed to be more important. Weights for criteria were equally applied in all alternatives. For example, the weight of LDL criterion was calculated as follows:
|
|
Integration of scores and weights
This step calculates overall value (OV), which complements weights with the limitation of hypothetical bias by integrating PSs and weights because PS is almost as close to the real data evaluated from systematic reviews of the literature of the real alternatives in our study. The OV was calculated as the sum of the weighted criteria scores for each statin, while the criteria weights and PSs were evaluated for atorvastatin, simvastatin, and cerivastatin.13,14 The scores and weights were integrated using the following equation:
|
|
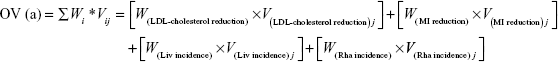
where Wi means the respective weight and Vij is the PS of alternative j of the ith criterion. The highest OV for an alternative is recommended as the best alternative.
The interpretation of OV requires more attention. For example, the best alternative does not have the highest PS for all criteria. The best alternative may have a lower PS for a certain criterion; however, it will be complemented by the weights.13
Sensitivity analysis
The sensitivity analysis was conducted using stochastic multicriteria acceptability analysis (SMAA). SMAA can be complementary to the MCDA method without information regarding weights. Thus, SMAA supports multicriteria group decision making in problems with inaccurate or uncertain information regarding weights. We conducted the sensitivity analysis using the JSMAA software (open-source software for SMAA computations; Tommi Tervonen, Rotterdam, the Netherlands) under the assumption that the information regarding weights was missing. Gaussian distribution was applied as the continuous parameter for LDL criterion and, beta distribution was used as the observed incident rate for MI, Liv, and Rha criteria. SMAA showed that the best alternative was the one with the highest rank acceptable index for the best ranks. The rank acceptability index was in the range (0, 1), where 0 meant that the alternative would never acquire a given rank and 1 indicated that it would always attain the given rank with any choice of weights.38
Results
We developed a statin BRA model with four criteria (LDL, MI, Liv, and Rha) that used MCDA and reflected the preferences of Korean patients using DCE. Our model clearly showed differences between the BRA for simvastatin and the withdrawn cerivastatin at the time of initial approval and at the September 2013 time point. The statin BRA results were evaluated as described later.
PSs using MTC
The PSs, calculated from the relative MTC value for each statin between the initial and recent time points, are shown in Table 2. Significant differences were observed between PSs at these time points. The PS for the LDL criterion was the highest for atorvastatin (0.87), compared with cerivastatin (0.65), simvastatin (0.59), and the placebo (0.03) at the time of approval. At the September 2013 time point, however, this order was switched as follows: atorvastatin 0.69, simvastatin 0.59, cerivastatin 0.56, and the placebo 0.09. For the MI criterion, the PSs of all statins increased post approval. This was because the MI effects were not reported at the time of approval but were identified subsequently. Atorvastatin showed the highest PS for this criterion (0.84) compared with cerivastatin (0.64), simvastatin (0.77), and the placebo (0.50). The PS of the placebo for the MI criterion was the same at both appraisal times because the placebo did not affect the incidence of MI.
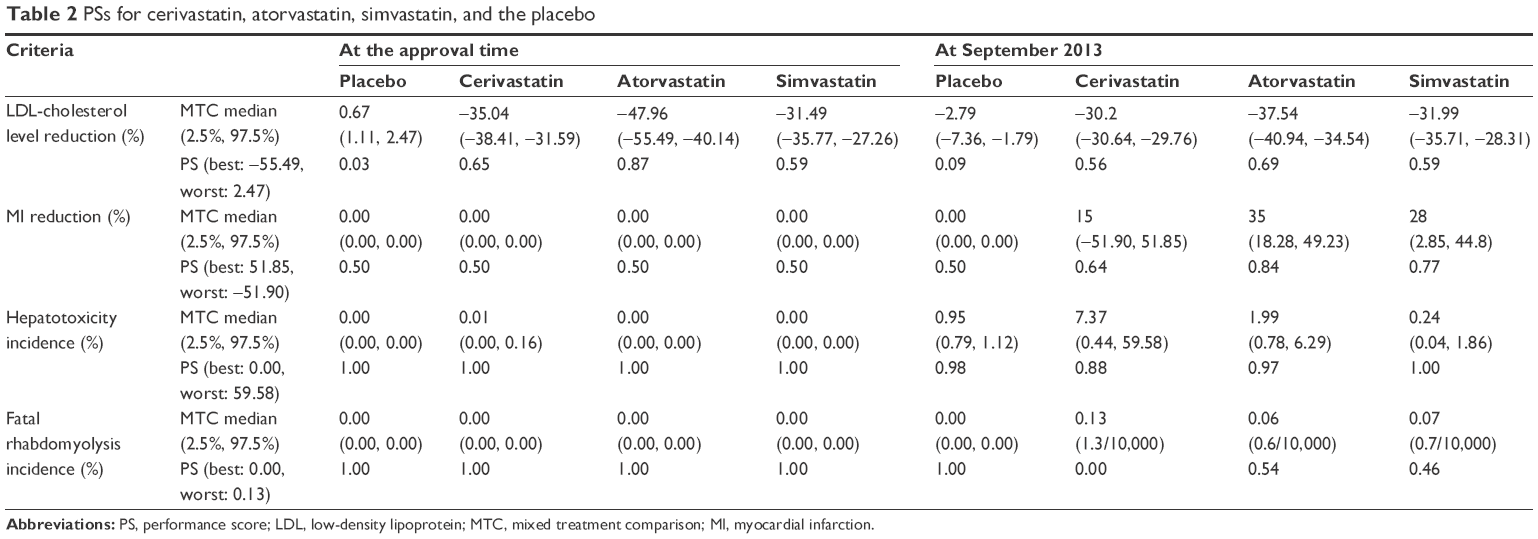 | Table 2 PSs for cerivastatin, atorvastatin, simvastatin, and the placebo |
For the Liv and Rha criteria, all three statins showed the best value (1.00) at the time of approval because serious hepatotoxicity and fatal rhabdomyolysis were not reported. However, these values worsened post approval. At the September 2013 time point, the Liv criterion PS had declined to 0.97 for atorvastatin and 0.88 for cerivastatin. The Rha criterion PS for cerivastatin showed the worst value (0.00) at the September 2013 time point compared with 0.54 for atorvastatin, 0.46 for simvastatin, and 1.00 for the placebo. These findings demonstrated that, in the time since approval, the PSs for the two benefit criteria (LDL and MI) and the two risk criteria (Liv and Rha) were greatly changed among the alternatives.
Determination of weights using DCE
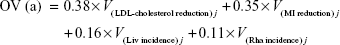
Two respondents were excluded owing to irrational responses, and 203 patients were included in the final analyses (Table 3). A total of 205 interviewees participated in this study. Ultimately, 203 respondents were analyzed because two had incomplete and irrational answers. Through this DCE approach, 99.02% of subjects rationally selected the dominant hypothetical statin when they knew the information on trade-offs between the benefit–risk attributes, indicating that patients understood the questionnaire. Table 3 lists information about the age and sex distribution of the 203 respondents included in the study. The patient respondents had a mean (SD) age of 52.6 years (6.7 years), and 51.79% were females. In addition, the diseases of patients comprised 41.4% hypertension, 30.0% dyslipidemia, and 28.6% both hypertension and dyslipidemia. The largest proportion of patients showed a high adherence to antihypertensive drugs at 78.2% and lipid-lowering agents at 73.1%. In a previous article,39 we also described how the socioeconomic gradient of respondents impacted the use of statins and secondary prevention. The majority of patients graduated from high school or more, and patients self-reported more awareness of benefits of statins (67.0%) than of risks (50.2%). The benefit criteria outweighed the risk criteria for the Korean patients (Table 4). In the mixed logistic regression, the weights of LDL and MI were, respectively, estimated as 0.38 and 0.35, while the Liv and Rha criteria were assigned respective weights of 0.16 and 0.11. These weightings were used to modify Equation 4 as shown as follows:
|
|
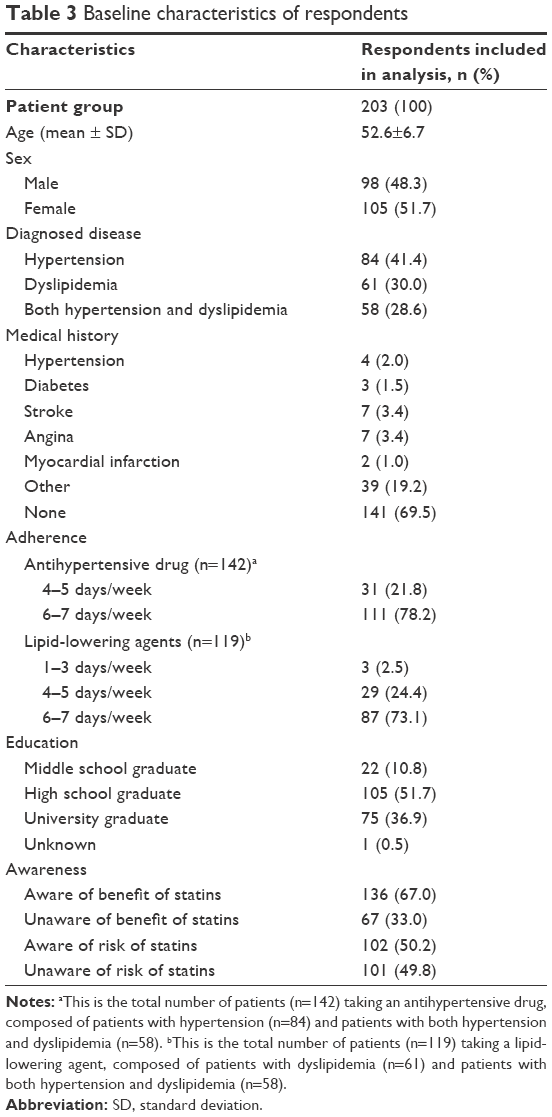 | Table 3 Baseline characteristics of respondents |
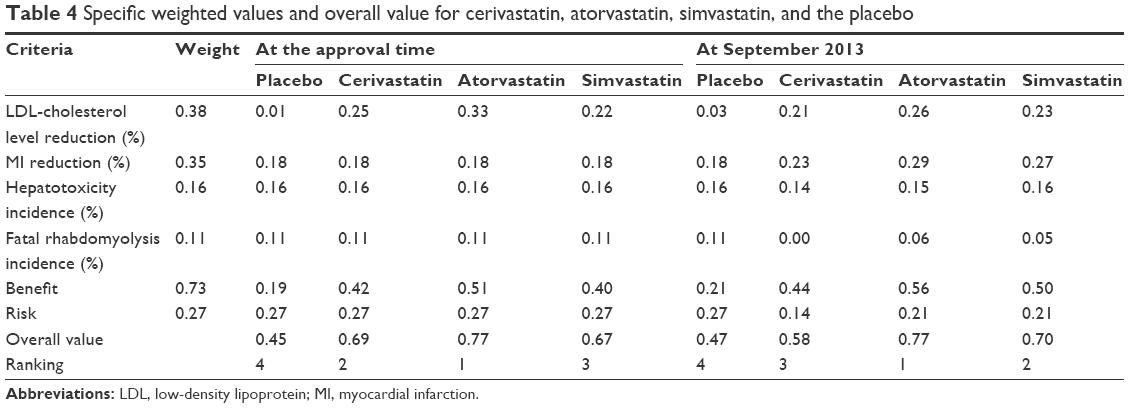 | Table 4 Specific weighted values and overall value for cerivastatin, atorvastatin, simvastatin, and the placebo |
Overall MCDA value
The estimated OV for each statin is presented in Table 4. The OV rankings were atorvastatin 0.77, cerivastatin 0.69, simvastatin 0.67, and the placebo 0.45 at the time of approval compared to the values of 0.77 for atorvastatin, 0.70 for simvastatin, 0.58 for cerivastatin, and 0.47 for the placebo at the September 2013 time point. These results indicated that the quantitative BRA for statins changed after approval. The quantitative BRA changed differently for the three statins examined. Comparison of the BRA at these two time points revealed that the benefit values increased for all statins because of the post-approval identification of their additional effects on MI reduction, while the identification of Liv and Rha differently decreased the risk values. The benefit values increased from 0.51 to 0.56 for atorvastatin and from 0.40 to 0.50 for simvastatin. The risk values decreased slightly from 0.27 to 0.21 for atorvastatin and simvastatin. The cerivastatin benefit value increased slightly from 0.42 to 0.44. However, the cerivastatin risk value decreased substantially from 0.27 to 0.14. This increased the OV for simvastatin from 0.67 to 0.70, while the OV for cerivastatin declined from 0.69 to 0.58 post approval. Atorvastatin showed the highest OV among the three statins investigated in this study.
Sensitivity analysis
Figure 2 illustrates the rank acceptability indices for alternatives when the weights of criteria were missed. The rank acceptability index order for atorvastatin was as follows: rank 1 (0.77), rank 2 (0.20), rank 3 (0.03), and rank 4 (0.00). This means that atorvastatin with an index of 77% (rank 1) was the best alternative. The rank acceptability index order for cerivastatin was rank 1 (0.03), rank 2 (0.1), rank 3 (0.59), and rank 4 (0.28), suggesting that cerivastatin with an index of 3% was ranked the best statin. In other words, atorvastatin was ranked the best statin, while cerivastatin was ranked the worst statin. These results indicate that the quantitative BRA for withdrawn cerivastatin was ranked worst among the statins even after exclusion of weight influence.
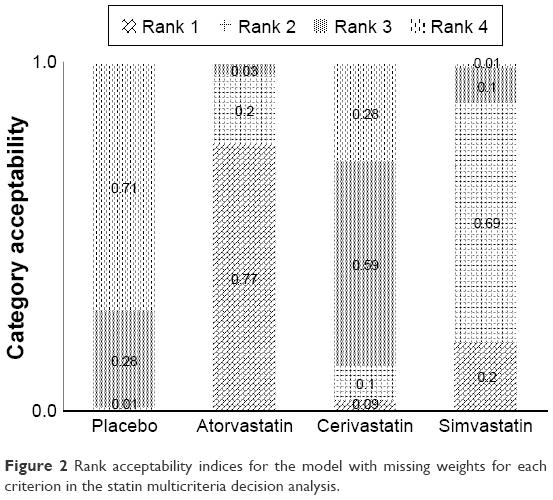 | Figure 2 Rank acceptability indices for the model with missing weights for each criterion in the statin multicriteria decision analysis. |
Discussion
This quantitative BRA for statins using MCDA produced significant findings. First, the preferred ranking using OV of the BRA model allowed quantitative comparison of BRA between statins. The OV for atorvastatin (0.77) was the highest among the three statins investigated in this study at the two appraisal times. This related to atorvastatin having the highest PS in the weighted benefit criteria. At the time of approval, the OV for cerivastatin ranked second because the PS was higher than that of simvastatin for the most important criterion (LDL). At the September 2013 time point, the OV for cerivastatin was the lowest among the three statins (0.58). Some researchers consider that the preferred OV resulting from MCDA is adequate for the prioritization of statins. However, this approach is limited because the OV is wholly dependent on the model structure and is not absolute. This means that it is difficult to compare OVs of different MCDA models. Thus, we believe that the ranking resulting from MCDA is a more relevant approach. In this study, cerivastatin was identified second at the initial time point but was ranked third at the September 2013 time point, while the rankings of the marketed atorvastatin were consistent.
Second, this study provided steps toward building a transparent methodology for monitoring post approval. In this study, these results demonstrated that quantitative BRA will continuously change after approval and emphasized the need for regular benefit–risk evaluations. Until now, we have intuitively known that the benefit–risk relationship for medicines needs to be reviewed continuously. However, we can now use this BRA model to obtain quantitative evidence to inform approval or withdrawal decisions. To our knowledge, no previous study has identified the preferred order change in BRA post approval. A previous study displayed the preferred ranking for statins, without comparing the BRA quantitatively at the two appraisal times.40 Third, this study was the first to survey the preferences of Korean patients in relation to statin choice. These patients showed a tendency to weight the benefits of statins (LDL 0.38; MI 0.35) more heavily than their risks (Liv 0.16; Rha 0.11). The tendency of patients to weight benefits over risks was consistent with previous studies published by Najafzadeh et al41 and Yuan et al.42 The result of patients’ preferences will be very useful in supporting decisions when Korean physicians or regulators communicate with their patients about statin choice or a wider health technology assessment process. Actually, the patients’ preferences were often overlooked or not analyzed systematically.
This study is of interest not only because it uses the MCDA method but also because of the clinically significant information that patients preferred beneficial criteria to risk criteria. Based on these findings, doctors can consider the preference of the patients in selecting statins for their treatment. In addition, physicians occasionally need to choose another drug based on the patients’ liver or kidney function. However, the patients may overlook the risks of a statin and ask doctors to change their medication. This could occur if there is inequality of knowledge between patients and physicians. In such cases, doctors need to help their patients understand the risks of statins and change the preference order of decision-making criteria. In short, the clinical significance of this research is that when doctors deeply understand the preference of their patients, the patients end up with better outcomes. Despite the significant findings, this study has some limitations. Our model included only four criteria even though the statins presented many benefits and risks for consideration, because many criteria would have presented the respondents with a lengthy and repetitive DCE questionnaire. However, four criteria represented the major benefit–risk characteristics for statins based on the primary end points and the serious adverse events. Moreover, there may be a correlation between the benefit criteria LDL and MI because LDL is used as a surrogate end point and serves to reduce the MI incidence rate. We attempted to develop the MCDA model that compared a recent BRA with that at the time of approval. However, the available benefit outcome data were limited at the initial time of approval. They were an inevitable consequence of the correlation between the benefit criteria.
Conclusion
The BRA model using MCDA will be a useful approach for quantitative comparisons between the time of approval and post approval. However, not all the existing authority processes will be replaced by the MCDA method. This method could just support regulatory decision makers and will facilitate efficient communication between decision makers, such as patients and regulatory reviewers, because it provides preference transparency and shows the preferred order of alternatives.
Acknowledgment
This research was supported by a grant (13182MFDS703) from the Ministry of Food and Drug Safety in 2013.
Disclosure
The authors report no conflicts of interest in this work.
References
Pharmacoepidemiological Research on Outcomes of Therapeutics by a European Consortium (PROTECT) [webpage on the internet]. IMI WP5 Report 1: Benefit-Risk Wave 1 case study report: NATALIZUMAB. London. 2013. Available from: http://www.imi-protect.eu/documents/NixonetalBenefitRiskWave1casestudyreportNatalizumabMay2013.pdf. Accessed March 10, 2016. | ||
European Medicines Agency (EMA) [webpage on the internet]. Benefit-Risk Methodology Project. London; 2009. Available from: http://www.ema.europa.eu/docs/en_GB/document_library/Report/2011/07/WC500109477.pdf/. Accessed March 10, 2016. | ||
Pharmacoepidemiological Research on Outcomes of Therapeutics by a European Consortium (PROTECT) [webpage on the internet]. Review of Methodologies for Benefit and Risk Assessment of Medication. London; 2013. Available from: http://www.imi-protect.eu/documents/Shahruletal Review of methodologies for benefit and risk assessment of medication May2013.pdf. Accessed March 10, 2016. | ||
Baltussen R, Niessen L. Priority setting of health interventions: the need for multi-criteria decision analysis. Cost Eff Resour Alloc. 2006;4:14. | ||
Diaby V, Campbell K, Goeree R. Multi-criteria decision analysis (MCDA) in health care: a bibliometric analysis. Oper Res Health Care. 2013;2(1–2):20–24. | ||
Dolan JG. Medical decision making using the analytic hierarchy process: choice of initial antimicrobial therapy for acute pyelonephritis. Med Decis Making. 1989;9(1):51–56. | ||
Hummel JM, Snoek GJ, van Til JA, van Rossum W, Ijzerman MJ. A multicriteria decision analysis of augmentative treatment of upper limbs in persons with tetraplegia. J Rehabil Res Dev. 2005;42(5):635–644. | ||
Belton V, Stewart TJ. Multiple Criteria Decision Analysis: An Integrated Approach. Norwell, MA: Kluwer Academic Publishers; 2002. | ||
Tervonen T, Naci H, van Valkenhoef G, et al. Applying multiple criteria decision analysis to comparative benefit-risk assessment: choosing among statins in primary prevention. Med Decis Making. 2015;35(7):859–871. | ||
Mussen F, Salek S, Walker S. A quantitative approach to benefit-risk assessment of medicines – part 1: the development of a new model using multi-criteria decision analysis. Pharmacoepidemiol Drug Saf. 2007;16(suppl1):S2–S15. | ||
Mussen F, Salek S, Walker S. Development and application of a benefit-risk assessment model based on multi-criteria decision analysis. In: Walker S, editor. Benefit-Risk Appraisal of Medicines: A Systematic Approach to Decision-Making. Chichester: John Wiley & Sons Ltd; 2008:111–149. | ||
Staffa JA, Chang J, Green L. Cerivastatin and reports of fatal rhabdomyolysis. N Engl J Med. 2002;346(7):539–540. | ||
Thokala P, Duenas A. Multiple criteria decision analysis for health technology assessment. Value Health. 2012;15(8):1172–1181. | ||
Levitan BS, Andrews EB, Gilsenan A, et al. Application of the BRAT framework to case studies: observations and insights. Clin Pharmacol Ther. 2011;89(2):217–224. | ||
US Food and Drug Administration (FDA) [webpage on the Internet]. FDA Approve Label on 10/31/2012 for Lipitor in Approval History Section. Available from: http://www.accessdata.fda.gov/drugsatfda_docs/label/2012/020702s062s063lbl.pdf. Accessed March 10, 2016. | ||
US Food and Drug Administration (FDA) [webpage on the Internet]. FDA Approve Label on 10/31/2012 for Zocor in Approval History Section. Available from: http://www.accessdata.fda.gov/drugsatfda_docs/label/2014/019766s091lbl.pdf. Accessed March 10, 2016. | ||
US Food and Drug Administration (FDA) [webpage on the Internet]. FDA Drug Safety Announcement: New Restrictions, Contraindications, and Dose Limitations for Zocor (simvastatin) to Reduce the Risk of Muscle Injury. Available from: http://www.fda.gov/drugs/drugsafety/ucm256581.htm. Accessed March 10, 2016. | ||
US Food and Drug Administration (FDA) [webpage on the Internet]. FDA Approve Label on 26/06/1997 for Baycol in Approval History Section. Available from: http://www.accessdata.fda.gov/drugsatfda_docs/nda/97/020740_baycol_toc.cfm/. Accessed March 10, 2016. | ||
US Food and Drug Administration (FDA) [webpage on the Internet]. FDA Approve Label on 17/12/1996 for Lipitor in Approval History Section. Available from: http://www.accessdata.fda.gov/drugsatfda_docs/nda/pre96/020702_s000.pdf. Accessed March 10, 2016. | ||
US Food and Drug Administration (FDA) [webpage on the Internet]. FDA Approve Label on 19/04/1995 for Zocor in Approval History Section. Available from: http://www.accessdata.fda.gov/drugsatfda_docs/nda/pre96/019766_s008_ZOCOR_TABLETS.pdf. Accessed March 10, 2016. | ||
Insull W Jr, Isaacsohn J, Kwiterovich P, et al. Efficacy and safety of cerivastatin 0.8 mg in patients with hypercholesterolaemia: the pivotal placebo-controlled clinical trial. J Int Med Res. 2000;28(2):47–68. | ||
Nawrocki JW, Weiss SR, Davidson MH, et al. Reduction of LDL cholesterol by 25% to 60% in patients with primary hypercholesterolemia by atorvastatin, a new HMG-CoA reductase inhibitor. Arterioscler Thromb Vasc Biol. 1995;15(5):678–682. | ||
MAAS Investigators. Effect of simvastatin on coronary atheroma: the Multicentre Anti-Atheroma Study (MAAS). Lancet. 1994;344(8923):633–638. | ||
McAdams M, Staffa J, Dal Pan G. Estimating the extent of reporting to FDA: a case study of statin-associated rhabdomyolysis. Pharmacoepidemiol Drug Saf. 2008;17(3):229–239. | ||
Higgins JP, Thompson SG, Spiegelhalter DJ. A re-evaluation of random-effects meta-analysis. J R Stat Soc Ser A Stat Soc. 2009;172(1):137–159. | ||
Flynn TN, Louviere JJ, Peters TJ, Coast J. Best – worst scaling: what it can do for health care research and how to do it. J Health Econ. 2007;26(1):171–189. | ||
Diaby V, Goeree R. How to use multi-criteria decision analysis methods for reimbursement decision-making in healthcare: a step-by-step guide. Expert Rev Pharmacoecon Outcomes Res. 2014;14(1):81–99. | ||
Hwang CL, Yoon KP. Multiple Criterion Decision Making: An Introduction. Thousand Oaks, CA: Sage Publications; 1995. | ||
Lancsar E, Louviere J. Conducting discrete choice experiments to inform healthcare decision making: a user’s guide. Pharmacoeconomics. 2008;26(8):661–677. | ||
Ryan M, Gerard K. Using discrete choice experiments to value health care programmes: current practice and future research reflections. Appl Health Econ Health Policy. 2003;2(1):55–64. | ||
Defechereux T, Paolucci F, Mirelman A, et al. Health care priority setting in Norway a multi-criteria decision analysis. BMC Health Serv Res. 2012;12:39. | ||
Hedayat AS, Sloane NJA, Stufken J. Orthogonal Arrays: Theory and Applications. New York, NY: Springer-Verlag; 1999. | ||
Health Insurance Review & Assessment Service (HIRA) [webpage on the Internet]. Patient Data (E78: Disorders of Lipoprotein Metabolism and Other Lipidemias). Available from: http://www.hira.or.kr/rd/dissdic/infoSickList.do?pgmid=HIRAA020044020100. Accessed March 10, 2016. | ||
Korean National Health Insurance Services [webpage on the Internet]. Korean National Health Insurance Statistical Yearbook; 2012. Available from: http://stat.kosis.kr/nsieu/view/tree.do?task=branchView&id=350_35001_6*MT_OTITLE&hOrg=350. Accessed March 10, 2016. | ||
Reed Johnson F, Lancsar E, Marshall D, et al. Constructing experimental designs for discrete-choice experiments: report of the ISPOR conjoint analysis experimental design good research practices task force. Value Health. 2013;16(1):3–13. | ||
Lagarde M, Blaauw D. A review of the application and contribution of discrete choice experiments to inform human resources policy interventions. Hum Resour Health. 2009;7:62. | ||
de Bekker-Grob EW, Essink-Bot ML, Meerding WJ, Pols HA, Koes BW, Steyerberg EW. Patients’ preferences for osteoporosis drug treatment: a discrete choice experiment. Osteoporos Int. 2008;19(7):1029–1037. | ||
Tervonen T. JSMAA: open source software for SMAA computations. Int J Syst Sci. 2014;45(1):69–81. | ||
Selmer R, Sakshaug S, Skurtveit S, Furu K, Tverdal A. Statin treatment in a cohort of 20 212 men and women in Norway according to cardiovascular risk factors and level of education. Br J Clin Pharmacol. 2009;67(3):355–362. | ||
Ramli A, Aljunid SM, Sulong S, Md Yusof FA. National drug formulary review of statin therapeutic group using the multi-attribute scoring tool. Ther Clin Risk Manag. 2013;9:491–504. | ||
Najafzadeh M, Gagne JJ, Choudhry NK, Polinski JM, Avorn J, Schneeweiss SS. Patients’ preferences in anticoagulant therapy: discrete choice experiment. Circ Cardiovasc Qual Outcomes. 2014;7(6):912–919. | ||
Yuan Z, Levitan B, Burton P, Poulos C, Brett Hauber A, Berlin JA. Relative importance of benefits and risks associated with antithrombotic therapies for acute coronary syndrome: patient and physician perspectives. Curr Med Res Opin. 2014;30(9):1733–1741. |
 © 2016 The Author(s). This work is published and licensed by Dove Medical Press Limited. The
full terms of this license are available at https://www.dovepress.com/terms
and incorporate the Creative Commons Attribution
- Non Commercial (unported, 3.0) License.
By accessing the work you hereby accept the Terms. Non-commercial uses of the work are permitted
without any further permission from Dove Medical Press Limited, provided the work is properly
attributed. For permission for commercial use of this work, please see paragraphs 4.2 and 5 of our Terms.
© 2016 The Author(s). This work is published and licensed by Dove Medical Press Limited. The
full terms of this license are available at https://www.dovepress.com/terms
and incorporate the Creative Commons Attribution
- Non Commercial (unported, 3.0) License.
By accessing the work you hereby accept the Terms. Non-commercial uses of the work are permitted
without any further permission from Dove Medical Press Limited, provided the work is properly
attributed. For permission for commercial use of this work, please see paragraphs 4.2 and 5 of our Terms.