Back to Journals » Journal of Blood Medicine » Volume 12
3D Multicellular Spheroid for the Study of Human Hematopoietic Stem Cells: Synergistic Effect Between Oxygen Levels, Mesenchymal Stromal Cells and Endothelial Cells
Authors Barreto-Duran E ![]() , Mejia-Cruz CC
, Mejia-Cruz CC ![]() , Jaramillo-Garcia LF, Leal-Garcia E, Barreto-Prieto A, Rodriguez-Pardo VM
, Jaramillo-Garcia LF, Leal-Garcia E, Barreto-Prieto A, Rodriguez-Pardo VM ![]()
Received 4 February 2021
Accepted for publication 27 April 2021
Published 30 June 2021 Volume 2021:12 Pages 517—528
DOI https://doi.org/10.2147/JBM.S305319
Checked for plagiarism Yes
Review by Single anonymous peer review
Peer reviewer comments 2
Editor who approved publication: Dr Martin H Bluth
Emilia Barreto-Duran,1 Claudia Camila Mejia-Cruz,1 Luis Fernando Jaramillo-Garcia,2 Efrain Leal-Garcia,3 Alfonso Barreto-Prieto,1 Viviana Marcela Rodriguez-Pardo1
1Grupo de Inmunobiología y Biología Celular, Facultad de Ciencias, Pontificia Universidad Javeriana, Bogotá D.C., Colombia (South America); 2Departamento de Patología, Facultad de Medicina, Pontificia Universidad Javeriana., Hospital Universitario San Ignacio, Bogotá D.C., Colombia (South America); 3Departamento de Ortopedia y Traumatología, Facultad de Medicina, Pontificia Universidad Javeriana., Hospital Universitario San Ignacio, Bogotá D.C., Colombia (South America)
Correspondence: Viviana Marcela Rodriguez-Pardo Email [email protected]
Introduction: The human bone marrow microenvironment is composed of biological, chemical and physical factors that act in a synergistic way to modulate hematopoietic stem cell biology, such as mesenchymal stromal cells (MSCs), endothelial cells (ECs) and low oxygen levels; however, it is difficult to mimic this human microenvironment in vitro.
Methods: In this work, we developed 3D multicellular spheroid (3D-MS) for the study of human hematopoietic stem cells (HSCs) with some components of perivascular niche. HSCs were isolated from umbilical cord blood, MSCs were isolated from human bone marrow and a microvasculature EC line (CC-2811, Lonza®) was used. For the formation of a 3D structure, a magnetic levitation culture system was used. Cultures were maintained in 21%, 3% and 1% O2 for 15 days. Culture volume, sphericity index and cell viability were determined. Also, human HSC proliferation, phenotype and production of reactive oxygen species were evaluated.
Results: After 15 days, 3D-MS exhibited viability greater than 80%. Histology results showed structures without necrotic centers, and higher cellular proliferation with 3% O2. An increase in the expression of the CD34 antigen and other hematopoietic antigens were observed to 1% O2 with MSCs plus ECs and low ROS levels.
Conclusion: These findings suggest that 3D-MS formed by MSCs, ECs and HSCs exposed to low concentrations of oxygen (1– 3% O2) modulate human HSC behavior and mimics some features of the perivascular niche, which could reduce the use of animal models and deepen the relationship between the microenvironment of HSC and human hematological diseases development.
Keywords: hematopoietic stem cells, niche, bone marrow, microenvironment, 3D culture
Introduction
Hematopoiesis is a very active and efficient process that generates approximately 4–5×10¹¹ hematopoietic cells per day.1 This complex system is regulated by the interaction between hematopoietic stem cells (HSCs) and other cell populations that reside in the bone marrow (BM), soluble factors and physicochemical conditions such as oxygen perfusion.2 HSCs are distributed in endosteal and perivascular niches3–5; however, recent evidence suggests that HSCs have a preferential location in the perivascular niche,6–8 which are enriched with different populations of mesenchymal stromal cells (MSCs) and endothelial cells (ECs).9–12
Several studies have shown the close relationship between HSCs, MSCs and ECs and the influence of these relationships on hematopoiesis.13 MSCs are the major source of SCF and SDF-1 (CXCL12)14 in the bone marrow, which once deleted, greatly affect the quantity and engrafting capacity of HSCs.11,14,15 It has also been shown that ECs regulate self-renewal, proliferation and phenotype modulation of HSCs through direct contact or soluble factors.16–20
Contrary to the findings about the murine HSC niche, information about the microenvironment of human HSCs is limited. It has been shown that 86% of human primitive CD34+ HSCs are located in the perivascular region close to CD271+/CD146+ MSCs,21,22 which secrete factors that promote the maintenance of human HSCs and increase their ability to repopulate in vivo.23–25 Furthermore, HSCs are particularly sensitive to low oxygen levels that induce intracellular signals that promote the maintenance of their self-renewal, stemness, phenotype modulation, glycolytic metabolism and low production of reactive oxygen species (ROS).7,26,27 Recent evidence shows that the most primitive HSCs are located in the perivascular niches in close relationship with MSCs, ECs and low levels of oxygen.27,28
To establish an in vitro system that mimics the microenvironment of human HSCs, we previously established a 3D culture system using magnetic levitation for the study of the human HSC microenvironment.29 In this work, we evaluated the synergistic effect between MSCs, endothelial cells and different levels of oxygen levels on the viability, proliferation, phenotype modulation and production of reactive oxygen species of human HSCs using 3D multicellular spheroid (3D-MS).
Methods
Generation of 3D Multicellular Spheroids
HSCs (CD34+) were isolated from umbilical cord blood (UCB) (Table 1), and MSCs were isolated from human bone marrow (hBM) (Table 2), after accepting the informed consent for the voluntary donation of UCB and hBM was conducted in accordance with the Declaration of Helsinki and approval of the ethics committee of Hospital Universitario San Ignacio, Act No 18 (2014/154). HSC and MSC isolation, expansion and characterization have been previously demonstrated by our group.29–34 HMVEC-dBlAd (CC-2811 Lonza®) cell line was expanded in endothelial cell growth medium (EGMTM-2 BulletKit™, Lonza®). HpDLF (fibroblast, CC-7049 Lonza®) cell line was expanded in modified Eagle’s medium (Merck®), and this was used as a negative control. The 3D structures were generated with a magnetic levitation system containing MSCs, HSCs and ECs (ratio 1:2:2).29 3D structure control groups were generated: fibroblasts, HSCs and ECs (Fb-HSC-ECs), and MSCs-HSCs. 3D-MS were cultured at three O2 concentrations (1%, 3% and 21%) for 15 days. For hypoxic conditions, 3D-MS were cultured in a hypoxia chamber (chamber C-Chamber Incubator Subchamber, BioSpherix ©) using a mixture of gases (O2, N2 and CO2).
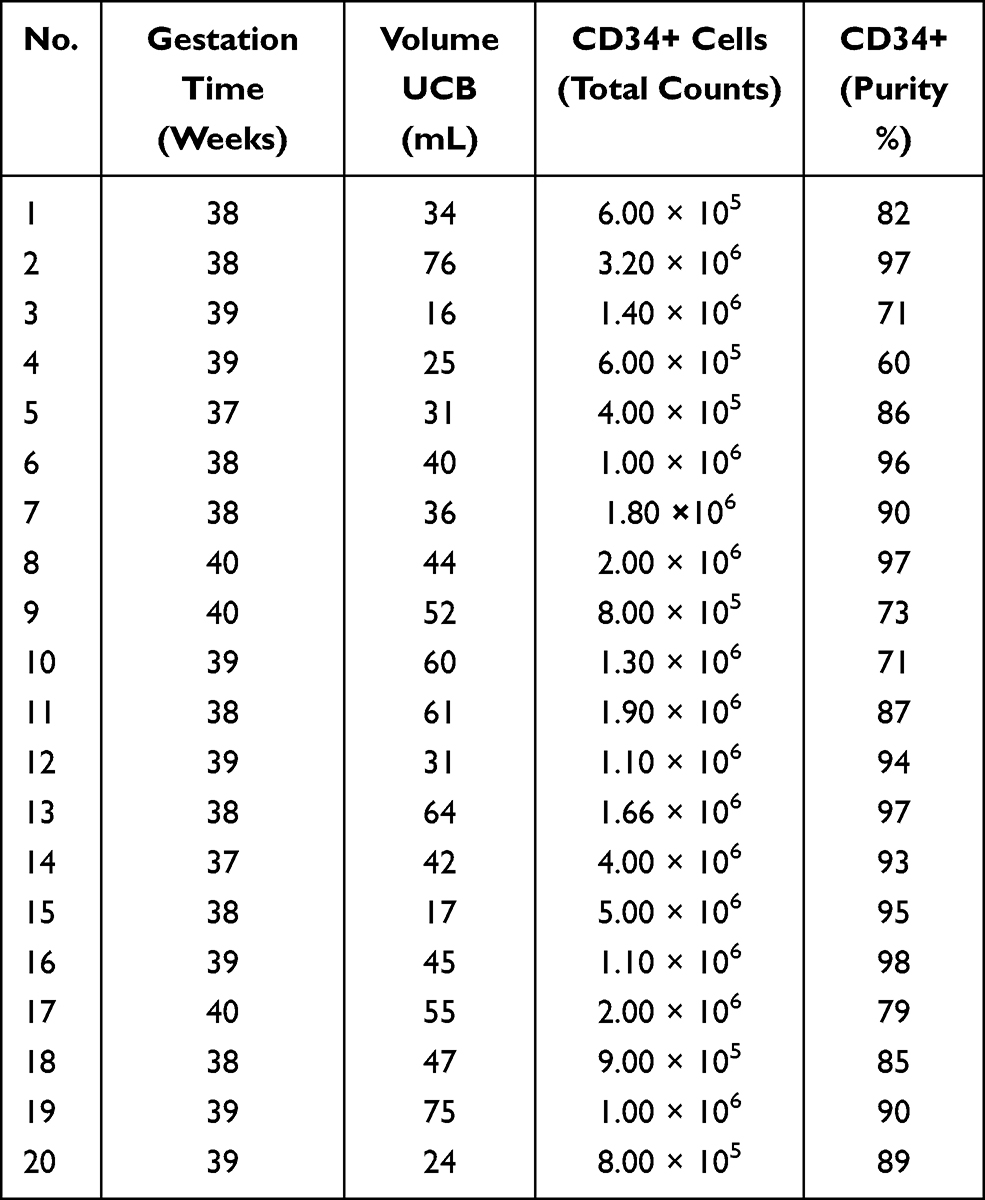 |
Table 1 Umbilical Cord Blood (UCB) Donors for HSC Isolation |
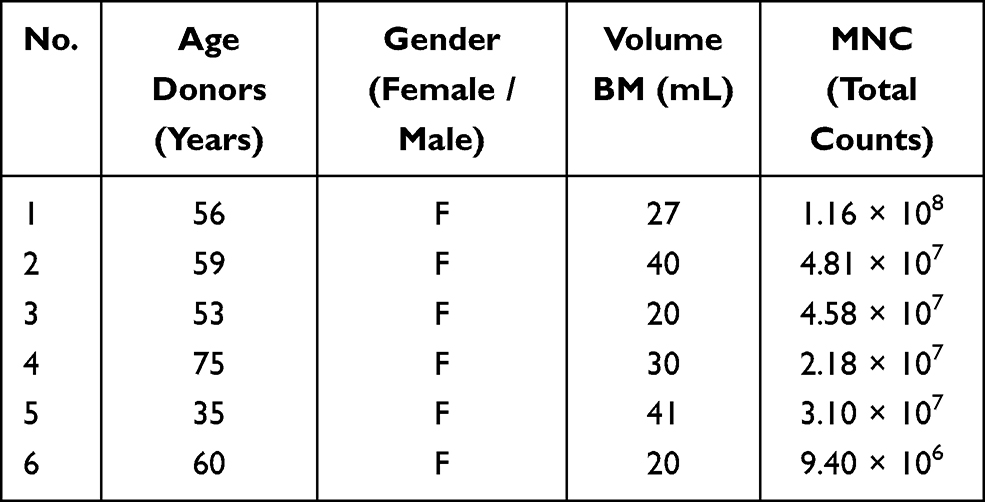 |
Table 2 Bone Marrow Donors for MSC Isolation and Expansion |
Morphological Evaluation
Volume and sphericity index (SI) were performed according to Kelm et al,35 using ImageJ program (Fiji, version 1.0) to calculate the area and perimeter from the photographs obtained from each of the 3D structures on day 5 (n = 88), 10 (n = 72) and 15 (n = 48).
Histological and Immunohistochemical (IHQ) Analysis
Pathology Department at the Hospital Universitario San Ignacio (HUSI) (Bogotá, Colombia) supported the development of histochemical tests. 3D-MS were fixed with formaldehyde, dehydrated with ethanol, cleared with xylenes (Thermo Scientific™ Excelsior™ AS Tissue Processor), embedded in paraffin (Thermo Scientific™ HistoStar™ Embedding Workstation) and sectioned into 3 μm thick sections with a microtome (Leica® RM2125 RTS). Serial slides of 3D structures sections were then processed with hematoxylin and eosin (H&E), anti-Ki67 (Flex Ki-67 antigen, MxH/MIB-1, Dako®) and anti-vimentin (Flex vimentinMx/V9, Dako®).
Cell Viability and Hematopoietic Antigens Evaluation
LIVE/DEAD® Cell Imaging Kit (R37601 Thermo Scientific®) was used following the manufacturer’s instructions. This viability staining was performed on the complete and living 3D structure. For hematopoietic antigens, 3D-MS serial slides were incubated at room temperature with primary antibodies (Anti-CD34 APC clone 581 Thermo Scientific®, anti-Ki67 clone 4A1 Thermo Scientific®, anti-CD133 clone AC133 Miltenyi Biotec®, anti-CD33 clone WM53ThermoScientific® and anti-CD7 clone MEM-186, Thermo Scientific®). Alexa Fluor 514 goat anti-mouse IgG (Thermo Scientific®) was used as a secondary antibody for CD133, CD33 or CD7 detection. Anti-α-tubulin (Alexa Fluor 488 clone B512, Invitrogen®) was used for cytoskeletal labeling, and DAPI (4ʹ,6-diamidino-2-phenylindole, ref D1306, Invitrogen®) was used for nuclei identification. Slide-mounted 3D structure sections were sealed with 10 μL of ProLong Gold antifade reagent (Invitrogen®) and covered with coverslips.
Reactive Oxygen Species (ROS) Evaluation
3D structure sections were treated with CellROX™ Deep Red Reagent (Thermo Scientific®) at room temperature. The cells were fixed with 3.7% formaldehyde, permeabilized with 0.1% Triton X-100, and stained with anti-α-tubulin and DAPI following the protocol mentioned above.
Image Acquisition and Analysis Strategy for Confocal Microscopy
An Olympus FV1000 confocal microscope with 488-, 543-, 635- and 405-nm lasers was used to collect images of sphere and sphere sections. Viability imaging and ROS imaging was performed using a UPLFLN 20X objective with a numerical aperture (NA) of 0.50 every 5μm to generate reconstructions in XYZ planes. Between 25 and 30 images were obtained to assess viability (complete spheres), and 15 to 20 images were obtained to assess ROS (sphere sections). For proliferation and hematopoietic phenotype modulation, Z stack images of sphere sections were collected with UPLSAPO 60X and UPLFLN 20X objectives using an NA of 1.35 in the XY focal plane. 3D reconstruction and data analysis were performed with FlowView (Olympus®) and Fiji 1.0, respectively. For the evaluation of viability, the percentage of green area (living cells) and red area (dead cells) was calculated in separate channels using the “threshold” and “analyze particles” tools to select the estimated area for each color. Hematopoietic antigens and ROS were calculated using the following equation: 

Statistical Analysis
Shapiro–Wilk tests were applied to determine the normality of the data. The comparisons between two samples were made using Wilcoxon tests. For the comparison of more than three groups of data, Kruskal–Wallis (KW) tests, Friedman test with Dunn’s test was used. All the data were analyzed and plotted with GraphPad Prism 6™ software. * p = 0.05, ** p = 0.01, and *** p = 0.001.
Results
Structure and Viability of 3D Cultures
After 15 days in culture, homogeneous 3D structures were obtained under the three oxygen conditions; mesenchymal cells control formed by fibroblasts, hematopoietic cells and endothelial cells reached a larger size (Fb-HSC-EC) (Figure 1). The volumes of MSC-HSC-EC were between 0.1 and 0.5 mm3 in all culture conditions and the sphericity index (SI) was between 0.6 and 0.8 during 15 days. Fb-HSC-EC 3D structures had an approximate volume between 1.7 and 7.5 mm3 at day 10 of culture and between 3.0 and 10.5 mm3 after 15 days, with a sphericity between 0.4 and 0.8. Some variations in size and sphericity were observed between oxygen culture concentrations, although significant differences were observed in the volume of the 3D structure between the MSC-HSC-EC condition versus controls at day 5 (Figure 2). All evaluated 3D structures had a viability >80%, and no significant differences were found in cell viability between experimental organoid prototype and controls (p > 0.9999) (Figure 3).
 |
Figure 1 Structure of 3D cultures. Structures at days 5, 10 and 15 in three O2 conditions (1%, 3% and 21% O2 levels). (A) Experimental condition: MSC-HSC-EC, (B) Endothelial cells control: MSC-HSC, (C) Mesenchymal cells control: Fb-HSC-EC. (Olympus® CKX31, 10×) (scale bar: 100 μm). |
 |
Figure 2 Volume and sphericity index (SI) of 3D cultures. (A–C) Volume after 5, 10 and 15 days. Friedman tests were performed to compare O2 concentrations: 5, 10 and 15 days. Friedman tests were performed to compare MSC-HSC-EC structures and controls: 5 days (p=0.0278), 10 days and 15 days (p>0.,05). (D–F) Sphericity Index (SI) after 5, 10 and 15 days. Friedman tests were performed to compare O2 concentrations and MSC-HSC-EC structures vs controls after 5, 10 and 5 days (p>0.,05). |
 |
Figure 3 Viability of 3D cultures. (A and B) Cell viability in 1% O2, (C and D) Cell viability in 3% O2, (E and F) Cell viability 21% O2. (B, D, F) LIVE/DEAD® viability kit. Red: dead cells, Green: live cells. Olympus confocal microscope FV1000, 20× (scale bar: 100μm). |
Histology and Immunohistochemistry
H&E staining demonstrated that all evaluated 3D-MS showed a cellular organization similar to that found in tissue (Figure 4A). Brown areas were accumulations of metallic nanoparticles in the extracellular matrix of the structure. There was no evidence of a necrotic center in 3D structures (Figure 4A). Vimentin expression was strongly positive compared to controls (Figure 4B–D).
 |
Figure 4 Histological characterization of 3D structures. (A) Hematoxylin and eosin stain (20×, Olympus® CX21), (B) Vimentin expression of MSC-HSC-EC structures after 15d with 3% O2 (20×, Olympus® CX21), (C) Negative control for vimentin (brain tissue) (10×, Olympus® CX21), (D) Positive control for vimentin (lymph node tissue) (10×, Olympus® CX21). |
Evaluation of Proliferation and Phenotype Modulation of Human HSC in 3D Structures
A lower expression of Ki67 was observed in cultures with 1% O2 but Ki67 expression by immunochemistry was not conclusive because the nanoparticles did not allow the protein to be visualized in the nucleus (Figure 5A–D). Global expression of Ki67 by confocal microscopy allowed to demonstrate significant differences between the oxygen conditions, especially in MSC-HSC-EC structure exposed to the lowest levels (1–3%) (Figure 5E and F). After 15 days, MSC-HSC-EC structure showed a higher expression of CD34 antigen with 1% O2 in comparison with 21% O2 (Figure 6A and B). For the CD133 antigen there was a higher expression at 3% and 1% O2 than there was at 21%, and it was generally shown that there was higher expression in experimental MSC-HSC-EC than there was in the controls (Figure 6C and D). Regarding the expression of CD33, there was a statistically significant difference in the MSC-HSC-EC structures maintained at 21% and 1% O2 (Figure 6E and F). For the CD7 antigen, there tended to be greater expression at 3% and 1% O2, with statistically significant differences in the MSC-HSC-EC structure between 21% and 1% O2 (Figure 6G and H).
 |
Figure 5 Ki67 expression in 3D structures. (A and B) Ki67 expression of MSC-HSC-EC structures after 15 days and 1% O2 by immunochemistry (arrows) (100×, Olympus® CX21), (C) Ki67 negative control by immunochemistry (brain tissue) (10×, Olympus® CX21), (D) Ki67 positive control by immunochemistry (lymph node tissue) (10×, Olympus® CX21), (E) Ki67 expression by confocal microscopy (percentage area of expression), (F) Paraffin section (3 μm thick) of MSC-HSC-EC structure analyzed by confocal microscopy (Magenta: Ki67, green: α-tubulin, and blue: DAPI-nuclei) (40×, Olympus confocal microscope FV1000). |
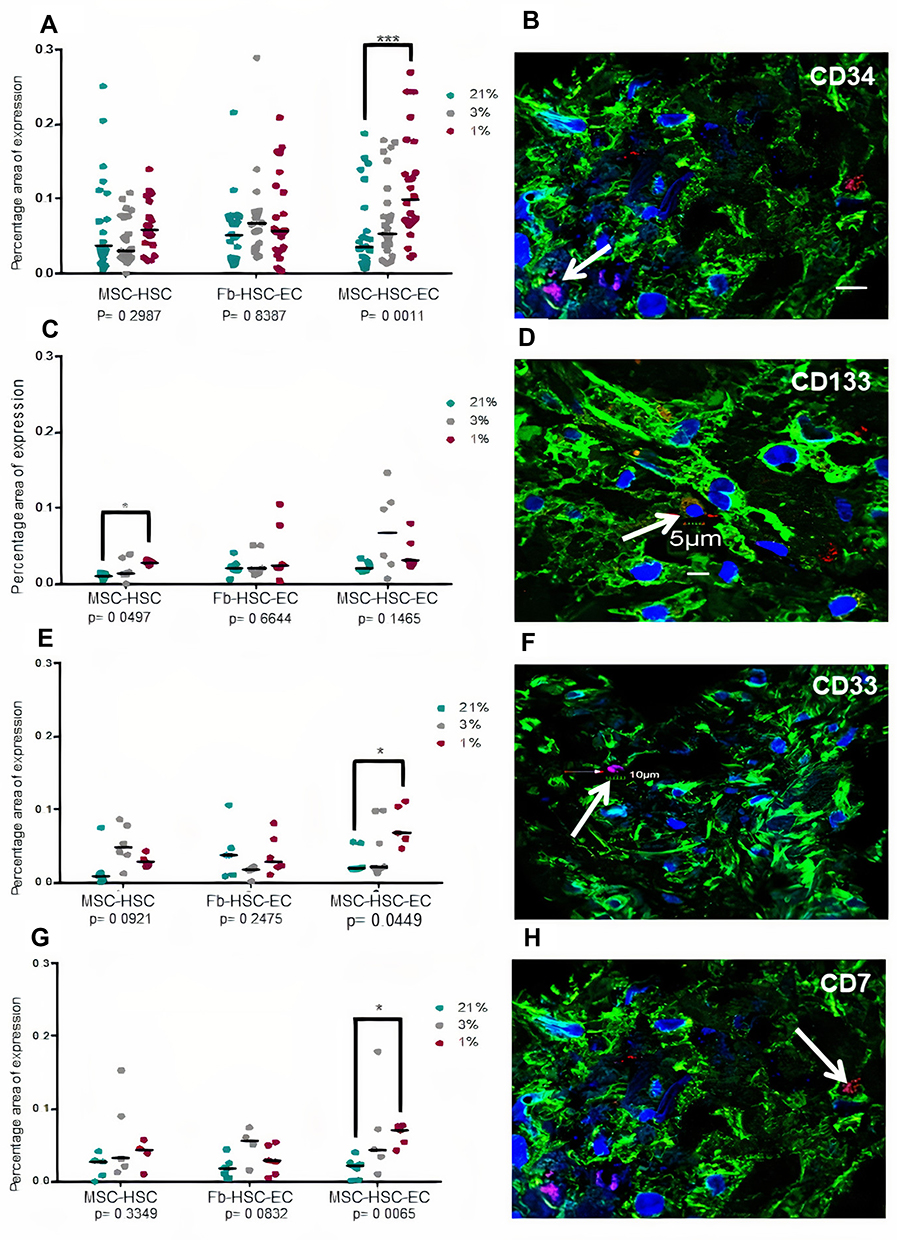 |
Figure 6 Hematopoietic antigens expression in 3D structures. (A and B) CD34 antigen, (C and D) CD133 antigen, (E and F) CD33 antigen, (G and H) CD7. (B, D, F, H) Paraffin section (3 μm thick) of MSC-HSC-EC structure analyzed by confocal microscopy after 15 days. Magenta or red: hematopoietic antigen (arrows), green: α-tubulin, and blue: DAPI-nuclei (40X, Olympus confocal microscope FV1000). |
Reactive Oxygen Species
No statistically significant differences were found in ROS production between experimental and control 3D-MS. Nevertheless, although no statistically significant differences were found in ROS production with different oxygen conditions (p = 0.1944, Friedman test), a lower production was observed in 3D-MS with 1% O2 (Figure 7).
 |
Figure 7 ROS levels in 3D structures. (A) ROS expression area in structures cultivated in 1%, 3% and 21% O2. Differences between MSC-HSC-EC and controls, P> 0.9999, as determined by Friedman tests; differences between O2 concentrations, P = 0.1944, as determined by Friedman tests. (B) Paraffin section (3 μm thick) of MSC-HSC-EC culture stained with CellROX®. Green: α-Tubulin, blue: DAPI (nuclei), and red: ROS (20×, Olympus confocal microscope FV1000). |
Discussion and Conclusions
The niche of human HSCs in bone marrow is influenced by different cell populations; however, the perivascular niche (MSC and ECs) is increasingly important given the different phenomena that occur there and that are related to functional hematopoiesis.36,37 In this work, we used the synergistic relationship between MSCs and ECs with different concentrations of O2 on human HSCs in 3D-MS,38 enabling the in vitro study of human HSC microenvironment.
In relation to the structure of the 3D-MS obtained, it has been previously shown that under hypoxic conditions (2–3% O2), various cell populations could increase the expression of adhesion molecules.39,40 The MSC-HSC-EC structures showed a similar sphericity index (0.6–0.8) after 5, 10 and 15 days of culture at all oxygen concentrations; however, in the controls, the sphericity index fluctuated according to the culture time and O2 concentration (Figure 2). These results could possibly be related to a synergistic effect between oxygen levels and the interaction between MSCs, HSCs and ECs on the expression of adhesion molecules that is not observed in the condition with Fb or without ECs; however, addressing this possibility requires the determination of adhesion molecules that act in the 3D structure.
Interestingly, and contrary to other models of 3D cultures, we do not observe a necrotic center inside the structures. Necrotic centers in these types of structures appear in spheres with volume between 0.112 ± 0.013 mm341,42; however, the average volume of the 3D-MS generated in this work was between 0.1 and 0.5 mm3 (MSC-HSC-CE). We propose that the absence of necrotic centers in the obtained spheres is possibly related to the secretion of soluble factors of the three cell populations and is promoted by their cell–cell interaction, which maintains the internal viability of the 3D structure and high expression of vimentin in all experimental conditions (Figures 3 and 4).
In this work, we demonstrate the effect of physiological oxygen levels of the human bone marrow (1% and 4%),27 which some call hypoxia, on the proliferation and modulation of the human HSC phenotype. Statistically significant differences were observed in Ki67 expression levels in the different experimental conditions and controls (confocal microscopy) (Figure 5E and F) with greater expression of Ki67 at 1% and 3% O2 in comparison with 21%. Interestingly, we show that oxygen levels between 1% and 3% increase the expression of CD34, CD133, CD33 and CD7 over the levels observed in conventional culture conditions (21% oxygen), which suggests synergy with MSCs and ECs, given that this increase was greater in the MSC-HSC-Ec condition (experimental 3D-MS) (Figure 6).
Previous studies have shown that the increase in the expression of CD34 and CD133 in human HSCs is associated with a greater capacity of repopulation of these cells in models of immunodeficient mice.43,44 Similarly, although the expression of CD33 and CD7 is associated with myeloid and lymphoid progenitors, respectively, it has been shown that the expression of CD33 in human HSCs from umbilical cord blood is also associated with long-term culture capacity (LTC-IC).45,46
We propose in this work that the 3D-MS formed by MSCs, ECs and HSCs exposed to low concentrations of oxygen (1–3% O2) modulate human HSC expression of hematopoietic antigens associated with the engraftment and stemness capacity in an environment with low ROS levels (Figure 7), and although ROS levels were detected globally and statistically significant differences were not determined, a lower production was observed in 3D-MS with 1% O2, it has been described that this “hypoxic” environment favors the maintenance of the long-term primitive human HSC pool and mimics some features of the perivascular niche of human HSCs.
The development of human 3D-MS that mimic the microenvironment of HSCs has great potential because they may allow the testing of new drugs for the treatment of diseases such as leukemia, reduce the use of animal models, and deepen our understanding of the relationship between the microenvironment of the HSC and the evolution of different human hematological diseases.
Abbreviations
3D-MS, 3D multicellular spheroid, HSC, hematopoietic stem cells, MSCs, mesenchymal stromal cells; ECs, endothelial cells.
Acknowledgments
The authors would like to thank the entities COLCIENCIAS (MinCIENCIAS) and Pontificia Universidad Javeriana for the financing of this project and the voluntary donors from Hospital Universitario San Ignacio (Bogotá, Colombia) who participated in the study.
Disclosure
The authors declare no conflicts of interest.
References
1. Kaushansky K. Lineage-specific hematopoietic growth factors. N Engl J Med. 2006;354(19):2034–2045. doi:10.1056/NEJMra052706
2. Wei Q, Frenette PS. Niches for hematopoietic stem cells and their progeny. Immunity. 2018;48(4):632–648. doi:10.1016/j.immuni.2018.03.024
3. Lo Celso C, Fleming HE, Wu JW, et al. Live-animal tracking of individual haematopoietic stem/progenitor cells in their niche. Nature. 2009;457(7225):92–96. doi:10.1038/nature07434
4. Morrison SJ, Scadden DT. The bone marrow niche for haematopoietic stem cells. Nature. 2014;505(7483):327–334. doi:10.1038/nature12984
5. Ding L, Morrison SJ. Haematopoietic stem cells and early lymphoid progenitors occupy distinct bone marrow niches. Nature. 2013;495(7440):231–235. doi:10.1038/nature11885
6. Koechlein CS, Harris JR, Lee TK, et al. High-resolution imaging and computational analysis of haematopoietic cell dynamics in vivo. Nat Commun. 2016;7:12169. doi:10.1038/ncomms12169
7. Spencer JA, Ferraro F, Roussakis E, et al. Direct measurement of local oxygen concentration in the bone marrow of live animals. Nature. 2014;508(7495):269–273. doi:10.1038/nature13034
8. Itkin T, Gur-Cohen S, Spencer JA, et al. Distinct bone marrow blood vessels differentially regulate haematopoiesis. Nature. 2016;532(7599):323–328. doi:10.1038/nature17624
9. Asada N, Kunisaki Y, Pierce H, et al. Differential cytokine contributions of perivascular haematopoietic stem cell niches. Nat Cell Biol. 2017;19(3):214–223. doi:10.1038/ncb3475
10. Asada N, Takeishi S, Frenette PS. Complexity of bone marrow hematopoietic stem cell niche. Int J Hematol. 2017;106(1):45–54. doi:10.1007/s12185-017-2262-9
11. Mendez-Ferrer S, Michurina TV, Ferraro F, et al. Mesenchymal and haematopoietic stem cells form a unique bone marrow niche. Nature. 2010;466(7308):829–834. doi:10.1038/nature09262
12. Kunisaki Y, Bruns I, Scheiermann C, et al. Arteriolar niches maintain haematopoietic stem cell quiescence. Nature. 2013;502(7473):637–643. doi:10.1038/nature12612
13. Schepers K, Campbell TB, Passegue E. Normal and leukemic stem cell niches: insights and therapeutic opportunities. Cell Stem Cell. 2015;16(3):254–267. doi:10.1016/j.stem.2015.02.014
14. Omatsu Y, Sugiyama T, Kohara H, et al. The essential functions of adipo-osteogenic progenitors as the hematopoietic stem and progenitor cell niche. Immunity. 2010;33(3):387–399. doi:10.1016/j.immuni.2010.08.017
15. Ding L, Saunders TL, Enikolopov G, Morrison SJ. Endothelial and perivascular cells maintain haematopoietic stem cells. Nature. 2012;481(7382):457–462. doi:10.1038/nature10783
16. Rafii S, Shapiro F, Pettengell R, et al. Human bone marrow microvascular endothelial cells support long-term proliferation and differentiation of myeloid and megakaryocytic progenitors. Blood. 1995;86(9):3353–3363. doi:10.1182/blood.V86.9.3353.bloodjournal8693353
17. Winkler IG, Barbier V, Nowlan B, et al. Vascular niche E-selectin regulates hematopoietic stem cell dormancy, self renewal and chemoresistance. Nat Med. 2012;18(11):1651–1657. doi:10.1038/nm.2969
18. Kobayashi H, Butler JM, O’Donnell R, et al. Angiocrine factors from Akt-activated endothelial cells balance self-renewal and differentiation of haematopoietic stem cells. Nat Cell Biol. 2010;12(11):1046–1056. doi:10.1038/ncb2108
19. Butler JM, Gars EJ, James DJ, Nolan DJ, Scandura JM, Rafii S. Development of a vascular niche platform for expansion of repopulating human cord blood stem and progenitor cells. Blood. 2012;120(6):1344–1347. doi:10.1182/blood-2011-12-398115
20. Zhang P, Zhang C, Li J, Han J, Liu X, Yang H. The physical microenvironment of hematopoietic stem cells and its emerging roles in engineering applications. Stem Cell Res Ther. 2019;10(1):327. doi:10.1186/s13287-019-1422-7
21. Flores-Figueroa E, Varma S, Montgomery K, Greenberg PL, Gratzinger D. Distinctive contact between CD34+ hematopoietic progenitors and CXCL12+ CD271+ mesenchymal stromal cells in benign and myelodysplastic bone marrow. Lab Invest. 2012;92(9):1330–1341. doi:10.1038/labinvest.2012.93
22. Tormin A, Li O, Brune JC, et al. CD146 expression on primary nonhematopoietic bone marrow stem cells is correlated with in situ localization. Blood. 2011;117(19):5067–5077. doi:10.1182/blood-2010-08-304287
23. Pinho S, Lacombe J, Hanoun M, et al. PDGFRalpha and CD51 mark human nestin+ sphere-forming mesenchymal stem cells capable of hematopoietic progenitor cell expansion. J Exp Med. 2013;210(7):1351–1367. doi:10.1084/jem.20122252
24. Li H, Ghazanfari R, Zacharaki D, et al. Low/negative expression of PDGFR-alpha identifies the candidate primary mesenchymal stromal cells in adult human bone marrow. Stem Cell Rep. 2014;3(6):965–974. doi:10.1016/j.stemcr.2014.09.018
25. van Pel M, Fibbe WE, Schepers K. The human and murine hematopoietic stem cell niches: are they comparable? Ann N Y Acad Sci. 2016;1370(1):55–64. doi:10.1111/nyas.12994
26. Tiwari A, Wong CS, Nekkanti LP, et al. Impact of oxygen levels on human hematopoietic stem and progenitor cell expansion. Stem Cells Dev. 2016;25(20):1604–1613. doi:10.1089/scd.2016.0153
27. Wielockx B, Grinenko T, Mirtschink P, Chavakis T. Hypoxia pathway proteins in normal and malignant hematopoiesis. Cells. 2019;8(2):155. doi:10.3390/cells8020155
28. Nombela-Arrieta C, Pivarnik G, Winkel B, et al. Quantitative imaging of haematopoietic stem and progenitor cell localization and hypoxic status in the bone marrow microenvironment. Nat Cell Biol. 2013;15(5):533–543. doi:10.1038/ncb2730
29. Mejia-Cruz CC, Barreto-Duran E, Pardo-Perez MA, et al. Generation of organotypic multicellular spheres by magnetic levitation: model for the Study of Human Hematopoietic Stem Cells Microenvironment. Int J Stem Cells. 2019;12(1):51–62. doi:10.15283/ijsc18061
30. Rodriguez-Pardo VM, Fuentes-Lacouture MF, Aristizabal-Castellanos JA, Vernot Hernandez,JP. Aislamiento y caracterización de células “stem” mesenquimales de médula ósea humana según criterios de la Sociedad Internacional de Terapia Celular. [Isolation and characterization of mesenchymal stem cells from human bone marrow according to the criteria of the International Society for Cellular Therapy]. Univ Sci. 2010;15(3):224–239. doi:10.11144/javeriana.SC15-3.iaco
31. Flechas I, Mera C, Vargas L, Rodríguez-Pardo VM. Evaluación de proteínas relacionadas con la diferenciación de células madre hematopoyéticas CD34+ obtenidas de sangre de cordón umbilical. [Evaluation of proteins related to the differentiation of CD34+ hematopoietic stem cells from the umbilical cord]. Rev Cubana Hematol Inmunol Hemoter. 2008;24:1–17.
32. Rodríguez VM, Cuellar A, Cuspoca LM, Contreras CL, Mercado M, Gómez A. Determinacion Fenotipica de Subpoblaciones de celulas madre derivadas de sangre de cordon umbilical. [Phenotypical determinants of stem cell subpopulations derived from human umbilical cord blood]. Biomédica. 2006;26:51–60. doi:10.7705/biomedica.v26i1.1394
33. Barreto-Duran E, Mejia-Cruz CC, Leal-Garcia E, Perez-Nunez R, Rodriguez-Pardo VM. Impact of donor characteristics on the quality of bone marrow as a source of mesenchymal stromal cells. Am J Stem Cells. 2018;7(5):114–120.
34. Rodriguez-Pardo VM, Vernot JP. Mesenchymal stem cells promote a primitive phenotype CD34+c-kit+ in human cord blood-derived hematopoietic stem cells during ex vivo expansion. Cell Mol Biol Lett. 2013;18(1):11–33. doi:10.2478/s11658-012-0036-1
35. Kelm JM, Timmins NE, Brown CJ, Fussenegger M, Nielsen LK. Method for generation of homogeneous multicellular tumor spheroids applicable to a wide variety of cell types. Biotechnol Bioeng. 2003;83(2):173–180. doi:10.1002/bit.10655
36. Pinho S, Frenette PS. Haematopoietic stem cell activity and interactions with the niche. Nat Rev Mol Cell Biol. 2019;20(5):303–320.
37. Szade K, Gulati GS, Chan CKF, et al. Where hematopoietic stem cells live: the bone marrow Niche. Antioxid Redox Signal. 2018;29(2):191–204. doi:10.1089/ars.2017.7419
38. Lehmann R, Lee CM, Shugart EC, et al. Human organoids: a new dimension in cell biology. Mol Biol Cell. 2019;30(10):1129–1137. doi:10.1091/mbc.E19-03-0135
39. Kilburn BA, Wang J, Duniec-Dmuchowski ZM, Leach RE, Romero R, Armant DR. Extracellular matrix composition and hypoxia regulate the expression of HLA-G and integrins in a human trophoblast cell line. Biol Reprod. 2000;62(3):739–747. doi:10.1095/biolreprod62.3.739
40. Kong T, Eltzschig HK, Karhausen J, Colgan SP, Shelley CS. Leukocyte adhesion during hypoxia is mediated by HIF-1-dependent induction of beta2 integrin gene expression. Proc Natl Acad Sci U S A. 2004;101(28):10440–10445. doi:10.1073/pnas.0401339101
41. Zanoni M, Piccinini F, Arienti C, et al. 3D tumor spheroid models for in vitro therapeutic screening: a systematic approach to enhance the biological relevance of data obtained. Sci Rep. 2016;6:19103. doi:10.1038/srep19103
42. Mueller-Klieser WF, Sutherland RM. Oxygen tensions in multicell spheroids of two cell lines. Br J Cancer. 1982;45(2):256–264. doi:10.1038/bjc.1982.41
43. Jiang M, Chen H, Lai S, et al. Maintenance of human haematopoietic stem and progenitor cells in vitro using a chemical cocktail. Cell Discov. 2018;4:59. doi:10.1038/s41421-018-0059-5
44. Drake AC, Khoury M, Leskov I, et al. Human CD34+ CD133+ hematopoietic stem cells cultured with growth factors including Angptl5 efficiently engraft adult NOD-SCID Il2rgamma-/- (NSG) mice. PLoS One. 2011;6(4):e18382. doi:10.1371/journal.pone.0018382
45. Pearce DJ, Taussig DC, Bonnet D. Implications of the expression of myeloid markers on normal and leukemic stem cells. Cell Cycle. 2006;5(3):271–273. doi:10.4161/cc.5.3.2393
46. Knapp D, Hammond CA, Hui T, et al. Single-cell analysis identifies a CD33(+) subset of human cord blood cells with high regenerative potential. Nat Cell Biol. 2018;20(6):710–720. doi:10.1038/s41556-018-0104-5
 © 2021 The Author(s). This work is published and licensed by Dove Medical Press Limited. The
full terms of this license are available at https://www.dovepress.com/terms
and incorporate the Creative Commons Attribution
- Non Commercial (unported, 3.0) License.
By accessing the work you hereby accept the Terms. Non-commercial uses of the work are permitted
without any further permission from Dove Medical Press Limited, provided the work is properly
attributed. For permission for commercial use of this work, please see paragraphs 4.2 and 5 of our Terms.
© 2021 The Author(s). This work is published and licensed by Dove Medical Press Limited. The
full terms of this license are available at https://www.dovepress.com/terms
and incorporate the Creative Commons Attribution
- Non Commercial (unported, 3.0) License.
By accessing the work you hereby accept the Terms. Non-commercial uses of the work are permitted
without any further permission from Dove Medical Press Limited, provided the work is properly
attributed. For permission for commercial use of this work, please see paragraphs 4.2 and 5 of our Terms.