")
Back to Journals » Pharmacogenomics and Personalized Medicine » Volume 17
Three Liquid-Liquid Phase Separation-Related Genes Associated with Prognosis in Glioma
Authors Lv L, Zhang X, Liu Y, Zhu X, Pan R, Huang L
Received 25 September 2023
Accepted for publication 16 March 2024
Published 22 April 2024 Volume 2024:17 Pages 171—181
DOI https://doi.org/10.2147/PGPM.S442000
Checked for plagiarism Yes
Review by Single anonymous peer review
Peer reviewer comments 2
Editor who approved publication: Dr Martin H Bluth
Ling Lv,1 Xin Zhang,1 Yajun Liu,1 Xutong Zhu,2 Ruihan Pan,1 Lifa Huang1
1Department of Neurosurgery, the First Affiliated Hospital of Zhejiang Chinese Medical University (Zhejiang Provincial Hospital of Chinese Medicine), Hangzhou, Zhejiang, People’s Republic of China; 2The First School of Clinical Medicine, Zhejiang Chinese Medical University, Hangzhou, Zhejiang, People’s Republic of China
Correspondence: Lifa Huang, Department of Neurosurgery, the First Affiliated Hospital of Zhejiang Chinese Medical University (Zhejiang Provincial Hospital of Chinese Medicine), No. 54 Youdian Road, Hangzhou, 310006, People’s Republic of China, Tel/Fax +86-57186620251, Email [email protected]
Purpose: Dysregulated liquid-liquid phase separation (LLPS) instigates tumorigenesis through biomolecular condensate dysfunction. However, the association between LLPS-associated genes and glioma remains underexplored.
Patients and Methods: Differentially expressed genes (DEGs) of glioma were obtained from the GSE50161 dataset, including 34 glioma and 13 normal samples. We analyzed differentially expressed LLPS-related genes in glioma from public databases. These genes informed refined molecular subtyping on the TCGA-glioma dataset. CIBERSORT assessed immune cell infiltration across three subclusters. A prognostic model was devised using univariate and lasso Cox regressions on intersecting genes. Prognostic gene expression was validated in glioma cells via RT-qPCR.
Results: A total of 673 differentially expressed LLPS-associated genes were identified in glioma. Three distinct molecular subtypes (C1, C2, and C3) of glioma were obtained with a marked variance in the expression of immune checkpoint genes PD1 and PDL1. Differences in immune cell infiltration were observed across subtypes. In addition, a tri-gene prognostic signature (TAGLN2, NTNG2, and IGF2BP2) was derived with significant survival differences between high and low-risk groups. The prognostic model displayed impressive AUC values for 1, 3, and 5-year survival in both training and validation sets. Further analysis highlighted a notable correlation between the three prognostic genes and immune cells in glioma samples. Furthermore, we found the upregulation of TAGLN2 and IGF2BP2 and the downregulation of NTNG2 in glioma tumors and cells.
Conclusion: This study innovatively uncovers the significant role of LLPS-related genes in glioma tumor grading and prognosis. The constructed tri-gene prognostic model holds promise for enhancing personalized prognosis assessments and optimizing immunotherapy strategies for glioma patients.
Keywords: liquid-liquid phase separation, glioma, prognostic model, molecular subtype, immune cell infiltration
Introduction
Liquid-liquid phase separation (LLPS) is an intrinsic biophysical process within the cellular environment, leading to the formation of membrane-less compartments characterized by concentrated proteins and RNA molecules.1 LLPS underlies the genesis of numerous membraneless organelles, including stress granules, processing bodies (P-bodies), and nuclear speckles. By orchestrating specific biological macromolecules into discrete membraneless compartments, cells can adeptly execute vital functions such as chromatin restructuring, and the regulation of gene transcription and translation.2 LLPS is instrumental for many physiological functions, and its dysregulation can lead to pathological conditions. For example, pharmacological modulation of LLPS within the core regulatory circuitry attenuates metastatic potential and reverses chemoresistance in osteosarcoma.3 The induction of ILF3 liquid–liquid phase separation promotes esophageal cancer progression.4 Aberrant phase separation has been implicated in several diseases, including neurodegenerative disorders and cancers.5–7 Thus, we believe that investigating the role of LLPS in oncology could enhance our comprehension of tumor pathogenesis, improve prognosis prediction, and refine personalized treatment choices.
Glioma represents the most prevalent malignant primary brain tumor, constituting over 81% of central nervous system malignancies.8,9 Originating from glial or precursor cells, it typically evolves into astrocytoma, oligodendroglioma, ependymoma, or oligoastrocytoma.10 Significant heterogeneities in glioma patient prognosis and therapeutic responses consistently pose major clinical challenges.11 Considering these challenges, our study sought to pinpoint these heterogeneities by examining the LLPS patterns in glioma patients. The variety of molecular subtypes is often related to the treatment and prognosis of patients. In this study, three molecular subtypes of glioma patients based on LLPS-related genes were identified with distinct prognosis and tumor immune microenvironment patterns. The prognostic model we developed demonstrated strong predictive capabilities for both prognosis and immune response. The present study is to reveal the correlation between LLPS-related genes and glioma progression. Our discoveries could pave the way for personalized prognosis assessment and optimized immunotherapy choices for glioma patients.
Materials and Methods
Data Collection
Gene expression profiling data of glioma was obtained from the dataset GSE50161 in the Gene Expression Omnibus (GEO) database.12 This dataset comprises expression data from 34 glioma samples and 13 normal samples. The data was generated on the GPL570 platform (Affymetrix Human Genome U133 Plus 2.0 array) that completely covers the Human Genome U133 Set plus 6500 additional genes for analysis of over 47,000 transcripts. The annotations for the probes were based on the “SOFT formatted family file” associated with the GPL570 platform. Transcriptomic expression profiles and the corresponding survival time data for glioma patients were sourced from the UCSC Xena database (http://xenabroswer.net/hub).13 This dataset encompassed a total of 529 patient samples. The obtained data was subsequently processed and integrated with the GSE50161 dataset for subsequent analyses referring to reported bioinformatics workflows.14,15
Screening for Differentially Expressed Genes (DEGs)
Gene expression data from the GSE50161 dataset was subjected to differential expression analysis using the limma package16 in R software version 4.2.2. Genes were deemed differentially expressed based on the criteria of a p-value < 0.05 and an absolute log2 fold change (|logFC|) > 1, with a Benjamini–Hochberg correction. LLPS-associated genes were curated from two databases: DrLLPS (http://llps.biocuckoo.cn/) and PhaSepDB (http://db.phasep.pro/). Duplicates were removed after the extraction of gene lists from both databases. To discern the genes that were both differentially expressed in the context of glioma and associated with LLPS, an intersection of the DEGs from GSE50161 and the LLPS-related genes was performed and visualized by Venn diagram.
Molecular Subtyping of Glioma
Based on the identified LLPS-related DEGs, the TCGA glioma dataset was subjected to molecular subtype identification using the ConsensusClusterPlus package17 in R version 4.2.2. ConsensusClusterPlus package has specialized application in consensus clustering analysis, particularly suited for high-dimensional data. The package offers simplicity in usage and provides various clustering algorithm options, including k-means, hierarchical clustering, and PAM. Notably, it supports running consensus clustering across different cluster numbers (k values), automatically selecting the optimal number, and offers visual tools such as trace plots and consensus matrices for result analysis. ConsensusClusterPlus package has been used for clustering analysis of glioma in previous studies.18,19 In our analysis, we set parameters as follows: maxK = 10, reps = 5, pItem = 1, pFeature = 1, clusterAlg = “km” (k-means), distance = “euclidean”, and seed = 2. As a result, three distinct molecular subtypes, C1, C2, and C3, were delineated. The association between these subtypes and the expression levels of PD1 and PDL1 was further explored.
Immune Cell Infiltration Analysis
CIBERSORT, grounded on the linear support vector regression algorithm, is adept at inferring the proportions of distinct immune cell types within a sample based on gene expression data.20 Utilizing the CIBERSORT algorithm in R version 4.2.2, we estimated the immune cell infiltration ratios for each sample in the TCGA glioma dataset. The immune cell signature genes used in our analysis were sourced from the specified benchmark database file (LM22.txt), which contains marker genes for 22 immune cell types.21 Additionally, we examined the disparities in immune cell infiltration levels across the three identified subtypes: C1, C2, and C3. Differences in immune cell infiltration levels across molecular subtypes were evaluated using the t-test statistical method. A p-value less than 0.05 was considered as indicative of a significant difference in immune cell infiltration between the two subtypes.
Selection of Survival-Associated Genes
The overall survival data utilized in our analysis were obtained from TCGA-LGG. Additional survival data, including progression-free interval, disease-specific survival, and more, can be accessed and downloaded from the UCSC Xena Hub (https://tcga-xena-hub.s3.us-east-1.amazonaws.com/download/survival%2FLGG_survival.txt). Incorporating patient survival data, a univariate Cox regression analysis was carried out on the LLPS-related DEGs genes using the survival package in R version 4.2.2. Applying a Log rank test with a threshold of p < 0.001, we pinpointed 312 genes that exhibited a significant association with survival duration. The stringent threshold of p < 0.001 was chosen to focus on the most compelling candidates and to mitigate potential false positives, contributing to the reliability and significance of our gene selection process.
Prognostic Model Construction and Validation
To avert the risk of overfitting in the constructed model, we randomly partitioned the TCGA glioma dataset, selecting 70% of the samples to serve as the training set and designating the remaining 30% as the validation set. The glmnet package in R version 4.2.2 was employed for lasso Cox multivariate regression, with the Log rank test for correction. We opted for the glmnet package due to its efficiency in adapting to various regression models, particularly in lasso Cox multivariate regression. The algorithm, driven by the regularization parameter lambda, swiftly computes parameters on the logarithmic scale. Glmnet’s speed is attributed to cyclic coordinate descent and Fortran subroutines. Parameter sets (n.seed = 4, nfolds = 7, split_train = 0.7, lasso.n = 11) were tailored for optimal performance in Cox regression analysis, considering the package’s versatility and computational efficiency. Leveraging the results of 7-fold cross-validation, the regularization parameter λ was set to lambda.1se. Subsequent Kaplan-Meier (KM) survival analysis and time-dependent ROC analysis were conducted on both the training and validation sets to validate the prognostic model.
Cell Culture
Human normal astrocytes HA1800 (Cat# YS1665C) and glioblastoma cell lines U87 (Cat# YS190C), U251 (Cat# YS301C), and SHG44 (Cat# YS266C) were purchased from the Y-J Biological, Shanghai, China. Cells were maintained in Dulbecco’s Modified Eagle Medium (DMEM) supplemented with 10% fetal bovine serum, 100 U/mL penicillin, and 100 μg/mL streptomycin. Cultures were kept in a humidified incubator at 37°C with 5% CO2. The medium was replaced every 2 days. Upon reaching an approximate confluence of 80–90%, cells were routinely passaged.
RT-qPCR
Total RNA was isolated from cells using the Trizol reagent (Invitrogen, USA), and then converted into complementary DNA (cDNA) using FastKing One-step Genomic cDNA First Strand Synthesis Premix Kit (TIANGEN, China). RT-qPCR was conducted in a real-time PCR machine using the SYBR Green PCR Master Mix (Lifeint, China) and using GAPDH as an internal reference. The sequence information of amplification primers is presented in Table 1. The relative transcription level of the target gene was calculated using the 2−ΔΔCT method. Experiments were performed in triplicate.
 |
Table 1 Primer Sequences |
Statistical Analysis
Experimental data were presented as mean ± standard deviation. Differences between groups were analyzed using one-way analysis of variance, followed by Tukey’s test. Statistical analyses were conducted using GraphPad 7.0 software, with p-values < 0.05 considered statistically significant.
Results
LLPS-Related Genes Differentially Expressed in Glioma
We conducted differential gene expression analysis on dataset GSE50161 of glioma. Based on a threshold of p < 0.05 and |logFC| > 1, we identified 3227 differentially expressed genes, among them, 1477 genes were down-regulated and 1750 were up-regulated in glioma compared to the normal samples (Figure S1A). These DEGs showed clearly different expression patterns in glioma and normal samples (Figure S1B). From the DrLLPS and PhaSepDB databases, a total of 3773 LLPS-related genes were recognized after removal of duplicates, including 356 upregulated and 317 downregulated genes (Figure S1C-D). By intersecting the set of LLPS-related genes with DEGs, we identified a common set of 673 genes (Figure 1).
 |
Figure 1 Intersection of liquid-liquid phase separation (LLPS)-related genes with glioma-related differentially expressed genes (DEGs), identifying a common set of 673 genes. |
Molecular Subtyping of Glioma
According to the identified differentially expressed LLPS-related genes, a refined disease subtyping was performed on the TCGA-glioma dataset. Setting the cluster count (k) to three, three distinct molecular subtypes (C1, C2, and C3) of glioma were obtained (Figure 2A). C1, C2, and C3 contains 263, 109, and 157 glioma samples, respectively. The optimal number of clusters was determined by the cumulative distribution function (CDF), and we observed relatively stable clustering when k = 3 (Figure 2B). Principal component analysis (PCA) indicated a significant difference among three clusters (Figure 2C). Further analysis of the prognostic characteristics of these three molecular subtypes showed that the prognosis of C1 and C3 was poor, and the prognosis of C2 was good, with significant differences (p < 0.0001, Figure 2D). We further delved into the interplay between these subtypes and the expression levels of the immune checkpoint genes PD1 and PDL1. A marked variance in the expression of PD1 and PDL1 was evident across the three molecular subtypes (t-test, p < 0.001). The expression of PD1 and PDL1 was significantly higher in C2 than those in C1 and C3 (p < 0.001, Figure 2E and F).
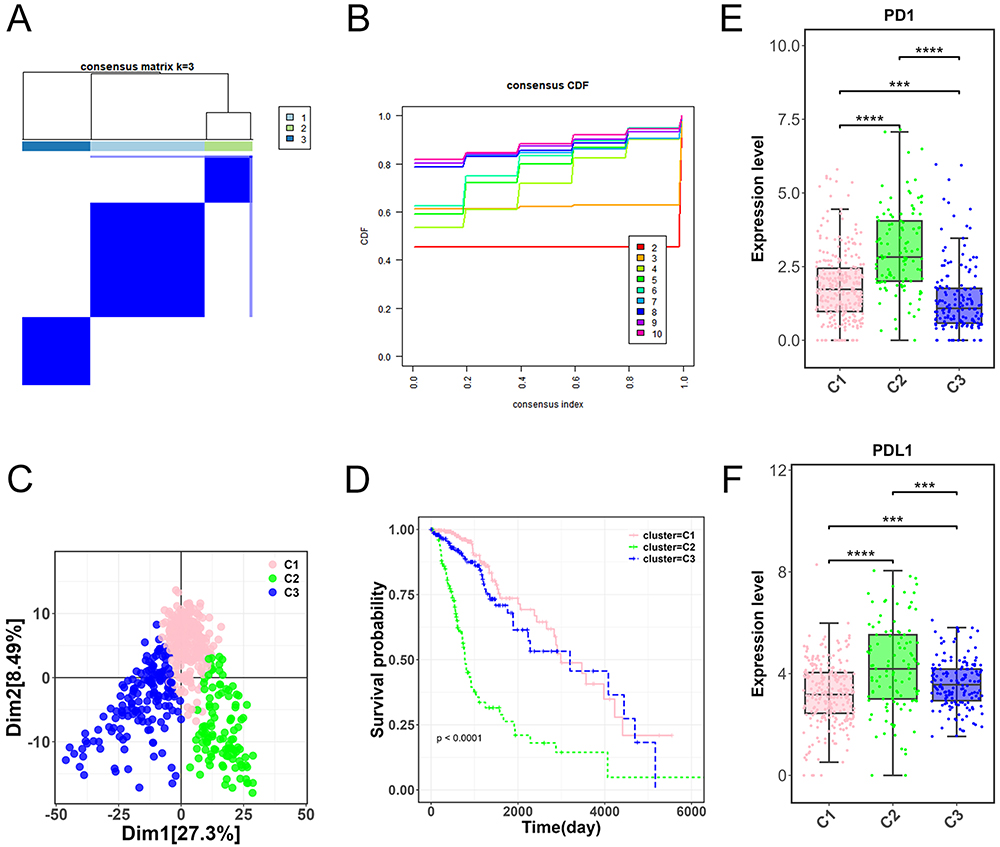 |
Figure 2 Molecular subtyping and analysis of glioma samples. (A) Three distinct molecular subtypes (C1, C2, and C3) derived from the TCGA-glioma dataset. (B) Cumulative distribution function (CDF) displaying the optimal clustering stability at k = 3. (C) Principal component analysis (PCA) demonstrating significant differentiation among the C1, C2, and C3 glioma molecular subtypes. (D) Prognostic characteristics of C1, C2, and C3 molecular subtypes. (E-F) Expression levels of immune checkpoint genes PD1 and PDL1 across the three molecular subtypes. ***p < 0.001, ****p < 0.0001. |
Immune Infiltration Among Three Molecular Subtypes
We further analyzed the immune cell infiltration level and immune function level of the three subclusters. As expected, we observed that C2 had more immune cell infiltration and immune response (Figure 3). CIBERSORT analysis results showed that the infiltration level of resting dendritic cells, eosinophils, M0 macrophages, M1 macrophages, monocytes, neutrophils, plasma cells, naive CD4 T cells, and follicular helper T cells in C2 was higher than those in C1 and C3 (p < 0.05, Figure S2). The infiltration levels of naive B cells, activated mast cells, resting mast cells, activated NK cells, resting NK cells, activated memory CD4 T cells, resting memory CD4 T cells, CD8 T cells, delta gamma T cells, and regulatory T cells (Tregs) in C2 was lower than those in C1 and C3 (p < 0.0001, Figure S3).
 |
Figure 3 Immune cell infiltration and immune response levels among the three glioma molecular subtypes. |
Construction and Performance Evaluation of the Prognostic Model
By integrating patient survival time data, a univariate Cox regression analysis was performed on the 673 intersecting genes. Based on a Log rank test with a threshold of p < 0.001, 312 genes were identified as significantly correlated with survival duration. Through the lasso Cox regression, we discerned a composite prognostic signature comprising three genes (TAGLN2, NTNG2, and IGF2BP2) from the 312 survival-correlated genes (Figure 4A). The univariate Cox regression analysis for 312 survival-correlated genes was displayed in Figure S4. The risk score equation derived from the three genes is:
 |
Figure 4 Prognostic evaluation based on selected genes and risk assessment. (A) Prognostic signature derived from three genes (TAGLN2, NTNG2, and IGF2BP2) identified from the intersecting gene set. (B-C) Kaplan-Meier survival curves representing high and low-risk groups from both training and validation sets. The accompanying Receiver Operating Characteristic (ROC) analysis highlights the prognostic accuracy of the model. |
risk_score = 0.025*TAGLN2 - 0.206*NTNG2 + 0.069*IGF2BP2.
Based on this risk score equation, samples with scores above the median were categorized as high-risk, while the remainder were designated as low-risk. To mitigate the risk of overfitting in the predictive model, we randomly selected 70% of the samples from the glioma TCGA dataset to serve as the training set for model construction, with the remaining 30% designated as the validation set. The KM showed significant survival differences between high and low-risk groups in both training and validation sets (Log rank test, p < 0.0001). High-risk group presented significantly lower survival probability than low-risk group (p < 0.05, Figure 4B and C). ROC analysis showed that the prognostic model had good prognostic properties for 1-year (AUC: 0.842), 3-year (AUC: 0.859), and 5-year (AUC: 0.757) survival in the training set (Figure 4B). The good prognostic properties also presented for 1-year (AUC: 0.932), 3-year (AUC: 0.843), and 5-year (AUC: 0.684) survival in the validation set (Figure 4C).
Immune Infiltration and Expression Analysis of Three Prognostic Genes in Glioma
We further analyzed the correlation between three prognostic genes (TAGLN2, NTNG2, and IGF2BP2) and immune cells in glioma samples (Figure 5A). The obtained results showed that some immune cells strongly correlated with three prognostic genes (TAGLN2, NTNG2, and IGF2BP2). TAGLN2 was significantly negatively correlated with regulatory T cells (Tregs), resting mast cells, and activated mast cells and significantly positively correlated with follicular helper T cells, naive CD4 T cells, plasma cells, neutrophils, and eosinophils. NTNG2 was significantly negatively correlated with follicular helper T cells, naive CD4 T cells, neutrophils, and eosinophils and significantly positively correlated with resting mast cells and activated mast cells. IGF2BP2 was significantly negatively correlated with regulatory T cells (Tregs), resting mast cells, and activated mast cells and significantly positively correlated with follicular helper T cells and eosinophils. In addition, of these genes, the expression of TAGLN2 and IGF2BP2 in glioma tumor samples was significantly higher than those in normal samples, while the expression of NTNG2 was significantly lower based on the GSE50161 dataset (Figure 5B). Consistently, RT-qPCR confirmed the upregulation of TAGLN2 and IGF2BP2 and the downregulation of NTNG2 in glioma cells (p < 0.01, Figure 5C).
 |
Figure 5 Correlation and expression analysis of prognostic genes in glioma. (A) Analysis illustrating the correlation between the three prognostic genes (TAGLN2, NTNG2, and IGF2BP2) and immune cells in glioma samples. (B) Differential expression levels of TAGLN2, NTNG2, and IGF2BP2 in glioma tumor samples in comparison to normal samples using the GSE50161 dataset. *p < 0.05, ****p < 0.0001. (C) RT-qPCR results confirming the altered expression patterns of TAGLN2, NTNG2, and IGF2BP2 in glioma cells. **p < 0.01 vs HA1800. |
Discussion
The LLPS mechanism is crucial in both the initiation and advancement of tumors.22 LLPS leads to the dysfunction of biomolecular condensates, thereby contributing to the tumorigenesis and progression. For instance, MALR/ILF3-mediated LLPS indicates poor prognoses for patients with esophageal cancer and promote cancer progression.4 The emergence of distinct tumor immune microenvironment (TIME) profiles is also linked to LLPS, given its pivotal role in modulating immune signaling pathways.23 The induction of LLPS of mutant NF2 imprisons the cGAS-STING machinery to abrogate antitumor immunity.24 We postulated that an in-depth investigation of LLPS-related biomarkers could offer valuable insights for distinguishing novel tumor subtypes and predicting prognosis as well as immunotherapy responsiveness. Predicting the prognosis of gliomas has been considered more challenging than for other malignancies.25 A previous study provided a classification of lower-grade glioma (LGG) patients based on LLPS. The LLPS-related prognostic risk score was correlated with clinicopathological features, cancer hallmarks, genomic alterations, and TIME patterns of LGG patients.26 In this study, we focused on identifying LLPS-related DEG in glioma. A total of 673 LLPS-related DEGs in glioma were obtained by intersecting 3227 glioma-related DEGs from the GSE50161 dataset and 3773 LLPS-related genes from the DrLLPS and PhaSepDB databases. Based on the expression profiles of 673 LLPS-related DEGs, we identified three molecular subtypes of glioma patients in the TCGA database. Then, significant differences among three molecular subtypes were observed regarding prognosis and immune microenvironment. For personalized integrative evaluations, a prognostic model containing three LLPS-related DEGs (TAGLN2, NTNG2, and IGF2BP2) was constructed via the LASSO Cox regression analysis. Results revealed that the prognostic model had good predictive properties for prognosis and immune microenvironment of glioma patients.
Our analysis developed a novel prognostic model based on LLPS-related DEGs (TAGLN2, NTNG2, and IGF2BP2) for predicting the prognosis of glioma. A study revealed a multi-stage LLPS process during osmotic stress, in which rapid clustering of IGF2BP proteins initiates stress granules assembly.27 MYC translation mediating PABP1/IGF2BPs liquid–liquid phase separation contributes to tumor progression.28 Mechanism studies of TAGLN2 and NTNG2 in LLPS are few; however, their functions in brain tumors, including glioma, have been reported. This is helpful for our discovery of candidate key molecules of glioma from the perspective of LLPS. It has been reported that TAGLN2 is a candidate prognostic biomarker promoting tumorigenesis in human gliomas.29 Succinylation of lysine-40 on TAGLN2 promotes angiogenesis and tumor growth in glioma.30 Inhibiting TAGLN2 suppresses the malignant progression of glioma and augments sensitivity to temozolomide.31 Homozygous missense variants in NTNG2, encoding netrin-G2 involved in neuronal circuitry and synaptic organization in vertebrates, result in a unique neurodevelopmental disorder.32 The pan-cancer landscape of netrin family reveals that the participation of NTNG2 in various cancers, including glioma, shows potential as tumor markers and therapeutic targets.33 A pan-cancer landscape demonstrates the IGF2BP3 is a potential negative regulator of glioma tumorigenesis by modulating stemness.34 IGF2BP2 SUMOylation stimulates vasculogenic mimicry formation in glioma cells and boosts xenograft growth in nude mice, suggesting a novel approach for glioma molecular targeted therapy.35 IGF2BP2 can induce drug resistance in glioblastoma cells and promote glioma progression.36 The prognosis model consisting TAGLN2, NTNG2, and IGF2BP2 showed good prognostic properties for 1-year (AUC: 0.842), 3-year (AUC: 0.859), and 5-year (AUC: 0.757) survival for patients with glioma. By bioinformatics analysis and in vitro experimental validation, we found that TAGLN2 and IGF2BP2 were upregulated in glioma tumor tissues and cells, while NTNG2 was downregulated. These studies suggest the prognostic roles of TAGLN2, NTNG2, and IGF2BP2 in glioma. However, their involvement in the LLPS mechanism remains to be further investigated.
We further investigated the association between LLPS-related DEGs and TIME. Within the tumor stroma, immune cells serve as fundamental components and play a vital role in its intricate dynamics. An accumulating body of research indicates that both innate immune cells (macrophages, neutrophils, dendritic cells, innate lymphoid cells, myeloid-derived suppressor cells, and NK cells) and adaptive immune cells (T cells and B cells) can foster tumor progression when situated within the tumor microenvironment.37 Based on the LLPS-related DEGs, we identified three molecular subtypes of glioma (C1, C2, and C3). Different LLPS subtypes of glioma patients exhibited distinct survival probability. The C2 subtype had significantly lower survival probability than C1 and C3 subtypes. There are also significant differences in the expression levels of the PD1 and PDL1 immune checkpoint genes across the three molecular subtypes. Furthermore, the degree of immune cell infiltration varies significantly among the three molecular subtypes, potentially leading to disparities in tumor progression and the efficacy of immunotherapy. In addition, we found that these three prognostic biomarkers (TAGLN2, NTNG2, and IGF2BP2) were closely related to immune microenvironment in glioma. TAGLN2 and IGF2BP2 was significantly negatively correlated with resting and activated mast cells, while NTNG2 was significantly positively correlated with resting and activated mast cells. A large-scale bulk RNA-seq analysis defines immune evasion mechanism related to mast cell in gliomas.38 Mast cells modulate proliferation, migration, and stemness of glioma cells through downregulation of GSK3β expression and inhibition of STAT3 activation.39 Therefore, the LLPS-related DEGs (TAGLN2, NTNG2, and IGF2BP2) may regulate glioma progression via affecting mast cells.
Conclusion
Our research underscores the significance of LLPS-related genes in glioma prognosis. We identified three distinct glioma molecular subtypes, with subtype C2 demonstrating a favorable prognosis and increased immune response. A prognostic model was formulated based on three pivotal LLPS-related genes (TAGLN2, NTNG2, and IGF2BP2), showing strong predictive abilities for patient outcomes. However, the LLPS-related prognostic model was proposed based on a public database, which may exist potential biases during model construction and validation. This model needs to be validated by prospective clinical experiments. It also requires molecular function experiments to investigate prognostic biomarkers (TAGLN2, NTNG2, and IGF2BP2) in LLPS mechanisms and glioma.
Abbreviations
LLPS, Liquid-liquid phase separation; Geo, Gene Expression Omnibus; DEGs, Differentially Expressed Genes; KM, Kaplan-Meier; DMEM, Dulbecco’s Modified Eagle Medium; cDNA, complementary DNA; CDF, cumulative distribution function; PCA, principal component analysis.
Data Sharing Statement
The data that support the findings of this study are available from the corresponding author, [LH], on special request.
Ethical Approval
This study is based on open-source data, there are no ethical issues and other conflicts of interest. Thus, the study was exempted from the approval of local ethics committees (Ethics Committees of The First Affiliated Hospital of Zhejiang Chinese Medical University).
Author Contributions
All authors made a significant contribution to the work reported, whether that is in the conception, study design, execution, acquisition of data, analysis and interpretation, or in all these areas; took part in drafting, revising or critically reviewing the article; gave final approval of the version to be published; have agreed on the journal to which the article has been submitted; and agree to be accountable for all aspects of the work.
Funding
There is no funding to report.
Disclosure
The authors report no conflicts of interest in this work.
References
1. Peng Q, Wang L, Qin Z, et al. Phase Separation of Epstein-Barr Virus EBNA2 and Its Coactivator EBNALP Controls Gene Expression. J Virol. 2020;94(7). doi:10.1128/JVI.01771-19
2. Bracha D, Walls MT, Brangwynne CP. Probing and engineering liquid-phase organelles. Nat Biotechnol. 2019;37(12):1435–1445. doi:10.1038/s41587-019-0341-6
3. Lu B, Zou C, Yang M, et al. Pharmacological Inhibition of Core Regulatory Circuitry Liquid-liquid Phase Separation Suppresses Metastasis and Chemoresistance in Osteosarcoma. Adv Sci (Weinh). 2021;8(20):56.
4. Liu J, Liu ZX, Li JJ, et al. The Macrophage-Associated LncRNA MALR Facilitates ILF3 Liquid-Liquid Phase Separation to Promote HIF1α Signaling in Esophageal Cancer. Cancer Res. 2023;83(9):1476–1489. doi:10.1158/0008-5472.CAN-22-1922
5. Zbinden A, Pérez-Berlanga M, De Rossi P, Polymenidou M. Phase Separation and Neurodegenerative Diseases: a Disturbance in the Force. Dev Cell. 2020;55(1):45–68. doi:10.1016/j.devcel.2020.09.014
6. Mehta S, Zhang J. Liquid-liquid phase separation drives cellular function and dysfunction in cancer. Nat Rev Cancer. 2022;22(4):239–252. doi:10.1038/s41568-022-00444-7
7. Tong X, Tang R, Xu J, et al. Liquid-liquid phase separation in tumor biology. Signal Transduct Target Ther. 2022;7(1):221. doi:10.1038/s41392-022-01076-x
8. Gusyatiner O, Hegi ME. Glioma epigenetics: from subclassification to novel treatment options. Semin Cancer Biol. 2018;51:50–58. doi:10.1016/j.semcancer.2017.11.010
9. Xu S, Tang L, Li X, Fan F, Liu Z. Immunotherapy for glioma: current management and future application. Cancer Lett. 2020;476:1–12. doi:10.1016/j.canlet.2020.02.002
10. Ostrom QT, Price M, Neff C, et al. CBTRUS Statistical Report: primary Brain and Other Central Nervous System Tumors Diagnosed in the United States in 2015-2019. Neuro Oncol. 2022;24(Suppl 5):v1–v95. doi:10.1093/neuonc/noac202
11. Nicholson JG, Fine HA. Diffuse Glioma Heterogeneity and Its Therapeutic Implications. Cancer Discov. 2021;11(3):575–590. doi:10.1158/2159-8290.CD-20-1474
12. Barrett T, Wilhite SE, Ledoux P, et al. NCBI GEO: archive for functional genomics data sets--update. Nucleic Acids Res. 2013;41(D1):D991–5. doi:10.1093/nar/gks1193
13. Goldman MJ, Craft B, Hastie M, et al. Visualizing and interpreting cancer genomics data via the Xena platform. Nat Biotechnol. 2020;38(6):675–678. doi:10.1038/s41587-020-0546-8
14. Tran TO, Vo TH, Lam LHT, Le NQK. ALDH2 as a potential stem cell-related biomarker in lung adenocarcinoma: comprehensive multi-omics analysis. Comput Struct Biotechnol J. 2023;21:1921–1929. doi:10.1016/j.csbj.2023.02.045
15. Dang HH, Hdk T, Nguyen TTT, et al. Prospective role and immunotherapeutic targets of sideroflexin protein family in lung adenocarcinoma: evidence from bioinformatics validation. Funct Integr Genomics. 2022;22(5):1057–1072. doi:10.1007/s10142-022-00883-3
16. Ritchie ME, Phipson B, Wu D, et al. limma powers differential expression analyses for RNA-sequencing and microarray studies. Nucleic Acids Res. 2015;43(7):e47–e47. doi:10.1093/nar/gkv007
17. Wilkerson MD, Hayes DN. ConsensusClusterPlus: a class discovery tool with confidence assessments and item tracking. Bioinformatics. 2010;26(12):1572–1573. doi:10.1093/bioinformatics/btq170
18. Wang W, Lu Z, Wang M, et al. The cuproptosis-related signature associated with the tumor environment and prognosis of patients with glioma. Front Immunol. 2022;13:998236. doi:10.3389/fimmu.2022.998236
19. Li G, Wu Z, Gu J, et al. Metabolic Signature-Based Subtypes May Pave Novel Ways for Low-Grade Glioma Prognosis and Therapy. Front Cell Dev Biol. 2021;9:755776. doi:10.3389/fcell.2021.755776
20. Chen B, Khodadoust MS, Liu CL, Newman AM, Alizadeh AA. Profiling Tumor Infiltrating Immune Cells with CIBERSORT. Methods Mol Biol. 2018;1711:243–259.
21. Newman AM, Liu CL, Green MR, et al. Robust enumeration of cell subsets from tissue expression profiles. Nat Methods. 2015;12(5):453–457. doi:10.1038/nmeth.3337
22. Cai D, Liu Z, Lippincott-Schwartz J. Biomolecular Condensates and Their Links to Cancer Progression. Trends Biochem Sci. 2021;46(7):535–549. doi:10.1016/j.tibs.2021.01.002
23. Xia S, Chen Z, Shen C, Fu TM. Higher-order assemblies in immune signaling: supramolecular complexes and phase separation. Protein Cell. 2021;12(9):680–694. doi:10.1007/s13238-021-00839-6
24. Meng F, Yu Z, Zhang D, et al. Induced phase separation of mutant NF2 imprisons the cGAS-STING machinery to abrogate antitumor immunity. Mol Cell. 2021;81(20):4147–4164.e7. doi:10.1016/j.molcel.2021.07.040
25. Ning L, Zhao G, Xie C, et al. Development and Validation of a Liquid-Liquid Phase Separation-Related Gene Signature as Prognostic Biomarker for Low-Grade Gliomas. Dis Markers. 2022;2022:1487165. doi:10.1155/2022/1487165
26. Zheng J, Wu Z, Qiu Y, Wang X, Jiang X. An integrative multi-omics analysis based on liquid-liquid phase separation delineates distinct subtypes of lower-grade glioma and identifies a prognostic signature. J Transl Med. 2022;20(1):55. doi:10.1186/s12967-022-03266-1
27. Zeng WJ, Lu C, Shi Y, et al. Initiation of stress granule assembly by rapid clustering of IGF2BP proteins upon osmotic shock. Biochim Biophys Acta Mol Cell Res. 2020;1867(10):118795. doi:10.1016/j.bbamcr.2020.118795
28. Gao Y, Jiang M, Guo F, et al. A novel lncRNA MTAR1 promotes cancer development through IGF2BPs mediated post-transcriptional regulation of c-MYC. Oncogene. 2022;41(42):4736–4753. doi:10.1038/s41388-022-02464-x
29. Han MZ, Xu R, Xu YY, et al. TAGLN2 is a candidate prognostic biomarker promoting tumorigenesis in human gliomas. J Exp Clin Cancer Res. 2017;36(1):155. doi:10.1186/s13046-017-0619-9
30. Zhang X, Han J, Fan D, et al. Lysine-40 succinylation of TAGLN2 induces glioma angiogenesis and tumor growth through regulating TMSB4X. Cancer Gene Ther. 2023;30(1):172–181. doi:10.1038/s41417-022-00534-6
31. Ye T, Chen R, Zhou Y, et al. Salvianolic acid A (Sal A) suppresses malignant progression of glioma and enhances temozolomide (TMZ) sensitivity via repressing transgelin-2 (TAGLN2) mediated phosphatidylinositol-3-kinase (PI3K) / protein kinase B (Akt) pathway. Bioengineered. 2022;13(5):11646–11655. doi:10.1080/21655979.2022.2070963
32. Dias CM, Punetha J, Zheng C, et al. Homozygous Missense Variants in NTNG2, Encoding a Presynaptic Netrin-G2 Adhesion Protein, Lead to a Distinct Neurodevelopmental Disorder. Am J Hum Genet. 2019;105(5):1048–1056. doi:10.1016/j.ajhg.2019.09.025
33. Hao W, Yu M, Lin J, et al. The pan-cancer landscape of netrin family reveals potential oncogenic biomarkers. Sci Rep. 2020;10(1):5224. doi:10.1038/s41598-020-62117-5
34. Shao W, Zhao H, Zhang S, et al. A pan-cancer landscape of IGF2BPs and their association with prognosis, stemness and tumor immune microenvironment. Front Oncol. 2022;12:1049183. doi:10.3389/fonc.2022.1049183
35. Li H, Wang D, Yi B, et al. SUMOylation of IGF2BP2 promotes vasculogenic mimicry of glioma via regulating OIP5-AS1/miR-495-3p axis. Int J Bio Sci. 2021;17(11):2912–2930. doi:10.7150/ijbs.58035
36. Han J, Yu X, Wang S, et al. IGF2BP2 Induces U251 Glioblastoma Cell Chemoresistance by Inhibiting FOXO1-Mediated PID1 Expression Through Stabilizing lncRNA DANCR. Front Cell Dev Biol. 2021;9:659228. doi:10.3389/fcell.2021.659228
37. Hinshaw DC, Shevde LA. The Tumor Microenvironment Innately Modulates Cancer Progression. Cancer Res. 2019;79(18):4557–4566. doi:10.1158/0008-5472.CAN-18-3962
38. Chen R, Wu W, Liu T, et al. Large-scale bulk RNA-seq analysis defines immune evasion mechanism related to mast cell in gliomas. Front Immunol. 2022;13:914001. doi:10.3389/fimmu.2022.914001
39. Attarha S, Roy A, Westermark B, Tchougounova E. Mast cells modulate proliferation, migration and stemness of glioma cells through downregulation of GSK3β expression and inhibition of STAT3 activation. Cell Signal. 2017;37:81–92. doi:10.1016/j.cellsig.2017.06.004
 © 2024 The Author(s). This work is published and licensed by Dove Medical Press Limited. The full terms of this license are available at https://www.dovepress.com/terms.php and incorporate the Creative Commons Attribution - Non Commercial (unported, v3.0) License.
By accessing the work you hereby accept the Terms. Non-commercial uses of the work are permitted without any further permission from Dove Medical Press Limited, provided the work is properly attributed. For permission for commercial use of this work, please see paragraphs 4.2 and 5 of our Terms.
© 2024 The Author(s). This work is published and licensed by Dove Medical Press Limited. The full terms of this license are available at https://www.dovepress.com/terms.php and incorporate the Creative Commons Attribution - Non Commercial (unported, v3.0) License.
By accessing the work you hereby accept the Terms. Non-commercial uses of the work are permitted without any further permission from Dove Medical Press Limited, provided the work is properly attributed. For permission for commercial use of this work, please see paragraphs 4.2 and 5 of our Terms.