")
Back to Journals » International Journal of Nanomedicine » Volume 16
Multiplexed Molecular Imaging Strategy Integrated with RNA Sequencing in the Assessment of the Therapeutic Effect of Wharton’s Jelly Mesenchymal Stem Cell-Derived Extracellular Vesicles for Osteoporosis
Authors Lu CH , Chen YA, Ke CC , Chiu SJ, Jeng FS, Chen CC, Hsieh YJ , Yang BH, Chang CW , Wang FS, Liu RS
Received 27 August 2021
Accepted for publication 5 November 2021
Published 30 November 2021 Volume 2021:16 Pages 7813—7830
DOI https://doi.org/10.2147/IJN.S335757
Checked for plagiarism Yes
Review by Single anonymous peer review
Peer reviewer comments 2
Editor who approved publication: Dr Yan Shen
Cheng-Hsiu Lu,1– 3 Yi-An Chen,4,5 Chien-Chih Ke,6– 8 Sain-Jhih Chiu,5 Fong-Shya Jeng,5 Chao-Cheng Chen,4 Ya-Ju Hsieh,6– 8 Bang-Hung Yang,4,9 Chi-Wei Chang,9 Feng-Sheng Wang,2,3,10,11 Ren-Shyan Liu1,4,9,12
1Industrial Ph.D. Program of Biomedical Science and Engineering, National Yang Ming Chiao Tung University, Taipei, Taiwan; 2Core Facility for Phenomics and Diagnostics, Kaohsiung Chang Gung Memorial Hospital, Kaohsiung, Taiwan; 3Department of Medical Research, Kaohsiung Chang Gung Memorial Hospital, Kaohsiung, Taiwan; 4Department of Biomedical Imaging and Radiological Sciences, National Yang Ming Chiao Tung University, Taipei, Taiwan; 5Molecular and Genetic Imaging Core/Taiwan Mouse Clinic, National Comprehensive Mouse Phenotyping and Drug Testing Center, Taipei, Taiwan; 6Department of Medical Imaging and Radiological Sciences, Kaohsiung Medical University, Kaohsiung, Taiwan; 7Drug Development and Value Creation Research Center, Kaohsiung Medical University, Kaohsiung, Taiwan; 8Department of Medical Research, Kaohsiung Medical University Hospital, Kaohsiung, Taiwan; 9PET Center, Department of Nuclear Medicine, Taipei Veterans General Hospital, Taipei, Taiwan; 10Center for Mitochondrial Research and Medicine, Kaohsiung Chang Gung Memorial Hospital, Kaohsiung, Taiwan; 11Graduate Institute of Clinical Medical Science, Chang Gung University College of Medicine, Kaohsiung, Taiwan; 12Department of Nuclear Medicine, Cheng Hsin Hospital, Taipei, Taiwan
Correspondence: Chien-Chih Ke; Ren-Shyan Liu Email [email protected]; [email protected]
Introduction: Osteoporosis is a result of an imbalance in bone remodeling. Mesenchymal stem cell-derived extracellular vesicles (MSC-EVs) have been considered as a potentially promising treatment for osteoporosis. However, the therapeutic effect, genetic alterations, and in vivo behavior of exogenous EVs for osteoporosis in mice models remain poorly understood.
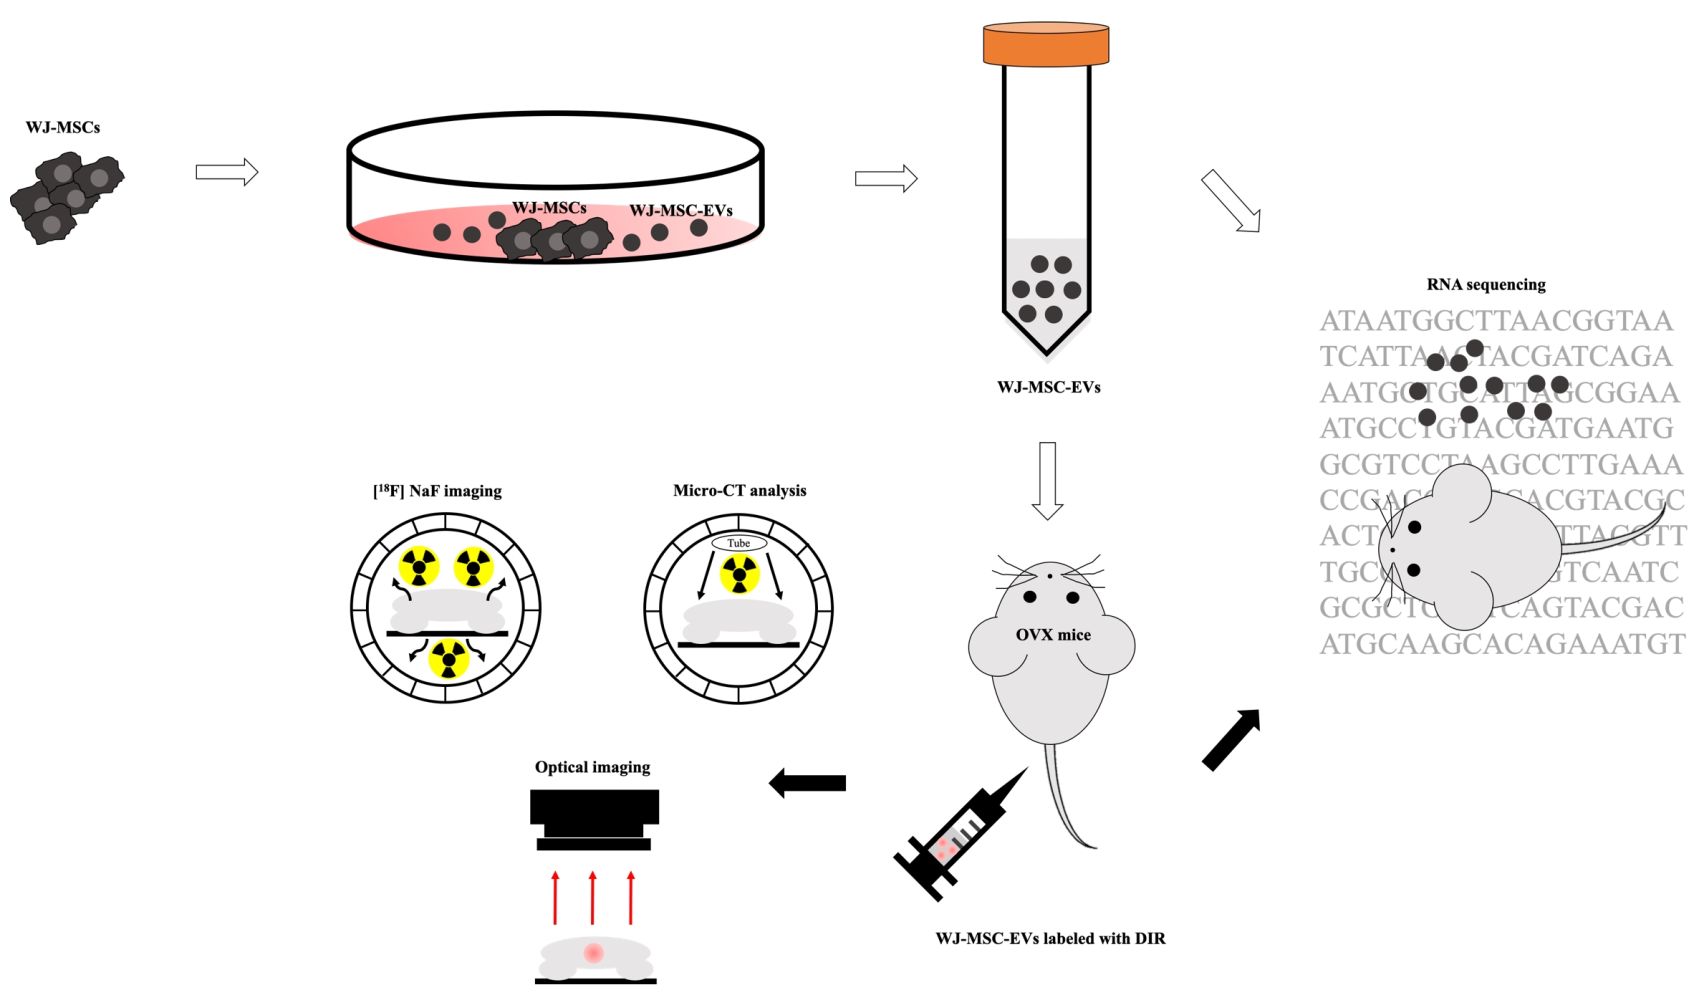
Methods: A multiplexed molecular imaging strategy was constructed by micro-positron emission tomography (μPET)/computed tomography (CT), μCT, and optical imaging modality which reflected the osteoblastic activity, microstructure, and in vivo behavior of EVs, respectively. RNA sequencing was used to analyze the cargo of EVs, and the bone tissues of ovariectomized (OVX) mice post EV treatment.
Results: The result of [18F]NaF μPET showed an increase in osteoblastic activity in the distal femur of EV-treated mice, and the bone structural parameters derived from μCT were also improved. In terms of in vivo behavior of exogenous EVs, fluorescent dye-labeled EVs could target the distal femur of mice, whereas the uptakes of bone tissues were not significantly different between OVX mice and healthy mice. RNA sequencing demonstrated upregulation of ECM-related genes, which might associate with the PI3K/AKT signaling pathway, in line with the results of microRNA analysis showing that mir-21, mir-29, mir-221, and let-7a were enriched in Wharton’s jelly-MSC-EVs and correlated to the BMP and PI3K/AKT signaling pathways.
Conclusion: The therapeutic effect of exogenous WJ-MSC-EVs in the treatment of osteoporosis was successfully assessed by a multiplexed molecular imaging strategy. The RNA sequencing demonstrated the possible molecular targets in the regulation of bone remodeling. The results highlight the novelty of diagnostic and therapeutic strategies of EV-based treatment for osteoporosis.
Keywords: Wharton’s jelly mesenchymal stem cells, extracellular vesicles, osteoporosis, [18F]NaF, RNA sequencing
Graphical Abstract:
Introduction
Osteoporosis is an age-related condition characterized by decreasing bone mass and mineral density, eventually leading to pathologic fracture.1 In osteoporosis, the balance of bone remodeling is disturbed through enhanced bone resorption and/or decreasing bone formation. Various growth factors and signaling pathways are involved in osteoporosis, such as the receptor activator of nuclear factor‑κB ligand (RANKL)/RANK/osteoprotegerin (OPG) system, bone morphogenetic protein (BMP), PI3K/AKT, TGF-β/BMP, and Wnt/β-Catenin signaling pathways.2–5 Several strategies have been applied for the treatment of osteoporosis, including hormone therapy, selective estrogen receptor modulator (SERM), calcitonin, and bisphosphonate. However, with the limited effects and obvious side effects, these therapies are still not satisfactory.6–9 Therefore, seeking an alternative therapeutic agent with low adverse effects is worthy of pursuit.
Extracellular vesicles (EVs) are cell-secreted vesicles of nanoscale size formed upon fusion of late endosomes with the cell membrane.10,11 EVs, structurally enclosed by lipid bilayer-membrane, encapsulate numerous types of molecules including integrins, adhesion molecules, lipids, and receptors. A plethora of molecules inside the EVs like DNA, messenger RNA (mRNA), microRNA (miRNA), non-coding RNA, enzymes, and cytokines are involved in cell–cell communication.12–14 In particular, EVs derived from mesenchymal stem cells (MSC-EVs), with the properties of low toxicity, high biocompatibility, and biological permeability, exhibit a high potential in the development of drug delivery strategies. In contrast to MSC-based treatment, MSC-EVs could mediate immune-privileged status, and emerge as a cell-free immunomodulatory system.15–17
Recently, the use of EVs, especially EVs derived from stem cells, in the treatment of bone diseases is at its peak, which reflects molecular and biological functions of their parental cells.18 Autologous EVs isolated from human urine have been reported to retard the progression of osteoporosis by transferring collagen triple-helix repeat-containing 1 and OPG.19 EVs derived from human umbilical cord blood with an age-induced mice model revealed that EV-carrying microRNA (miR)-3960 might mediate bone loss.20 Exogenous human umbilical cord MSC-EVs were found to be able to mediate the bone metabolism by transferring the C-type lectin domain containing 11A in a mice model.21 Besides, the therapeutic effects of Wharton’s jelly-MSC-EVs (WJ-MSC-EVs) on osteonecrosis by the methylprednisolone-induced rat model verified the regulating effect of the miR-21–phosphatase and tensin homolog (PTEN)–protein kinase B (AKT) signaling pathway on bone remodeling.22 Although the reports above have shown the promising therapeutic ability of MSC-EVs in bone diseases, studies have rarely focused on the treatment of osteoporosis by MSC-EVs. In this study, we aimed to investigate the therapeutic effect and the possible mechanism of action of WJ-MSC-EVs in the treatment of osteoporotic mice.
Dual-energy X-ray absorptiometry, to measure the bone mineral density (BMD), is majorly performed in clinical use. In the animal studies of osteoporosis, micro-computed tomography (µCT) has long been the most useful tool for monitoring the change of bone quality in terms of anatomical structure.23 However, µCT images merely provide anatomical information and various factors that may affect the measurement of osteoporosis, including image reconstruction by software, algorithms of parameters as well as the limit of fractal dimension.24 Complementary to the structural information, fluorine-18-sodium fluoride ([18F]NaF) positron emission tomography (PET) imaging provides information of locations and levels of in vivo osteoblastic activity. [18F]NaF is an FDA-approved bone PET imaging agent to define the altered osteogenic activity of bone and is currently widely used in clinical and preclinical studies.25–31 Once administered, the 18F ion infiltrates into the bone matrix, exchanges with hydroxyl groups and forms fluorapatite, which reflects the activity of osteoblasts. Combined [18F]NaF µPET imaging and µCT analysis have been successfully used for monitoring bone regeneration in vivo.32 With different strengths, these two imaging tools provide a more comprehensive evaluation of both anatomical (bone structure) and functional (osteoblast activity) therapeutic effects and therefore were performed in this study. In addition to [18F]NaF/µPET and µCT imaging for therapeutic effect evaluation, a lipophilic fluorescent dye DIR (DiR DiIC18(7); 1,1′-dioctadecyl-3,3,3′,3′-tetramethylindotricarbocyanine iodide dye), was used to track MSC-EVs in the animal, as imaged by an in vivo imaging system (IVIS).33
Administration of exogenous MSC-EVs has been shown to be of great benefit in the treatment of bone disease including osteoporosis. The underlying mechanisms of therapeutic effect have been discussed in some studies and more are under examination. In this study, with the aid of next- generation sequencing (NGS), the miRNA profile in MSC-EVs, as well as the alteration of the mRNA expression profile of bone tissues in ovariectomized (OVX) mice with or without MSC-EV treatment, were dissected. Sequencing of this miRNA/mRNA profile helped identify the key factors carried by MSC-EVs and the signaling pathways in the osteoporotic tissues involved in the therapeutic effect of MSC-EVs. miRNAs are small non-coding RNAs, serving as an intricate functional network in which each miRNA potentially controls a variety of different target genes.34,35 MicroRNAs regulate gene expression by either mRNA degradation or inhibition of protein translation of target mRNAs depending on cellular conditions, microenvironment, inorganic ions, and coenzymes.36 Certain EV-carried miRNAs (EV-miRNAs) such as miR-3960 have been found to be involved in the therapeutic regulation of osteoporosis.20,37 However, the entire picture of the involvement of MSC-EV-miRNAs in the therapeutic effect and associated mechanism or signaling regulated in the osteoporotic tissues remains largely elusive. This study aimed to investigate the therapeutic effect and mechanism of MSC-EVs in the treatment of osteoporosis by multi-perspective approaches including integrated multiplexed imaging modalities and miRNA/mRNA profiling in MSC-EVs and osteoporotic tissues.
Materials and Methods
Experimental Materials
Preparation of Conditioned Medium and Cell Culture
WJ-MSCs were purchased from Bioresource Collection and Research Center, Taiwan. For EV collection, the cells were cultured in α-Minimum Essential Medium (MEM) supplemented with 10% fetal bovine serum (FBS), 1%
Preparation of EVs
MSC-derived EVs were extracted with Exo-Prep (Lonza, Switzerland) following the manufacturer’s protocol. Briefly, 100 kDa Amicon® Ultra-15 Centrifugal Filter Units (Merck, Germany) was used to concentrate the conditioned medium. An equal volume of reagent was mixed with concentrated medium for 60 min at 4 °C. Then, the mixture was centrifuged at 10,000 g for 60 min. After removing the supernatant, the residual was centrifuged at 10,000 g for 5 min and aspirated. The remaining polymeric materials attached to EVs were removed using Sephadex G-25 in PD-10 desalting columns (GE Healthcare, USA).38 Two milliliters of EVs were concentrated to appropriate volume with 100 kDa Amicon® Ultra-15 Centrifugal Filter Units (Merck, Germany). Then, approximately 100 μL purified EVs were collected and stored at −80 °C. The EVs isolated by UC were prepared with sequential centrifugation, and conditioned medium was filtrated and then centrifuged at 10,000 g for 30 min at 4 °C using an SW 28 rotor (Beckman Coulter, USA) followed by UC with 100,000 g for 70 min at 4 °C. The pellets were further resuspended in 5 mL PBS followed by UC at 100,000 g for 70 min at 4 °C.39
Animals
Eight-week-old female ovariectomized (OVX) BALB/c (25–30 g) mice were purchased from BioLASCO Taiwan Co., Ltd. The mice were subjected individually to bilateral OVX, and the surgery was carried out by BioLASCO according to a previous study.40 In brief, mice were anesthetized with the mixture of Zoletil®50 (Virbac Laboratories, France) and xylazine (Health-Tech Pharmaceutical Co., Taiwan) through intramuscular injection (0.25 mL/kg). The incisions of mice were covered with 1% lidocaine to reduce the pain. The bilateral ovaries were carefully removed and ligated with catgut. Finally, the skin with fascia was sutured. In the sham group (mice without OVX), sham surgery without ovary removal were performed in mice. After surgery, the mice with stapled skin were delivered to our lab within 2 days. Upon receiving, the OVX mice were immediately moved to the cages to adapt to the environment for 2 days. Mice were housed (3 animals per cage) in individually ventilated cages (IVC) systems and a 12 h light/dark regular light cycle. The ambient temperature was kept at 20–21 °C with a relative humidity of 50–70%. Environmental enrichment was provided as a standard that included wood shavings and paper shred bedding. The wood shavings with paper shred bedding were provided to enrich the environment. Before conducting animal studies, the skin staple on the mice was removed. The first authors were trained and qualified to perform anesthesia, animal handling, intravenous injection, and sacrificing. All the experiments were carried out in strict accordance with the recommendations in the Guide for the Care and Use of Laboratory Animals of the National Institutes of Health. The protocol was approved by the Committee on the Ethics of Animal Experiments of the National Yang Ming Chiao Tung University (IACUC number: 1081007r, permission date: 18 October 2019). The schedules of treatment and experiments were as follows (Supplemental Figure S1): OVX-100 μg EVs, mice were intravenously injected with 100 μg EVs/week; OVX-200 μg EVs, mice were intravenously injected with 200 μg EVs/week; OVX-200 μg UC EVs, mice were intravenously injected with 200 μg EVs isolated by ultracentrifugation/week; OVX-PBS, mice were intravenously injected with PBS as control/week. The sham included mice without OVX. Eight-week-old female BALB/c mice were categorized into several groups for imaging and sequencing analyses as follows: for micro-CT (μCT) analysis: OVX-100 μg EVs (N=6); OVX-200 μg EVs (N=6); OVX-200 μg UC EVs (N=6); OVX-PBS (N=6); Sham (N=6). For [18F]NaF μPET/CT imaging: OVX-200 μg EVs (N=3); OVX-PBS (N=3), Sham (N=3). For DIR fluorescent imaging: OVX-200 μg EVs (N=3); healthy mice treated with 200 μg EVs (N=3). For RNA sequencing: OVX-EVs (N=2); OVX-PBS (N=2).
Immunoblotting
WJ-MSCs (N=3) or WJ-MSC-EVs (N=3) were lysed with RIPA buffer, and the lysates were used for immunoblotting. After measurement of protein concentrations using a protein assay kit (Bio-Rad, USA), samples (50 μg proteins obtained from WJ-MSCs and WJ-MSC-EVs) were separated by electrophoresis with 10% SDS-polyacrylamide gels and transferred to polyvinylidene difluoride membranes (Bio-Rad, USA). After blocking with 5% bovine serum albumin (BSA) at room temperature for 1 h, membranes were probed with primary antibodies against CD9 (1:500; Merck Millipore, Germany), CD63 (1:1000; system biosciences, USA), HSP70 (1:500; system biosciences, USA), or Calnexin (1:1000; Merck Millipore, Germany) overnight at 4 °C and incubated with horseradish peroxidase (HRP)-conjugated goat anti-mouse IgG (1:1000; Abcam, UK) or HRP-conjugated goat anti-rabbit IgG (1:2000; Abcam, UK). Chemiluminescent HRP substrate was used to quantify protein expression, and images were detected and analyzed by UVP Imaging system BioSpectrum 600 (Fisher Scientific, USA).
Transmission Electron Microscopy
Entire 20 μg EVs diluted in 20 μL PBS (1 μg/μL) were dropped on a parafilm and then gently covered by a formvar carbon-coated nickel grid for 60 min with forceps. EVs were fixed with 2% paraformaldehyde for 10 min, and washed with PBS. To verify the expression of CD63, samples were incubated with anti-CD63 primary antibody (1:100; Merck Millipore, Germany) for at least 60 min followed by conjugation with 10-nm gold-labeled secondary antibody (1:50; Abcam, UK) for 40 min. To stabilize surface and intracellular structures, the samples were then immersed with a droplet of 2.5% glutaraldehyde for 10 min and washed with distilled water. The sample was incubated with a droplet of 2% uranyl acetate for 15 min to enhance the contrast. Finally, samples were soaked by 0.13% methyl cellulose and 0.4% uranyl acetate.41 After washing with distilled water and removing excess liquid, the samples were dried in air for 15 min. The samples (N=5) were examined by a transmission electron microscope (JEM-2000EXII; JEOL, Japan).
Nanoparticle Tracking Analysis
The size distributions of EVs were measured by the NanoSight LM10-HS (Malvern Panalytical, UK). In Brief, 1 μg/mL EVs (1 μg EVs in 1000 μL PBS) was resuspended in PBS for detection. Samples were loaded using an automated syringe pump, the laser beam of the system focused through the prepared sample with suspension of EVs. Video captions of 60 s were recorded in triplicate for each sample with a camera level setting at 12 and a detection threshold at 6 by NTA 3.1 software (Malvern Panalytical, UK). The parameters were as follows: temperature=19.7 °C; viscosity=1.0 cP; frames per second=25, number of frames=1124. The Brownian motion of each particle was monitored between frames, then calculated the size through the application of the Stokes–Einstein equation. The samples were prepared with 3 replicates and each sample was measured 3 times by the NanoSight LM10-HS.
Osteogenic Differentiation and Quantification of the Mineralization
For osteogenic differentiation, the BM-MSCs were cultured at a density of 3.1x10³/cm2 in 12-well culture plates (Thermo Fisher, USA). When cells reached 60% confluence, osteogenic induction medium (OIM) was added into the culture to induce osteogenic differentiation of the cells (N=4). OIM was prepared by 10 mM glycerophosphate, 0.2 mM ascorbate, 100 nM dexamethasone, and 10% FBS. The induction lasted for 2 weeks, OIM with 100 or 200 μg WJ-MSC-EVs was changed twice a week. The cells, which were cultured in DMEM containing 10% FBS, were used as negative control. Osteogenic differentiation was confirmed by the Alizarin Red S (Merck, Germany). In brief, the cells were fixed with 10% formalin (Merck, Germany) for at least 30 min at room temperature, and stained with 2% Alizarin Red S for 40 min. The staining solution was carefully aspirated and the cell monolayer was washed four times with 1 mL distilled water.42 For quantification, the monolayer was covered with 10% (w/v) cetylpyridinium chloride (Merck, Germany) for 20 min at room temperature, and the absorbance of ARS level was measured at 525 nm with 4 replicates.
In vivo Imaging of Exogenous WJ-MSC-EVs
Preparation and Detection of DIR Fluorescent Cyanine Dye
WJ-MSC-EVs were labeled with DIR (Perkin Elma, UK) dye followed by image acquisition with the IVIS 50 Imaging System (Perkin Elma, UK). Briefly, 0.8 mg EVs were incubated with 320 μg/mL DIR dye. After 30 min incubation, samples were loaded into PD-10 column with Sephadex G-25 and concentrated the volume with 100 kDa Amicon® Ultra-15 Centrifugal Filter Units (Merck, Germany); the final concentration was approximately 2 μg/μL. Subsequently, 200 μg EVs labeled with DIR were systemically administrated into mice, and the image was acquired by IVIS 50. The mice were placed at the center of the imaging field with 1.5% isoflurane at 1 L/min O2 anesthetization, and images were acquired at 24 h after EV injection. Images were obtained by ICG bandpass filter channel for 5 min acquisition. For quantification analysis, the selected regions of interest (ROI) were quantified and analyzed by living image software 3.2 (Perkin Elma, UK). Quantification of efficiency was measured using the formula as follows:

Preparation and Imaging Analysis of [18F]NaF PET
[18F]NaF was synthesized following the method described in the literature with slight modification.43,44 In brief, the no-carrier-added 18F-fluoride was produced by the 18O(p,n)18F nuclear reaction by the bombardment of 95% 18O-enriched water with a 17-MeV proton beam at 18 mA for 30 min. After irradiation, the solution containing 18F-fluoride was eluted with a QMA cartridge (Waters, USA) by helium gas pressure, and 18F ion was trapped in the QMA cartridge, and subsequently washed by distilled water (20 mL). One milliliter of 0.9% sodium chloride was passed through the QMA cartridge, and [18F]NaF was collected by a tube with 185±25.9 MBq. In μPET/CT imaging studies, each mouse examined at 1, 3, 7, and 15 weeks after ovariectomy was intravenously injected with 16.7±1.9 MBq/0.1 mL of [18F]NaF. Anesthesia was induced and maintained using 1–1.5% isoflurane and 100% O2 inhalation through a nose cone. For the dynamic study, the field of view was set from lower lumbar spine to ankle, and the imaging was performed for 90 min using a 20-frame protocol (5 frames of 60 s, 5 frames of 180 s, 6 frames of 300 s, and 4 frames of 600 s). For the static study, data were acquired for 600 s at 80 min after injection. Triumph PET/SPECT/CT imaging scanner (Gamma Medica-Ideas, USA) was used to acquire images, and the raw data were then reconstructed by the ordered-subset expectation-maximization algorithm with 2D maximum likelihood expectation maximization. Subsequently, ROIs were selected on the distal femora of each animal, and the values obtained from the ROIs were reported as the percent injected dose per cubic centimeter (%ID/cc) and standardized uptake values (SUV). In SUV analysis, the mean activity values for each distal femur were normalized to the injected dose per body weight of each mouse (SUVmean).
Micro-CT Analysis
For in vivo and ex vivo bone microstructure analysis, mice or bone tissues (right femur bone) were scanned by a Skyscan 1176 ultrahigh-resolution μCT scanner (X-ray intensity, 50 keV, 500 μA; exposure time, 69 ms). Images were constructed from 300 slices (each slice with an isotropic 12 μm×12 μm×12 μm voxel size) using SKYSCAN® CT-Analyzer software (Bruker, USA), and bone mineral density (BMD, g/cm3), trabecular bone mineral density (tBMD, g/cm3), trabecular bone volume (BV/TV, %), trabecular thickness (Tb.Th, mm), trabecular number (Tb.N, 1/mm), trabecular separation (Tb.Sp, mm), the total volume of pore space (Po.V(tot), mm3), and total porosity (percent) (Po(tot), %) were calculated automatically (N=6 per group).
Assessment of Genetic Change Induced by Exogenous EV-miRNAs in Mice
Histochemical Stain and Histomorphometry of Skeleton Tissues
For trabecular bone histology, femur tissue sections embedded with methylacrylate were subjected to hematoxylin and eosin, and tartrate-resistant acid phosphatase (TRAP) staining. Eighteen sections from six mice were randomly selected for histomorphometry, trabecular bone area (BV, mm2), adiposity (%), and osteoclast area (%) were analyzed by Photoshop 2020 (Adobe, USA) and Image J.45
Reverse Transcription and Quantitative Real-Time Polymerase Chain Reaction (qRT-PCR)
Total RNA from cultured cells (N=3) or bone tissues (N=4) of mice were extracted using Trizol reagent (Invitrogen, USA). These RNA samples were used for cDNA synthesis by HiScript II Q RT SuperMix (Vazyme, China) and subsequent PCR amplification using SYBR Green PCR Master Mix (Invitrogen, USA). Then, these cDNAs were amplified in an ABI Prism 7700 sequence Detection System (Applied Biosystems, USA). Relative mRNA expression was evaluated by the relative standard curve method (2–ΔΔCT) using GAPDH as control. The specific primers are listed in Supplemental Table S2.
Preparation for RNA Sequencing
The mice were sacrificed 2 months after the termination of MSC-EVs treatment (4 months post OVX), the right femur bones were used for ex vivo μCT imaging and analysis, and left femur bone tissues were used for RNA extraction. The left bone tissues were removed, immediately moved to a 1.5 mL tube, and frozen with liquid nitrogen. Before extracting RNA, the bone was ground with mortar and pestle in liquid nitrogen until it turned into powder and RNA was extracted. The process was carried out in liquid nitrogen to prevent RNA from degrading. After extraction using Trizol reagent (Invitrogen, USA), the concentration of RNA was determined using NanoDrop (Thermo Scientific). Samples were sent to Biotools Co., Ltd, Taiwan for the RNA sequencing at once. The analysis was carried on by NovaSeq 6000, paired-end 150 bp, and the depth of sequencing was set as 6 G (20 M reads). The reference genome was mapped using HISAT2, Mus musculus.
Next-Generation Sequencing (NGS) Analysis
For small RNA sequence screening, RNA concentration was measured using a NanoDrop instrument (Thermo Scientific) and sent to Genomics (Taipei, Taiwan) for small-RNA sequencing. Briefly, EV RNA integrity was detected by Agilent Technologies 2100 Bioanalyzer. Small-RNA libraries were prepared by adapter ligation, RT-PCR amplification, and pooled-gel purification. The prepared libraries were quantified using qPCR according to the Illumina qPCR quantification protocol guide. Sample preparation was without duplicates.46
Pathway and Functional Annotation Analysis
The list of miRNA targets was analyzed with Ingenuity pathway analysis using default settings. The connection between EV-miRNAs and osteoporosis regulator, or BMP, or PI3K/AKT signaling pathways were analyzed focusing on Biological Functions, only considering “Skeletal and muscular disorders.”
Statistics
All statistical analyses were performed using GraphPad Prism 8.0.2 (SigmaPlot 13, USA). Student’s t-test was used to analyze statistical differences between the two groups. Differences among multiple groups were analyzed using ANOVA. Data are presented as mean±standard deviation. A P-value less than 0.05 was defined as statistically significant.
Results
Characterization of WJ-MSC-EVs
EVs were collected from WJ-MSCs conditioned medium, and were characterized based on minimal information for studies of extracellular vesicles 2018 (MISEV2018).47 Three positive protein markers and one negative protein marker were examined, and characterized in single vesicles performed with two different but complementary techniques. The vesicles expressed the canonical EV markers CD9, CD63, and HSP70, but calnexin, the cell contamination marker, was absent in EVs as confirmed by Western blot (Figure 1A). The majority of the size in vesicles was measured by nanoparticle tracking analysis and the peak size was about 185 nm (Figure 1B). The spherical structure of a single EV was observed by transmission electron microscopy, and the expression of CD63 on the EV membrane was detected with anti-CD63-antibody-conjugated 10 nm gold nanoparticle (Figure 1C–E). These results indicated that these vesicles were in line with the characterization of EVs.
 |
Figure 1 Characterization of WJ-MSC-EVs. (A) Examination of canonical EV markers CD9, CD63, HSP70, and negative EV markers (Calnexin) using Western blotting. (B) The concentration, and size distribution of EVs, as well as peak size, were measured by NTA. (C and D) The morphology of EVs with membrane was observed by TEM images. (E) EV specific marker-CD63 was characterized by CD63 antibody conjugated with 10-nm gold secondary antibody. Yellow arrow, EVs; yellow arrowhead, CD63 antibody conjugated with 10 nm gold secondary antibody. Scale bar: 200 nm in (C) and 100 nm in (D and E). Abbreviations: EV, extracellular vesicle; WJ-MSC-EVs, Wharton’s jelly-mesenchymal stem cell-derived extracellular vesicles; TEM, transmission electron microscopy. |
Promotion of Osteogenic Differentiation by Treating WJ-MSC-EVs in BM-MSCs
To assess the promotion of osteogenic differentiation in vitro, BM-MSCs were treated with WJ-MSC-EVs and mRNA expression was analyzed 7 days after induction. Analysis by qRT-PCR revealed the increased levels of ALP and OPG with a decreased level of DKK1 in BM-MSCs induced by OIM containing WJ-MSC-EVs. However, the expression of RUNX2 did not significantly increase (Figure 2A). Further, Alizarin Red S (ARS) staining was utilized to estimate the promotion of osteogenic differentiation in BM-MSCs treated with WJ-MSC-EVs. The formation of calcium nodules could be obviously detected in the 200 μg/mL WJ-MSC-EVs group after 14 days of osteogenic differentiation induction (Figure 2B). For quantification of mineralization, the calcium deposits formed were dissolved in 10% (w/v) cetylpyridinium chloride, and the absorbance was measured. A significant increase in the accumulation of ARS was observed in BM-MSCs treated with 200 μg/mL WJ-MSC-EVs, but not in those treated with 100 μg/mL WJ-MSC-EVs in comparison with the OIM group on days 7 and 14 (Figure 2C). Collectively, the results indicated that the WJ-MSC-EVs have the potential to promote osteogenic differentiation of BM-MSCs.
 |
Figure 2 Effect of exogenous Wharton’s jelly-mesenchymal stem cell-derived extracellular vesicles (WJ-MSC-EVs) in osteogenic differentiation of bone marrow stem cells. (A) The mRNA expression levels of ALP, RUNX2, OPG, and DKK1 were measured by qRT-PCR at 7 days after osteogenic induction. (B) The calcium deposit formations were identified after ARS staining. (C) Quantification of the ARS level was measured by the absorbance at 525 nm. Data are expressed as mean±SD (*p<0.05, **p<0.01, ***p<0.005). Abbreviations: ARS, Alizarin Red S; OVX, ovariectomy; WJ-MSC-EVs, Wharton’s jelly-mesenchymal stem cell-derived extracellular vesicles. |
In vivo Tracking WJ-MSC-EVs Using DIR Fluorescent Cyanine Dye
To collect images, the 5-min acquisition was carried out at 1, 3, 6, 24, and 48 h after systemic administration of DIR-labeled EVs (DIR-EVs). The uptakes in bone tissues were gradually increased at 3 h, with the highest at 24 h, and decreased after 48 h (Supplemental Figure S2). The appropriate times of acquiring were determined, both healthy mice and OVX mice were intravenously injected with 200 μg DIR-EVs and imaged at 24 h post injection (Figure 3A and B). However, the results of DIR imaging and analysis did not show a significant target to the distal femur in the EV-treated group, in comparison with the healthy mice group at 2, 4, and 8 weeks post OVX. Nevertheless, EVs still appeared to target bone tissues (Figure 3C).
 |
Figure 3 In vivo tracking of DIR-labeled WJ-MSC-EVs in healthy mice and ovariectomized (OVX) mice. (A and B) Systemic administration of 200 μg DIR-EVs and imaged USING in vivo imaging system (IVIS) 50 at 2, 4, and 8 weeks post OVX. Healthy mice were determined as the control group. (C) Efficiency in healthy mice and OVX mice groups were quantified. Data are expressed as mean±SD. Abbreviations: NS, not significant; OVX, ovariectomy; WJ-MSC-EVs, Wharton’s jelly-mesenchymal stem cell-derived extracellular vesicles. |
Evaluation of Osteoblastic Activity of Bone Matrix by [18F]NaF PET
To determine the appropriate acquisition time after injection of [18F]NaF, 90 min dynamic scan was performed by μPET/CT. After 2 min, the onset of radiotracer accumulated in the kidneys and bladder, and subsequently the bone uptake could be observed at 5 min post injection. The accumulation of non-excreted [18F]NaF was gradually increased in the bone until the end of acquisition at 90 min (Supplemental Figure S3A–C). Hence, further analysis was started at 80 min post injection, and continued for 10 min static scans.
Micro-PET images showed homogeneous accumulation of [18F]NaF in the distal femur in all groups (Figure 4A). For the quantitative analysis, ROIs were extracted from the distal femur of mice and were quantified to obtain the %ID/cc and SUVs, and both methods were widely used in quantitative analysis of ROIs. The %ID/cc from the ROIs in the OVX-200 μg EVs mice group was significantly higher than in the OVX-PBS group at 3 and 7 weeks post OVX (Figure 4B and Supplemental Table S1). The effect was not sustained at 15 weeks post OVX, which might be due to the discontinuation of therapy. In contrast, the quantitative results of the sham group were significantly higher than that of the OVX-PBS group until 15 weeks post OVX. SUVmean, which normalized body weight, also showed higher levels at distal femur in OVX-200 μg EVs and sham groups (Figure 4C).
 |
Figure 4 Micro-PET/CT imaging and quantitative analysis of [18F]NaF. (A) Axial, coronal, sagittal, and volume rendering view of [18F]NaF tracer activity at the 1, 3, 7, and 15 weeks post OVX in OVX-200 μg EVs, OVX-PBS, and Sham groups. (B and C) Quantification of [18F]NaF uptake in distal femur using %ID/cc or SUVmean methods. Data are expressed as mean±SD (*p<0.05, #P<0.05 and ##P<0.01). *Indicate a significant difference between OVX-200 μg EVs and OVX-PBS. #Indicate significant differences from Sham and OVX-PBS groups. Abbreviations: OVX, ovariectomy; PBS, phosphate buffered saline; PET, positron emission tomography; CT, computed tomography; SUV, standardized uptake values. |
Assessment of Therapeutic Effect by Micro-CT Analysis
After continuous treatment with exogenous WJ-MCS-EVs or PBS for 2 months, the mice were examined by in vivo μCT, and the parameters of osteoporosis were analyzed. 3D μCT images of the distal femur showed that OVX mice treated with PBS had thinner cortical and trabecular bone with decreased interconnectivity in comparison with the control and EV-treated group (Figure 5A). Moreover, there was a significant improvement of BV/TV, Tb.Th, Tb.N, and Tb.Sp in the mice treated with 100 μg or 200 μg EVs. In addition, the value of trabecular BMD (tBMD) also increased in WJ-MCS-EVs treatment groups, whereas BMD value had no significant changes in all groups. Furthermore, mice treated with both 100 μg or 200 μg WJ-MSC-EVs had much Po(tot) and Po.V(tot) compared to those in the OVX-PBS group (Figure 5C).
 |
Figure 5 In vivo and ex vivo of μCT imaging and quantitative analysis. (A and B) 3D-µCT in vivo and ex vivo images of trabecular and cortical bone microstructure in OVX-PBS, OVX-100 μg EVs, OVX-200 μg EVs, and Sham groups. (C and D) Images were further quantitatively analyzed by μCT. The parameters including BMD, tBMD, BV/TV, Tb.N, Tb.Th, Tb.Sp, Po.V(tot), and Po(tot) were acquired. Data are expressed as mean±SD (*p<0.05, **p<0.01, ***p<0.005). Abbreviations: BMD, bone marrow density; μCT, micro-CT; OVX, ovariectomized; EV: extracellular vesicles. |
The mice were sacrificed 4 months after ovariectomy surgery and the ipsilateral femurs were imaged by μCT and the parameters of osteoporosis were analyzed. The characterization of microstructure obtained by μCT images was similar to those at 2 months post OVX (Figure 5B). The results of ex vivo μCT imaging showed that the value of BMD, tBMD, BV/TV, Tb. Th, Tb. N, Po.V(tot), and Po(tot) still improved by exogenous treatment of 200 μg EVs, whereas 100 μg EVs did not maintain the equivalent therapeutic effect (Figure 5D). Additionally, significant improvements in those parameters were also observed in the OVX-200 μg UC EVs group in comparison with the OVX-PBS group, suggesting that the therapeutic potential was not altered when the MSC-EVs were isolated from different techniques. (Supplemental Figure S4A and B). Collectively, exogenous WJ-MSCs-EVs significantly retarded the progression of osteoporosis in the OVX mice model. However, the therapeutic capacity of 100 μg of WJ-MSCs-EVs was not as effective as that of 200 μg of WJ-MSCs-EVs according to the μCT results.
Examination of the Changes of Bone Formation After Exogenous WJ-MSC-EVs Treatment
Tissue architecture of distal femur was observed by staining with hematoxylin and eosin, and the histological images showed a greater number of osteoclasts and lipids, but fewer osteoblasts in the PBS-treated group (OVX-PBS), compared to EV-treated or sham groups (Figure 6A). TRAP staining revealed that the amounts of osteoclast were much more than the EV-treated or sham group (Figure 6C). For quantitative analysis, the value of BV, BV/TV, adiposity as well as the area of the osteoclast were calculated. In the EV treated group, the value of BV and BV/TV were significantly increased (Figure 6B), whereas adiposity and the area of the osteoclast were diminished (Figure 6B and D). To evaluate the canonical osteoblastic gene expression of mice bone tissues after treatment, the expression of ALP, OCN, DKK1, β-catenin, Osx, and RUNX2 were assessed by qRT-PCR. In line with the result obtained from in vitro assay, the expression of ALP, OCN, and β-catenin expression increased 1–2 folds after treatment with 100 μg and 200 μg EVs with the downregulation of DKK1, however, Osx and RUNX2 were not significantly elevated. Collectively, treatment with exogenous WJ-MSC-EVs improved the bone loss of mice and improved ALP, OCN, DKK1, and β-catenin genes expressions. (Supplemental Figure S5).
 |
Figure 6 Histomorphometric analyses of skeletal tissues. (A) The images of H&E staining in OVX-PBS, OVX-100 μg EVs, OVX-200 μg EVs, and Sham groups. Yellow arrow, osteoclasts; dotted yellow arrow, osteoblasts; yellow arrowhead; lipids. (B) The value of BV and BV/TV, and adiposity were measured. (C) Staining of TRAP in OVX-PBS, OVX-100 μg EVs, OVX-200 μg EVs, and Sham groups. Red arrowhead, osteoclasts. (D) Quantification of osteoclasts area were analyzed. Data are expressed as mean±SD (*p<0.05, **p<0.01, ***p<0.005). Scale bar: 50 μm. Abbreviations: BV/TC, bone volume fraction; EV, extracellular vesicles; H&E, hematoxylin and eosin; OVX, ovariectomized; EV, extracellular vesicles; TRAP, tartrate-resistant acid phosphatase. |
MicroRNA/mRNA Sequencing in EVs Cargo and Mice Bone Tissues
The top 10 most enriched microRNAs in the WJ-MSC-EVs were examined in our previous study46 (Supplemental Figure S6A), for further investigation, the connection of these miRNAs with potential signaling pathways in osteoporosis was investigated by ingenuity pathway analysis (IPA). The accepted regulators of osteoporosis including RUNX2, ALPL (ALP), DKK1, BGLAP (Osteocalcin), TNFSF11 (RANKL), TNFRSF11B (Osteoprotegerin), and SP7 (Osterix) were clustered in the networks (Supplemental Figure S7A). Besides, the molecules that were involved in BMP and PI3K/AKT signaling pathway, were considered in the analysis (Supplemental Figure S7B and C). The results further showed that mir-29, mir-21, mir-221, and let-7a may potentially regulate BMP and the PI3K/AKT signaling pathway for treating osteoporosis.
At 2 months post treatment by WJ-MSC-EVs or PBS (4 months post OVX), the bone tissues of mice femur were extracted, systematically compared, and their RNA sequences were assessed. Heatmap and volcano plot of screened differentially expressed genes (DEGs) demonstrated that the collagen type X alpha 1 chain (Col10a1), collagen type II alpha 1 chain (Col2a1), immunoglobulin heavy constant gamma 1 (Ighg1), immunoglobulin kappa variable 6–13 (Igkv6-13), and Immunoglobulin kappa chain variable 3–5 (Igkv3-5) were upregulated by the treatment of WJ-MSC-EVs (Figure 7 and Supplemental Figure S8). Both Col10a1 and Col2a1 were upregulated during endochondral ossification. Furthermore, the enrichment of gene ontology (GO) terms, which classify the function of screened genes, was analyzed. The top 30 enrichment of GO terms were represented with the bar plot, showing the upregulated or downregulated genes of OVX mice after treatment (Figure 8A). The network plot highlighted the significantly upregulated GO terms (adjusted p<0.005), most of them were found associated with extracellular matrix (ECM) (Figure 8B). Interestingly, the PI3K/AKT signaling pathway was highlighted by the Kyoto Encyclopedia of Genes and Genomes pathway analysis due to its significant increase in expression in the ECM (Supplemental Figure S9), indicating that EV-miRNAs might target the PI3K/AKT signaling pathway by upregulating the expression of ECM-related genes.
 |
Figure 7 RNA sequencing heatmap. Hierarchical clustering of upregulated (red) and downregulated (blue) genes induced by exogenous WJ-MSC-EVs in OVX mice were analyzed. Screened genes were displayed based on Z-scored by the DESeq2 method. Abbreviations: OVX, ovariectomized; WJ-MSC-EVs, Wharton’s jelly-mesenchymal stem cell-derived extracellular vesicles. |
 |
Figure 8 Bar plot and network plot of enriched GO terms. (A) Top 30 enrichment of GO terms for differentially expressed intersection in OVX mice after EVs treatment. (B) The network plot extra demonstrated the connection of each GO term. P.adjust scale bar was illustrated. Abbreviations: GO, gene ontology; OVX, ovariectomized; EV, extracellular vesicles. |
Discussion
The present study complemented the recent studies of using MSC-EVs for the treatment of osteoporosis. The combination of [18F]NaF PET, µCT, and DIR dye provided investigators with a novel in vivo imaging strategy to effectively assess the therapeutic effect of EV-based therapy for osteoporosis. Integration of the imaging strategy with mRNA/microRNA sequencing could be served as a regular methodology in EV-based research to accelerate the individualized treatment of osteoporosis.
With the immune-privileged status and no risk of cancer formation, MSC-EVs have become an alternative therapeutic strategy in the treatment of various diseases.48,49 In general, MSC-EVs exert a similar therapeutic effect in disease treatment with their parental cells.50 “Homing”, one of the actions that MSCs exert their therapeutic effects, describes that the injured tissues secrete certain factors which attract MSCs in their vicinity. Whether MSC-EVs have similar homing activity during the treatment of osteoporosis was an interesting question.51 In a previous study, the researchers observed that unless combined with alendronate, the mouse MSC-EVs did not target bone tissues.52 This result was in line with that observed in this study, which showed that the exogenous WJ-MSC-EVs after systemic injection failed to target the femurs or other bond regions in OVX mice or the healthy mice group. This result was performed by IVIS fluorescent imaging after mice were systemically injected with DIR-labeled MSC-EVs. IVIS offers a simple, rapid, and non-radiation method for in vivo tracking of MSC-EVs. However, the issue of concern was the signal from free DIR dye in undesired regions. In the previous study, we found that free DIR dye might cause false positive signals in the liver and spleen. Nevertheless, the regions such as femurs monitored in this study were distant from those organs and were not affected.53
The injected 18F ion binds to hydroxyapatite crystals, and forms fluorapatite, reflecting the bone perfusion and bone turnover as imaging by 18F/μPET/CT images.54 After acquiring the images, quantitative analysis of bone turnover is necessary for the assessment of diseases with diffuse alteration to bone remodeling.55 The correlation of 18F-NaF uptake and therapeutic outcomes in osteoporosis was observed. Bisphosphonate (alendronate) treatment showed decreased accumulation of 18F-NaF through the concomitant inhibition of the bone formation and bone resorption, while relatively lower restriction of osteoblast activity led to the improvement of osteoporosis.56,57 According to our findings, μPET/CT imaging showed significantly increased uptake of [18F]NaF in MSC-EV-treated mice, indicating that the curative effects might attribute to the direct or indirect promotion of the osteoblastic activity in osteoporotic mice. Considering quantitative analysis, the results were significantly affected by different quantitative methods for the measurement of selected ROIs. In preclinical PET, %ID/cc and SUV are generally used to calculate tracer uptakes from the ROIs. The SUV obtained as the %ID/cc multiplied by the weight is considered as a reliable measurement of radiotracer uptake.58 Maximum SUV (SUVmax) is commonly used in oncology, but the accumulation in bone is a uniform distribution, elucidating that SUVmean is feasible for calculating the uptake of [18F]NaF in osteoporotic mice.59 Although the thorough analysis of blood flow, metabolic rate, bone turnover, the pharmacokinetics of [18F]NaF provides more information in the assessment of osteoporosis, the quantitative analysis of ROIs by SUVmean is a more simple and convenient way to obtain valuable results.60
In the present study, RNA sequencing results showed that the expression of Col10a1 and Col2a1 genes were upregulated in the bone tissues of the mice treated with WJ-MSC-EVs, and both genes have key roles in entochondrostosis.61 During chondrocyte maturation, Col10a1 is specifically expressed by hypertrophic chondrocytes in the hypertrophic zone of the growth plate, whereas the mutation of Col10a1 might cause growth plate defects and skeletal disorders.62 Col2a1 is a type of ECM-specific gene, which is synthesized by chondrocytes and is highly expressed in the fetal growth plate; the mutation of Col2a1 can lead not only to spondyloepiphyseal dysplasia but also to bone loss.63,64 In the GO terms analysis, the GO terms related to ECM production and organization abounded in EV-treated mice; major functions of the ECM are to serve as a support for deposition of minerals and provide structural flexibility for tissues.65 Collagen is a member of ECM families, which promotes bone formation and affects the binding of osteoclasts; in this study, the collagen-related ontology was also highlighted in GO analysis. However, the results of RNA sequencing of mice did not reveal the direct interaction between screened genes and osteoblast-related or osteoclast-related genes. This might be caused by the complexity of signaling pathways, or depth of sequencing, or limitation of samples size. Combining the results of μPET/CT images and RNA sequencing, we speculate that exogenous WJ-MSC-EVs retard osteoporosis by targeting ECM-related genes and indirectly promote osteoblastic activity.
According to our results of NGS and IPA, the miRNAs enriched in WJ-MSC-EVs, including mir-21, mir-29, and mir-221, are associated with PTEN and AKT molecules in the PI3K/AKT signaling pathway. Among these three potential candidates, the mir-29 expression was approximately 3-fold higher than the others, suggesting that mir-29 might be predominantly involved in the curative effect. However, the sample without duplicates might cause misleading results, so for further confirmation, the samples were analyzed and the top three enriched miRNAs obtained from NGS were detected by qPCR (Supplemental Figure S6B). Combining results of miRNA/mRNA sequencing, exogenous WJ-MSC-EVs might exert their therapeutic effect by carrying potential EV-miRNAs including mir-21, mir-29, and mir-221 to upregulate the expression of ECM-related genes, and activate the PI3K/AKT signaling pathway to treat osteoporosis. However, further exploration of the detailed mechanism is needed.
Utilization of PET/CT/IVIS in the diagnosis of osteoporosis allows researchers not only to obtain anatomical information but also to acquire the osteoblastic activity and in vivo behavior of exogenous EVs. Integrating imaging strategy with small/mRNA sequencing further clarified the information of gene-level differential expression in EVs and mice. However, the strategy might be restricted by accessibility, as the laboratories are not equipped with these imaging modalities. Fortunately, the affordable small-animal PET systems and the availability of mini cyclotrons that regularly produce radiopharmaceuticals is becoming possible for providing the services for most of the imaging research centers.66 Thus, more imaging cores/research centers can provide the service for investigators. In terms of RNA sequencing, although different powers of libraries for downstream analysis might affect the outcomes of sequencing, it still generates vast bioinformation with much smaller costs in comparison to microarrays.67 With the continuous decrease in the cost of analysis, RNA sequencing is widely used in research.68 Taken together, our work provided a prominent and valuable methodology in the diagnosis of osteoporosis by integrating an imaging strategy with RNA sequencing.
Conclusions
In conclusion, this study highlighted a methodology of integrating multiplexed molecular imaging with miRNA/mRNA sequencing for the development of EV-based medication for osteoporosis. This work also reveals that MSC-EV-miRNAs, including mir-21, mir-29, and mir-221, potentially mediate the curative effect of osteoporosis by targeting the PI3K/AKT signaling pathway. Collectively, MSC-EVs serve as a promising agent for osteoporosis treatment. This study provides an integrated solution for a more comprehensive evaluation of the therapeutic effect of WJ-MSC-EVs in the treatment of osteoporosis.
Abbreviations
MSC-EVs, mesenchymal stem cell-derived extracellular vesicles; WJ-MSCs, Wharton’s jelly mesenchymal stem cells; WJ-MSC-EV, extracellular vesicles derived from Wharton’s jelly mesenchymal stem cells; TEM, transmission electron microscopy; NTA, nanoparticle tracking analysis; OVX mice, ovariectomized mice; µPET/CT, micro-positron emission tomography-computed tomography; µCT, micro-computed tomography; [18F]NaF, fluorine-18-sodium fluoride; miRNAs, microRNAs; EV-miRNAs, EV-carried miRNAs; BM-MSCs, bone marrow mesenchymal stem cells; ROI, region of interest; %ID/cc, percent injected dose per cubic centimeter; SUV, standardized uptake values; SUVmean, average intensity within a lesion; BMD, bone mineral density; tBMD, trabecular bone mineral density; Tb.Th, trabecular thickness; Tb.N, trabecular number; Tb.Sp, trabecular separation; Po.V(tot), total volume of pore space; Po(tot), total porosity (percent); BV/TV, trabecular bone volume; NGS, next-generation sequencing; IPA, ingenuity pathway analysis; DEGs, differentially expressed genes; GO, gene ontology; ECM, extracellular matrix; Col10a1, collagen type X alpha 1 chain; COL2A1, collagen type II alpha 1 chain; RUNX2, runt-related transcription factor 2; ALP, alkaline phosphatase; OPG, osteoprotegerin; DKK1, dickkopf WNT signaling pathway inhibitor 1; RANKL, receptor activator of nuclear factor kappa-Β ligand; OCN, osteocalcin; Osx, osterix.
Acknowledgments
We thank the Department of Nuclear Medicine, Taipei Veterans General Hospital for kindly providing 18F-fluoride solution. We thank the Taiwan Mouse Clinic (MOST-109-02740-B-001-004) which is funded by the National Research Program for Biopharmaceuticals (NRPB) at the Ministry of Science and Technology (MOST) of Taiwan for technical support in small animal PET/CT and IVIS 50 imaging experiment. This work was also supported in part by the imaging core facility in NYCU. We thank the Electron Microscopy Facility in NYCU for technical support in TEM imaging. We thank the Core Lab for Phenomics and Diagnostics, Kaohsiung Chang Gung Memorial Hospital, Kaohsiung, Taiwan for use of supports.
Funding
This work was financially supported by Ministry of Science and Technology, Taiwan (MOST 110-2314-B-350-002) and Molecular and Genetic Imaging Center, National Yang Ming Chiao Tung University and Taiwan Animal Consortium (MOST 110‐2740‐B‐001‐002), and Kaohsiung Medical University Research Foundation (KMU-DK110005 and KMU-M11010).
Disclosure
The authors have declared that no competing interest exists.
References
1. Dobbs MB, Buckwalter J, Saltzman C. Osteoporosis: the increasing role of the orthopaedist. Iowa Orthop J. 1999;19:43–52.
2. Phetfong J, Sanvoranart T, Nartprayut K, et al. Osteoporosis: the current status of mesenchymal stem cell-based therapy. Cell Mol Biol Lett. 2016;21(1):12. doi:10.1186/s11658-016-0013-1
3. Rahman MS, Akhtar N, Jamil HM, Banik RS, Asaduzzaman SM. TGF-beta/BMP signaling and other molecular events: regulation of osteoblastogenesis and bone formation. Bone Res. 2015;3(1):15005. doi:10.1038/boneres.2015.5
4. Lacey DL, Boyle WJ, Simonet WS, et al. Bench to bedside: elucidation of the OPG-RANK-RANKL pathway and the development of denosumab. Nat Rev Drug Discov. 2012;11(5):401–419. doi:10.1038/nrd3705
5. Liu W, Zhang X. Receptor activator of nuclear factor-kappaB ligand (RANKL)/RANK/osteoprotegerin system in bone and other tissues (review). Mol Med Rep. 2015;11(5):3212–3218. doi:10.3892/mmr.2015.3152
6. Rasmusson L, Abtahi J. Bisphosphonate associated osteonecrosis of the jaw: an update on pathophysiology, risk factors, and treatment. Int J Dent. 2014;2014:471035. doi:10.1155/2014/471035
7. Ensrud KE, Crandall CJ. Bisphosphonates for postmenopausal osteoporosis. JAMA. 2019;322(20):2017–2018.
8. Giuliani N, Pedrazzoni M, Negri G, Passeri G, Impicciatore M, Girasole G. Bisphosphonates stimulate formation of osteoblast precursors and mineralized nodules in murine and human bone marrow cultures in vitro and promote early osteoblastogenesis in young and aged mice in vivo. Bone. 1998;22(5):455–461. doi:10.1016/S8756-3282(98)00033-7
9. Papapetrou PD. Bisphosphonate-associated adverse events. Hormones. 2009;8(2):96–110. doi:10.14310/horm.2002.1226
10. Kim KM, Abdelmohsen K, Mustapic M, Kapogiannis D, Gorospe M. RNA in extracellular vesicles. Wiley Interdiscip Rev RNA. 2017;8(4):4. doi:10.1002/wrna.1413
11. Chen YA, Lu CH, Ke CC, Liu RS. Mesenchymal stem cell-derived extracellular vesicle-based therapy for Alzheimer’s disease: progress and opportunity. Membranes. 2021;11:10.
12. Maji S, Matsuda A, Yan IK, Parasramka M, Patel T. Extracellular vesicles in liver diseases. Am J Physiol Gastrointest Liver Physiol. 2017;312(3):G194–G200. doi:10.1152/ajpgi.00216.2016
13. Raposo G, Stoorvogel W. Extracellular vesicles: exosomes, microvesicles, and friends. J Cell Biol. 2013;200(4):373–383. doi:10.1083/jcb.201211138
14. Lai RC, Chen TS, Lim SK. Mesenchymal stem cell exosome: a novel stem cell-based therapy for cardiovascular disease. Regen Med. 2011;6(4):481–492. doi:10.2217/rme.11.35
15. van Balkom BWM, Gremmels H, Giebel B, Lim SK. Proteomic signature of mesenchymal stromal cell-derived small extracellular vesicles. Proteomics. 2019;19(1–2):e1800163. doi:10.1002/pmic.201800163
16. Batrakova EV, Kim MS. Using exosomes, naturally-equipped nanocarriers, for drug delivery. J Control Release. 2015;219:396–405. doi:10.1016/j.jconrel.2015.07.030
17. Bulut O, Gu I. Mesenchymal stem cell derived extracellular vesicles: promising immunomodulators against autoimmune, autoinflammatory disorders and SARS-CoV-2 infection. Turk J Biol. 2020;44(3):273–282. doi:10.3906/biy-2002-79
18. Batsali AK, Georgopoulou A, Mavroudi I, Matheakakis A, Pontikoglou CG, Papadaki HA. The role of bone marrow Mesenchymal Stem Cell Derived Extracellular Vesicles (MSC-EVs) in normal and abnormal hematopoiesis and their therapeutic potential. J Clin Med. 2020;9(3):3. doi:10.3390/jcm9030856
19. Chen CY, Rao SS, Tan YJ, et al. Extracellular vesicles from human urine-derived stem cells prevent osteoporosis by transferring CTHRC1 and OPG. Bone Res. 2019;7(1):18. doi:10.1038/s41413-019-0056-9
20. Hu Y, Xu R, Chen CY, et al. Extracellular vesicles from human umbilical cord blood ameliorate bone loss in senile osteoporotic mice. Metabolism. 2019;95:93–101. doi:10.1016/j.metabol.2019.01.009
21. Hu Y, Zhang Y, Ni CY, et al. Human umbilical cord mesenchymal stromal cells-derived extracellular vesicles exert potent bone protective effects by CLEC11A-mediated regulation of bone metabolism. Theranostics. 2020;10(5):2293–2308. doi:10.7150/thno.39238
22. Kuang MJ, Huang Y, Zhao XG, et al. Exosomes derived from Wharton’s jelly of human umbilical cord mesenchymal stem cells reduce osteocyte apoptosis in glucocorticoid-induced osteonecrosis of the femoral head in rats via the miR-21-PTEN-AKT signalling pathway. Int J Biol Sci. 2019;15(9):1861–1871. doi:10.7150/ijbs.32262
23. Christiansen BA. Effect of micro-computed tomography voxel size and segmentation method on trabecular bone microstructure measures in mice. Bone Rep. 2016;5:136–140. doi:10.1016/j.bonr.2016.05.006
24. Chappard D, Retailleau-Gaborit N, Legrand E, Basle MF, Audran M. Comparison insight bone measurements by histomorphometry and microCT. J Bone Miner Res. 2005;20(7):1177–1184. doi:10.1359/JBMR.050205
25. Berger F, Lee YP, Loening AM, et al. Whole-body skeletal imaging in mice utilizing microPET: optimization of reproducibility and applications in animal models of bone disease. Eur J Nucl Med Mol Imaging. 2002;29(9):1225–1236. doi:10.1007/s00259-002-0850-1
26. Kuyumcu S, Adalet I, Isik EG, Unal SN. Impact of nonosseous findings on (18) F-NaFPET/CT in a patient with ductal breast carcinoma. Nucl Med Mol Imaging. 2014;48(1):72–74. doi:10.1007/s13139-013-0235-3
27. Zhang V, Koa B, Borja AJ, et al. Diagnosis and monitoring of osteoporosis with total-body (18) F-SodiumFluoride-PET/CT. PET Clin. 2020;15(4):487–496. doi:10.1016/j.cpet.2020.06.011
28. Fragogeorgi EA, Rouchota M, Georgiou M, Velez M, Bouziotis P, Loudos G. In vivo imaging techniques for bone tissue engineering. J Tissue Eng. 2019;10:2041731419854586. doi:10.1177/2041731419854586
29. Irmler IM, Gebhardt P, Hoffmann B, et al. 18 F-Fluoride positron emission tomography/computed tomography for noninvasive in vivo quantification of pathophysiological bone metabolism in experimental murine arthritis. Arthritis Res Ther. 2014;16(4):R155. doi:10.1186/ar4670
30. Bhure U, Roos JE, Strobel K. Osteoid osteoma: multimodality imaging with focus on hybrid imaging. Eur J Nucl Med Mol Imaging. 2019;46(4):1019–1036. doi:10.1007/s00259-018-4181-2
31. Beheshti M, Mottaghy FM, Paycha F, et al. (18)F-NaF PET/CT: EANM procedure guidelines for bone imaging. Eur J Nucl Med Mol Imaging. 2015;42(11):1767–1777. doi:10.1007/s00259-015-3138-y
32. Hulsart-Billstrom G, Selvaraju RK, Estrada S, et al. Non-invasive tri-modal visualisation via PET/SPECT/muCT of recombinant human bone morphogenetic protein-2 retention and associated bone regeneration: a proof of concept. J Control Release. 2018;285:178–186. doi:10.1016/j.jconrel.2018.07.012
33. Smyth T, Kullberg M, Malik N, Smith-Jones P, Graner MW, Anchordoquy TJ. Biodistribution and delivery efficiency of unmodified tumor-derived exosomes. J Control Release. 2015;199:145–155. doi:10.1016/j.jconrel.2014.12.013
34. Kocijan R, Weigl M, Skalicky S, et al. MicroRNA levels in bone and blood change during bisphosphonate and teriparatide therapy in an animal model of postmenopausal osteoporosis. Bone. 2020;131:115104. doi:10.1016/j.bone.2019.115104
35. Guo L, Zhao RC, Wu Y. The role of microRNAs in self-renewal and differentiation of mesenchymal stem cells. Exp Hematol. 2011;39(6):608–616. doi:10.1016/j.exphem.2011.01.011
36. Valinezhad Orang A, Safaralizadeh R, Kazemzadeh-Bavili M. Mechanisms of miRNA-mediated gene regulation from common downregulation to mRNA-specific upregulation. Int J Genomics. 2014;2014:970607. doi:10.1155/2014/970607
37. Ge Y, Wang X. The role and mechanism of exosomes from umbilical cord mesenchymal stem cells in inducing osteogenesis and preventing osteoporosis; 2020.
38. Li P, Kaslan M, Lee SH, Yao J, Gao Z. Progress in exosome isolation techniques. Theranostics. 2017;7(3):789–804. doi:10.7150/thno.18133
39. Thery C, Amigorena S, Raposo G, Clayton A. Isolation and characterization of exosomes from cell culture supernatants and biological fluids. Curr Protoc Cell Biol. 2006;30(1):3–22. doi:10.1002/0471143030.cb0322s30
40. Hung CF, Chen WY, Aljuffali IA, Lin YK, Shih HC, Fang JY. Skin aging modulates percutaneous drug absorption: the impact of ultraviolet irradiation and ovariectomy. Age. 2015;37(2):21. doi:10.1007/s11357-015-9757-1
41. Lasser C, Eldh M, Lotvall J, Isolation and characterization of RNA-containing exosomes. J Vis Exp. 2012;(59):e3037. doi:10.3791/3037
42. Kern S, Eichler H, Stoeve J, Kluter H, Bieback K. Comparative analysis of mesenchymal stem cells from bone marrow, umbilical cord blood, or adipose tissue. Stem Cells. 2006;24(5):1294–1301. doi:10.1634/stemcells.2005-0342
43. Chang CW, Chou TK, Liu RS, et al. A robotic synthesis of [18F]fluoromisonidazole ([18F]FMISO). Appl Radiat Isot. 2007;65(6):682–686. doi:10.1016/j.apradiso.2007.01.005
44. Czernin J, Satyamurthy N, Schiepers C. Molecular mechanisms of bone 18F-NaF deposition. J Nucl Med. 2010;51(12):1826–1829. doi:10.2967/jnumed.110.077933
45. Egan KP, Brennan TA, Pignolo RJ. Bone histomorphometry using free and commonly available software. Histopathology. 2012;61(6):1168–1173. doi:10.1111/j.1365-2559.2012.04333.x
46. Chen YA, Lu CH, Ke CC, et al. Mesenchymal stem cell-derived exosomes ameliorate Alzheimer’s disease pathology and improve cognitive deficits. Biomedicines. 2021;9:6.
47. Thery C, Witwer KW, Aikawa E, et al. Minimal information for studies of extracellular vesicles 2018 (MISEV2018): a position statement of the International society for extracellular vesicles and update of the MISEV2014 guidelines. J Extracell Vesicles. 2018;7(1):1535750. doi:10.1080/20013078.2018.1535750
48. Kalimuthu S, Gangadaran P, Li XJ, et al. In Vivo therapeutic potential of mesenchymal stem cell-derived extracellular vesicles with optical imaging reporter in tumor mice model. Sci Rep. 2016;6(1):30418. doi:10.1038/srep30418
49. Haney MJ, Klyachko NL, Zhao Y, et al. Exosomes as drug delivery vehicles for Parkinson’s disease therapy. J Control Release. 2015;207:18–30. doi:10.1016/j.jconrel.2015.03.033
50. Lai RC, Yeo RW, Lim SK. Mesenchymal stem cell exosomes. Semin Cell Dev Biol. 2015;40:82–88. doi:10.1016/j.semcdb.2015.03.001
51. Obermeyer TS, Yonick D, Lauing K, et al. Mesenchymal stem cells facilitate fracture repair in an alcohol-induced impaired healing model. J Orthop Trauma. 2012;26(12):712–718. doi:10.1097/BOT.0b013e3182724298
52. Wang Y, Yao J, Cai L, et al. Bone-targeted extracellular vesicles from mesenchymal stem cells for osteoporosis therapy. Int J Nanomedicine. 2020;15:7967–7977. doi:10.2147/IJN.S263756
53. Lu CH, Chen YA, Ke CC, et al. Preclinical characterization and in vivo imaging of (111) in-labeled mesenchymal stem cell-derived extracellular vesicles. Mol Imaging Biol. 2020;23(3):361–371 doi:10.1007/s11307-020-01562-0.
54. Brenner AI, Koshy J, Morey J, Lin C, DiPoce J. The bone scan. Semin Nucl Med. 2012;42(1):11–26. doi:10.1053/j.semnuclmed.2011.07.005
55. Wong KK, Piert M. Dynamic bone imaging with 99mTc-labeled diphosphonates and 18F-NaF: mechanisms and applications. J Nucl Med. 2013;54(4):590–599. doi:10.2967/jnumed.112.114298
56. Park PSU, Raynor WY, Sun Y, Werner TJ, Rajapakse CS, Alavi A. (18)F-sodium fluoride PET as a diagnostic modality for metabolic, autoimmune, and osteogenic bone disorders: cellular mechanisms and clinical applications. Int J Mol Sci. 2021;22:12.
57. Pazianas M, van der Geest S, Miller P. Bisphosphonates and bone quality. Bonekey Rep. 2014;3:529. doi:10.1038/bonekey.2014.24
58. Kuntner C, Stout DB. Quantitative preclinical PET imaging: opportunities and challenges. Front Phys. 2014;2:12. doi:10.3389/fphy.2014.00012
59. Blake GM, Siddique M, Frost ML, Moore AE, Fogelman I. Imaging of site specific bone turnover in osteoporosis using positron emission tomography. Curr Osteoporos Rep. 2014;12(4):475–485. doi:10.1007/s11914-014-0231-2
60. Ayubcha C, Zirakchian Zadeh M, Stochkendahl MJ, et al. Quantitative evaluation of normal spinal osseous metabolism with 18F-NaF PET/CT. Nucl Med Commun. 2018;39(10):945–950. doi:10.1097/MNM.0000000000000891
61. Zhan Q, Gui X, Wang F, et al. Sialoglycoprotein isolated from the eggs of Gadus morhua enhances fracture healing in osteoporotic mice. Food Funct. 2017;8(3):1094–1104. doi:10.1039/C6FO01346E
62. Balla B, Kosa JP, Kiss J, et al. Different gene expression patterns in the bone tissue of aging postmenopausal osteoporotic and non-osteoporotic women. Calcif Tissue Int. 2008;82(1):12–26. doi:10.1007/s00223-007-9092-3
63. Yang Y, Fan X, Tao J, et al. Impact of prenatal hypoxia on fetal bone growth and osteoporosis in ovariectomized offspring rats. Reprod Toxicol. 2018;78:1–8. doi:10.1016/j.reprotox.2018.02.010
64. Rolvien T, Yorgan TA, Kornak U, et al. Skeletal deterioration in COL2A1-related spondyloepiphyseal dysplasia occurs prior to osteoarthritis. Osteoarthritis Cartilage. 2020;28(3):334–343. doi:10.1016/j.joca.2019.12.011
65. Alford AI, Kozloff KM, Hankenson KD. Extracellular matrix networks in bone remodeling. Int J Biochem Cell Biol. 2015;65:20–31. doi:10.1016/j.biocel.2015.05.008
66. Yao R, Lecomte R, Crawford ES. Small-animal PET: what is it, and why do we need it? J Nucl Med Technol. 2012;40(3):157–165. doi:10.2967/jnmt.111.098632
67. Hubbard A, Bomhoff M, Schmidt CJ. fRNAkenseq: a fully powered-by-CyVerse cloud integrated RNA-sequencing analysis tool. PeerJ. 2020;8:e8592. doi:10.7717/peerj.8592
68. Naidoo S, Visser EA, Zwart L, Toit YD, Bhadauria V, Shuey LS. Dual RNA-sequencing to elucidate the plant-pathogen duel. Curr Issues Mol Biol. 2018;27:127–142. doi:10.21775/cimb.027.127
 © 2021 The Author(s). This work is published and licensed by Dove Medical Press Limited. The full terms of this license are available at https://www.dovepress.com/terms.php and incorporate the Creative Commons Attribution - Non Commercial (unported, v3.0) License.
By accessing the work you hereby accept the Terms. Non-commercial uses of the work are permitted without any further permission from Dove Medical Press Limited, provided the work is properly attributed. For permission for commercial use of this work, please see paragraphs 4.2 and 5 of our Terms.
© 2021 The Author(s). This work is published and licensed by Dove Medical Press Limited. The full terms of this license are available at https://www.dovepress.com/terms.php and incorporate the Creative Commons Attribution - Non Commercial (unported, v3.0) License.
By accessing the work you hereby accept the Terms. Non-commercial uses of the work are permitted without any further permission from Dove Medical Press Limited, provided the work is properly attributed. For permission for commercial use of this work, please see paragraphs 4.2 and 5 of our Terms.