")
Back to Journals » International Journal of Nanomedicine » Volume 16
Liver Targeting of Daclatasvir via Tailoring Sterically Stabilized Bilosomes: Fabrication, Comparative In Vitro/In Vivo Appraisal and Biodistribution Studies
Authors El-Nabarawi M, Nafady M, Elmenshawe S , Elkarmalawy M , Teaima M
Received 8 May 2021
Accepted for publication 30 August 2021
Published 17 September 2021 Volume 2021:16 Pages 6413—6426
DOI https://doi.org/10.2147/IJN.S319255
Checked for plagiarism Yes
Review by Single anonymous peer review
Peer reviewer comments 2
Editor who approved publication: Dr Ebrahim Mostafavi
Mohamed El-Nabarawi,1 Mohamed Nafady,2 Shahira Elmenshawe,3 Marwa Elkarmalawy,4 Mahmoud Teaima1
1Department of Pharmaceutics and Industrial Pharmacy, Faculty of Pharmacy, Cairo University, Cairo, Egypt; 2Department of Pharmaceutics and Clinical Pharmacy, Faculty of Pharmacy, Nahda University, Beni-Suef, Egypt; 3Department of Pharmaceutics and Industrial Pharmacy, Faculty of Pharmacy, Beni-Suef University, Beni-Suef, Egypt; 4Department of Pharmaceutics and Industrial Pharmacy, Faculty of Pharmacy, Modern University of Technology and Information, Cairo, Egypt
Correspondence: Shahira Elmenshawe Email [email protected]
Introduction: Hepatitis C virus (HCV) is a significant public health concern that threatens millions of individuals worldwide. Daclatasvir (DAC) is a promising direct-acting antiviral approved for treating HCV infection around the world. The goal of this study was to encapsulate DAC into novel polyethylene glycol (PEG) decorated bilosomes (PEG-BILS) to achieve enhanced drug delivery to the liver.
Methods: DAC-loaded BILS were primed by a thin film hydrating technique. The study of the impact of various formulation variables on the properties of BILS and selection of the optimal formulation was generated using Design-Expert® software. The optimum preparation was then pegylated via the incorporation of PEG-6-stearate (5% w/w, with respect to the lipid phase).
Results: The optimum PEG-BILS formulation, containing PL:SDC ratio (5:1), 5 mg cholesterol, and 30 min sonication, yielded spherical vesicles in the nanoscale (200± 15.2 nm), elevated percent of entrapment efficiency (95.5± 7.77%), and a sustained release profile of DAC with 35.11± 2.3% release. In vivo and drug distribution studies revealed an enhanced hepatocellular delivery of DAC-loaded PEG-BILS compared to DAC-unPEG-BILS and DAC suspension, where DAC-PEG-BILS achieved 1.19- and 1.54 times the AUC0– 24 of DAC-unPEG-BILS and DAC suspension, respectively. Compared with DAC-unPEG-BILS and DAC suspension, DAC-PEG-BILS delivered about 2 and 3 times higher DAC into the liver, respectively.
Conclusion: The innovative encapsulation of DAC-PEG-BILS has a great potential for liver targeting.
Keywords: antiviral drug, nanodrug delivery system, bile-based nanovesicles, Box–Behnken approach, liver targeting parameters, pharmacokinetic, bioavailability
Introduction
One of the most serious infections that elicits a high level of concern for public health is the hepatitis C virus (HCV), which threatens millions of individuals worldwide.1 It is the most critical cause for the development of liver cirrhosis, liver failure, hepatocellular carcinoma, and, finally, liver transplantation.2 The HCV treatment landscape has been advancing rapidly over the past 10 years.3 A new direct-acting antiviral drug, daclatasvir (DAC), is approved for use in over 60 countries around the world for treating HCV infection in adults3 as it has a rapid declining effect on HCV-RNA, where it targets two steps in the process of viral replication by inhibiting HCV non-structural protein NS5A.4 DAC is said to be a biopharmaceutical classification system class II compound (low solubility/high permeability).4
The major problems with standard pharmacological treatment are the inability to deliver a sufficient amount of active therapeutic agent to the diseased liver and the undesirable systemic effects.5 Thus, distinct liver targeting can be accomplished using specific drug transporters such as vesicular nanocarrier systems. There are two ways by which targeting of nanocarriers may be achieved, namely passive and active targeting.
The passive targeting strategy is based on the nanocarrier’s size and general surface properties, such as surface charge, degree of hydrophobicity, and non-specific adhesion, which guide them towards certain organs.6 To successfully reach the hepatocytes, the circulating nanocarrier should exhibit a small particle size with a diameter smaller than the liver sinusoidal fenestrations (up to 150–200 nm).6,7 However, upon systemic administration, nanocarrier formulations will encounter a series of biological obstacles during in vivo transport.8 One of these obstacles is the disintegration of conventional nanocarriers by the collective effects of gastric acid, intestinal bile salts, and pancreatic lipase,9 leading to decreasing concentrations of intact vesicles and payload leakage.10 Another obstacle is the fast undefined phagocytic engulfment of conventional and unpegylated nanocarriers from the blood by the immune system cells. This results in a very shortened half-life and accumulation of these vesicles in the organs of the reticuloendothelial system (RES), eg, liver, spleen, and lung.10
Modified stabilized nanovesicular carriers called bilosomes (BILS) are formulated by embedding the bile salts within the lipid bilayers; this results in fabricating stable vesicles capable of opposing the destruction by the bile salts in the gastrointestinal tract. This stability offered by bile salt vesicles was ascribed to the repulsion between the bile salts enclosed in the vesicle bilayer and the intestinal bile salts present in the gastrointestinal tract, hence offering a strong barrier against the hostile environment in the gastrointestinal tract for the entrapped drug.11
For elongation of the in vivo circulating lifetime of drug carriers, the use of “stealthy” molecules is an adequate technique. A stealthy modified carrier is capable of escaping recognition by the mononuclear phagocyte system (MPS), thus avoiding rapid clearance by the human body. The phagocytic rate is mainly affected by the hydrophilicity and lipophilicity of the surface of the nanovesicles. As the lipophilic nature of the surface of the nanovesicles increases, there will be a powerful phagocytic effect due to the strong bond between the particle and opsonin. Therefore, to elongate the in vivo circulation time of nanoparticles, it is essential to modify the nanoparticle surface to make it more hydrophilic. To address this problem, various hydrophilic polymers, including poly(vinyl alcohol), poly(N-vinylpyrrolidone), poly(2-oxazoline), and poly(ethylene glycol) (PEG), and zwitterionic polymers, such as poly(carboxybetaine methacrylate),12 have been introduced to yield more hydrophilic nanoparticles and to decrease MPS reuptake.12–14 PEG is one of the most hydrophilic molecules that is commonly used as an example of a stealthy polymer. The PEGylation of nanovesicles results in a reduction in their electrostatic charge, by forming an aqueous layer surrounding them, thus avoiding their renal clearance. In addition, PEG chains are characterized by being flexible and stretchable. When opsonin attracts PEGylated vesicles, the PEG chains will be compressed and condensed, resulting in the conversion of their original conformation to a steric hindered state, thus preventing the attraction between opsonin and the particles and, hence, avoiding their uptake by the MPS.13
To the best of our knowledge, the previous literature lacks satisfactory data about any targeting drug delivery of DAC to the liver. Thus, this investigation was established to achieve two major goals. The first one was to formulate small-diameter DAC ultra-deformable BILS with a modified surface by covalent attachment with a flexible hydrophilic polymer, such as polyethylene glycol (PEG). Accordingly, to reach this goal, several variables affecting the properties of BILS were investigated to identify the optimal bilosomal formulation employing the Box–Behnken design approach using Design-Expert® software followed by pegylation of the selected optimal formulation. For the second goal, in vivo pharmacokinetic and drug distribution investigations of the PEG-BILS were performed in comparison to unPEG-BILS and DAC suspension.
Materials and Methods
Materials
Daclatasvir (DAC), dialysis cellulosic membrane (12,000–14,000 molecular weight cut-off), acetonitrile (HPLC grade), methanol (HPLC grade), ethanol (95%), and torsemide (IS) were received from Sigma-Aldrich (Cairo, Egypt), PEG-6-stearate (Superpolystate®) was kindly supplied by Gattefossé (Lyon, France), L-α-phosphatidylcholine15 (soybean lecithin), sodium deoxycholate (SDC), and cholesterol (CH) were purchased from Acros Organics (Cairo, Egypt). All other chemical reagents and solvents were of analytical grade and were commercially obtainable.
Preparation of DAC-Loaded BILS
A thin film hydration technique was adopted to prepare DAC-loaded BILS.16 In brief, in a clean, dry, round-bottom flask containing chloroform, PL, DAC, bile salt (sodium deoxycholate), and CH were dissolved. The resultant organic phase was removed by evaporation using a rotary evaporator (Rotavapor, Heidolph VV 2000; Heidolph Instruments, Kelheim, Germany) under a temperature of 60°C and reduced pressure for 45 min until a thin, dry film was achieved. Subsequently, the obtained dry film was rehydrated for 15 min at room temperature with 10 mL saline phosphate buffer pH 7.4, under a rotation speed of 60 rpm. Then, the flask containing hydrated crude dispersion was sonicated using a UH-100B ultrasonic processor sonicator (Tianjin Automatic Science Instrument, Nanyang, China) to produce DAC. The formed opalescent dispersion of BILS was stored at 4°C until characterization.
To prepare PEGylated BILS, PEG-6-stearate (5% w/w, with respect to the total weight of the lipid phase) was added to the organic solution after dissolving PL, DAC, bile salt (sodium deoxycholate), and CH, then completing all the procedures mentioned in the previous paragraph.
Characterization and Optimization of DAC-Loaded BILS
Determination of Particle Size Polydispersity Index (PDI) and Zeta Potential (ZP)
The average particle size and PDI of the formulated dispersions were measured using a Zetasizer Nano ZS (Malvern Instruments, Malvern, UK) using the dynamic light scattering technique. In brief, the samples were diluted 15 times using deionized water, to obtain an efficient light scattering intensity, then the temperature was maintained at 25°C. The sample was exposed to laser light beam that was adjusted to 633 nm and scattered with an incident angle of 90°.16,17 Determination of ZP was performed using the same instrument. The approach analyzes the electrophoretic motion of the particles in an electrical field using the same diluted sample. All measurements were carried out three times.18
Determination of DAC Entrapment Efficiency Percent (EE%)
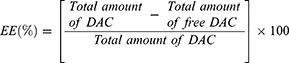
The EE% of DAC in BILS was obtained indirectly by adopting the cooling centrifuge method.19 Thus, the free DAC (non-entrapped drug) in the vesicular dispersion medium was measured by separation of the supernatant from the formulated bilosomal nanovesicles. In brief, for a duration of 1 h, the bilosomal dispersion was centrifuged using a cooling centrifuge (Sigma Laborzentrifugen, Germany) adjusted to 14,000 rpm and 4°C. Then, the supernatant was separated, diluted, and filtered using a nylon syringe filter of 0.45 µm. The concentration of non-entrapped DAC was then obtained spectrophotometrically (Shimadzu UV Spectrophotometer [1601/PC] Kyoto, Japan) by determining the UV absorbance at λmax 317 nm. The drug EE% was then calculated referring to the following equation:
In Vitro Release Studies
The in vitro release of DAC from BILS was investigated using the dialysis method.16,20 In brief, 1 mL volumes of DAC-loaded BILS dispersions containing 1 mg drug were placed in plastic cylindrical tubes with two opening ends; one end was strongly sealed with presoaked cellulose membrane (12,000–14,000 cut-off mol. wt) representing the permeation area, and the other end was attached to the shaft of the USP dissolution tester (apparatus one; Hanson Research, Chatsworth, USA) and lowered into a vessel containing 1000 mL phosphate buffer (pH 6.8) with 0.75% Brij 35. The temperature was adjusted to 37°C and stirred with a rotation speed of 75 rpm. All of the previous conditions were adjusted as per FDA guidelines for in vitro dissolution.21 According to the prearranged plan, 5 mL samples were withdrawn at a fixed time interval for 24 h and were replaced with the same volume of fresh buffer to retain the sink condition. The amount of DAC released from BILS was measured by a UV spectrophotometer at λmax 317 nm. Experiments were repeated three times.
Optimization of BILS by Box–Behnken Statistical Design
Optimization was carried out following the Box–Behnken design to determine the variables that may influence the characteristics of a new drug delivery system. The Box–Behnken design is a famous template for response surface methodology as it requires three levels only for each experimental factor and only a few of all the possible combinations. In this design, the region of the experiment is expressed as a cube, and experiments are carried out at points corresponding to the midpoint of each edge and replicated experiments at the center of this multidimensional cube. The entire design is composed of 15 experimental runs that consist of 12 factor runs and three replications at the center point.22 In this study, formulation of a suitable delivery system for DAC-loaded BILS was generated by constructing a design with the aid of Design-Expert software (version 8, Stat-Ease, MN, USA). The chosen factors and the levels used were explored depending on preliminary trials (data not shown) to determine the probable ranges of the independent variables. This design is suitable for explicating the main, interaction, and quadratic effects of the independent variables on the characteristics of the prepared formulation.23,24 The polynomial equation produced by the Box–Behnken experimental design is introduced below.

where Y is the dependent variable response related to each factor–level combination; (Y1) is particle size, (Y2) is EE%, and (Y3) is % drug release; b0 is an intercept;25 b1, b2, and b3 are regression coefficients; b12, b13, and b23 are interaction coefficients, while b11, b22, and b33 are quadratic coefficients produced from the resultant experimental values of response from experimental runs; and A, B, and C are the coded intensity of independent variables, where the PL:SDC ratio (A) and CH amount (B) are formulation variables, while (C) is the sonication time, which is a process variable introduced as low (−1), medium (0), and high (+1), as described in Table S1.
Characterization of Optimized DAC-Loaded BILS After Being PEGylated
Determination of PS, PDI, ZP, EE%, and Percent Drug Release
The same procedures previously described for the characterization of un-PEGylated BILS in Determination of Particle Size, Polydispersity Index (PDI), and Zeta Potential (ZP) section were adopted.
Transmission Electron Microscopy
The inherent morphology and size of optimized DAC-unPEG-BILS and DAC-PEG-BILS were assessed using a CM10 transmission electron microscope (Philips, Eindhoven, Netherlands), with 100 kV accelerating voltage. Before measuring, distilled water was used to dilute the sample. On a carbon-coated copper grid, a droplet of the sample was added and was left to stand at room temperature for 90 s to make a thin film, with any excess sample being removed using filter paper. Phosphotungstic acid (2% w/v) was used to negatively stain the vesicles for 5 min and then the grid was allowed to dry at room temperature before the examination. The sample was viewed and photomicrographs were taken at appropriate magnification.16,26
In Vivo Pharmacokinetic Study
Experimental Animals
The pharmacokinetics and biodistribution of the orally administered PEG-BILS containing DAC were compared with orally administered DAC-unPEG-BILS and conventional DAC suspension. The Animal Ethics Committee of the Faculty of Pharmacy, Cairo University (P1/2130), approved the protocol of the in vivo studies. All the experimental steps for drug administration, and blood and tissue assembly followed the 8th edition of the Guide for the Care and Use of Laboratory Animals reported in 2011 by the United States National Academy of Sciences. A total of 144 male albino Wistar rats, in the weight range 180–200 g, were received from the Animal House of the Faculty of Pharmacy, Nahda University (Beni-Suef, Egypt), and used in the in vivo studies.
Drug Administration and Biological Sample Collection
The albino Wistar rats were stored in well-spaced cages with suitable ventilation and provided with a healthy and fixed diet. Eighteen Wistar rats were randomly assigned to three groups of the same number (ie, six rats in each group). DAC was administered in a dose of 60 mg/kg.27 The first group received an oral suspension (6 mg/mL) of DAC in phosphate buffer (pH 6.8). Animals in the second group were given unPEG-BILS containing an equivalent amount of drug dose. The third group was given PEG-BILS containing an equivalent amount of drug dose. The formulations were orally administered in suspension form, followed by a sufficient volume of drinking water. Then, multiple blood samples (1–2 mL) were taken by retro-orbital venous plexus puncture at fixed time intervals of 0.5, 1, 2, 3, 4, 6, and 24 h. Blood samples were collected in heparinized Vacutainer tubes. Samples were centrifuged at 3500 rpm for 10 min at 4°C to separate plasma. The separated plasma was placed directly into 5 mL plastic tubes and kept frozen at −20°C to be available for drug analysis.
Tissue Distribution Studies
The remaining 126 rats were randomly distributed into three groups, each comprising 18 rats. Each rat in the first group was administered a single oral dose of 60 mg/kg of DAC suspension. Animals in the second group were given unPEG-BILS containing an equivalent amount of drug, while animals of the third group received PEG-BILS containing an equivalent amount of drug dose. After 0.5, 1, 2, 3, 4, 6, and 24 h of dosing, three rats from each group were anesthetized with chloroform then slaughtered by cervical dislocation. Livers were removed directly after cervical dislocation at various times, then blood was washed off with saline solution and soaked up with dry tissue paper; using a homogenizer, 1 g of separated liver was homogenized (Yellow-Line disperser, IKAs Works, USA) in saline phosphate buffer (pH 7.4, 3 mL). The supernatant of the liver homogenate was obtained by centrifugation at 6000 rpm at 4°C for 30 min. Finally, it was stored at −70°C until analysis.28
Chromatographic Conditions
Quantitative analysis of the plasma concentrations was carried out using a liquid chromatography–tandem mass spectroscopy (LC-MS/MS) method.29 The detection was performed using an LC system (AB Sciex, USA) connected to a Triple Quad API-4000 mass spectrometer (AB Sciex, Canada) equipped with a Turbo Ion Spray™ interface at 350°C. Quantitation was conducted by MS/MS detection in positive ion mode for both DAC and torsemide internal standard (IS). The chromatographic separations were carried out on a Sunfire C18 column (50×2.1 mm packed with 5 µm particle size; Waters, Milford, MA, USA). The mobile phase was pumped with an isocratic elution program containing 80% acetonitrile and 20% of 0.01 M ammonium formate pumping at a flow rate of 1 mL/min. Detection of the ions was carried out in the multiple reactions monitoring (MRM) mode, monitoring the transition of m/z 739.338 → 565.300 for DAC and m/z 348.956 → 264.300 for IS. The other mass spectrometry30 parameters for the analysis were as follows: the declustering potential, energy of the collision, and collision exit potential were 151, 59, and 20 V for DAC and 76, 24, and 8 V for IS, respectively. Data acquisition was carried out with the aid of Analyst 1.6 software (AB Sciex) to monitor all parameters.
Sample Preparation for Analysis
For each plasma sample, 100 µL of IS (from a stock solution of 1000 ng/mL concentration) in addition to 0.5 mL plasma was vortexed for a duration of 1 min, followed by the addition of 4 mL ethyl acetate, then vortexed again for 1 min. The upper organic layer was separated by centrifugation using a cooling centrifuge for 10 min at 2500 rpm and 4°C (model 2–16PK; Sigma). Then, the supernatant was transferred in a clean test tube and filtered using a Millipore filter of 0.22 µm. For complete solvent evaporation, the test tube was placed in a concentrator for 45 min at 60°C. Subsequently, 200 µL of the mobile phase was used to reconstitute the obtained dry residues. The sample was vortexed for 5 min, then the supernatant was separated by centrifugation for 10 min at 3000 rpm, and finally, 10 µL of this clear supernatant was injected into the column for detection.
Pharmacokinetic and Statistical Analysis
Non-compartmental pharmacokinetic analysis was performed to generate all the pharmacokinetic parameters using PK-Solver, a freely available menu-driven add-in program for Microsoft Excel.31 The trapezoidal method was used to calculate the area under the curve (AUC) from 0 to 24 (AUC0–24, ng.h/mL) of the plasma concentration (Cp) as a function of time (t).30
Evaluation of Targeting Efficiency
The in vivo targeting efficiency of the prepared PEG-BILS, unPEG-BILS, and DAC suspension to the liver after orally administration was evaluated by calculating the following targeting parameters.32
Statistical Analysis
All the results achieved from the experiment were presented as mean ± SD. Statistical analysis was performed with a one-way ANOVA test using SPSS® software version 22 followed by Tukey’s post-hoc test, where a value of p<0.05 was considered statistically significant.33
Results and Discussion
Preparation and Optimization of DAC-Loaded BILS
DAC-loaded BILS formulations were prepared to adopt a three-factor, three-level Box–Behnken statistical design (Table 1) with the aid of Design-Expert software (version 10, State-Ease, Minneapolis, MN, USA). All individual and interactive effects of independent variables were investigated, All the responses recorded for the 15 runs were fitted to various models using Design-Expert software and it was observed that the best-fitting model was quadratic (p<0.0001). Table S2 presents a summary of the regression analysis results for Y1, Y2, and Y3 responses for fitting to the quadratic. Three-dimensional response surface plots produced by the Design-Expert software are presented in Figure 1, which demonstrate the interaction effects of the independent variables on the responses, besides their benefit in investigating the effects of two factors on one response at a time. Figure S1 quantitatively illustrates the comparison of the generated experimental values of the responses against their predicted values.
 |
Table 1 Observed Box–Behnken Experimental Runs of DAC-Loaded BILS with Their Actual and Predicted Experimental Values of Y1, Y2, and Y3 |
 |
Figure 1 Response surface plots for the effect of ratio of PL:SDC (A), CH amount (B), and sonication time (C) on (Y1) particle size, (Y2) EE%, and (Y3) % drug release. |
Fitting of Data to the Model
Adequate precision calculates the signal-to-noise ratio to confirm that the model can be applied to navigate the design space.34 As presented in Table S2, a ratio greater than 4 (the desirable value) was obtained in all responses. Also, to measure the applicability of the model to predict a response value, the predicted R2 was calculated. It was concluded that the predicted R2 was in reasonable accordance with the adjusted R2 value as the difference between them is approximately 0.20.18,34
Effect of Formulation Variables on Particle Size (Y1)
Nanomaterial-based medicine can provide great opportunities to enable drugs to reach their target sites, either passively or actively.35 Table 1 presents the particle size values of the formulated BILS as the z-average diameter, which represents the mean hydrodynamic diameter of the particles.36 The BILS were in the nanoscale range, as their particle size ranged between 290±10 and 480±5 nm. The influence of PL:SDC (A), CH amount (B), and sonication time (C) on the PS of the BILS is graphically illustrated as 3D response surface plots in Figure 1A. Statistical analysis showed that PL:SDC (A) had a significant effect on PS (p<0.0001). As per the polynomial equation, Table S2, the particle size was directly dependent on the effect of PL:SDC (A); as the ratio of PL:SDC was raised, the particle size was increased. It was noticeable that a ratio of 7:1 produced particle sizes ranging from 385±14 to 480±15 nm. The decrease in vesicles size with the increasing amount of SDC in the BILS lipid bilayer led to an increase in flexibility and a reduction membrane tension between the aqueous and lipid phases, which resulted in vesicles with a small particle size in the nanoscale.23 Our findings are the same as the results reported by Guan et al, who stated that the smaller ratio of PL:SDC was the most significant factor in producing small particle size of probilosomes containing cyclosporine A.37 Also, our findings are in agreement with Ahad et al, who found that elevation in the ratio of PL:SDC led to a decrease in the particle size of liposomes consisting of bile salt.38 Moreover, sonication time (C) exhibited a negative significant influence on BILS particle size, according to the statistical analysis (p<0.0001), where prolonging the duration for which the sample was exposed to sonication in the last stage of BILS development led to a direct decrease in the particle size. This was in accordance with the findings of de Freitas et al, who stated that upon preparation of small unilamellar vesicles, increasing sonication time resulted in decreasing both particle size and PDI values.39 El-Say et al claimed that the most critical factor affecting particle size was the sonication time; supporting this claim, there was an inverse relationship between sonication time and particle size upon preparation of niosomes uploaded with diacerein.41 However, the amount of CH (B) did not significantly influence the vesicle size of the BILS (p=0.0764).
Concerning the homogeneity of the fabricated BILS, all of the BILS formulations were characterized by having a mono-dispersed size distribution, as their PDI ranged from 0.2 to 0.3 (Table 1).
Effect of Formulation Variables on EE%
The potential of the formulated BILS to retain a high amount of DAC is critical for its potential manipulation as a successful liver targeting delivery system. The percent of DAC entrapped within the BILS ranged from 85±2.65% to 97±1.40% (Table 1). The influence of PL:SDC (A), CH amount (B), and sonication time (C) on the percent of DAC entrapped within the BILS is graphically illuminated as 3D surface plots in Figure 1B. Concerning the PL:SDC (A), statistical analysis proved that this variable significantly affected EE% (p=0.0004). As per the polynomial equation (Table S2), the effect of PL:SDC (A) was in direct relation to EE%, where EE% was increased with the increase in the PL:SDC ratio (ie, the increase in PL:SDC ratio was accompanied by a decrease in the amount of bile salt used). Our findings are in agreement with Chen et al, who claimed that the maximum EE% was found at a ratio 3:1 PL:SDC while the minimum was at ratios of 5:1 and 6:1 PL:SDC, upon preparation of liposomes containing a bile salt uploaded with fenofibrate.41 This could be explained on the basis that, upon increasing the bile salts concentration, drug solubility increases in the dispersion medium owing to the coexistence of mixed micelles and vesicles, and consequently lessening the EE%.18 Another possible explanation for lowering the DAC entrapped in BILS, introduced by Aburahma, was the fluidizing effect of bile salts on the vesicles’ lipid bilayers, since, at elevated bile salt concentration, the loss of the entrapped drug occurred.11
With respect to CH amount (B), factorial ANOVA revealed that this variable was significantly affecting EE% (p=0.0004). As per the polynomial equation (Table S2), the EE% was directly dependent on the effect of CH amount (B). It was clearly shown from our results that raising the amount of CH caused a simultaneous enhancement in EE%. Our results are in consonance with Khalil et al and El-Nabarawi et al, who claimed that there was an increase in the EE% of BILS with the increasing amount of CH.17,42 CH is well known for enhancing the hydrophobicity and rigidity of lipid bilayer membranes, leading to highly ordered vesicles with significant membrane stability accompanied by limited drug permeability and consequently higher drug retention.19,42
Matloub et al proposed another explanation for the increase in the EE% of BILS upon increasing the amount of CH, which was that CH can eliminate gel-to-liquid phase transition of the surfactant bilayer, consequently increasing the microviscosity of the vesicle’s membrane. This makes the hydrophobic bilayer more stable, preventing leakage of drug and increasing the vesicles’ EE%.43 In contrast to the significance of the previous two variables, sonication time (C) had an insignificant effect on the EE% of prepared BILS (p=0.473).
Effect of Formulation Variables on Percent Drug Release
In vitro release studies are a very important parameter as they reflect the in vivo execution of a drug delivery system. However, their main limitation is the absence of the entire simulation of in vivo digestion, and they do not consider the probability of vesicular destruction under physiological conditions.11
As shown in Table 1, the slow release of DAC from all bilosomal formulations over 24 h ranged from 33±3.61% to 47±2.02%. This may be due to the colloidal nature of BILS as drug reservoirs.44 Another explanation is the high affinity of DAC for the hydrophobic ingredients in the formulations, which is in agreement with Mohsen et al, who claimed that the slow release of silymarin from BILS/liposome was due to its high affinity to the lipophilic nature of these vesicles.45
ANOVA results showed that all three variables, PL:SDC (A), CH amount (B), and sonication time (C), had a significant effect on the percent of DAC released from the BILS, which is graphically presented in 3D surface plots in Figure 1C. Regarding PL:SDC (A) and CH amount (B), both of these had a significant negative effect on DAC release from the BILS, which was observed from their polynomial equation (Table S2), where the increase in the ratio of PL:SDC (A) was accompanied by a decrease in the amount of bile salt, leading to a decrease in DAC release from BILS. This result is in accordance with the findings of El-Nabarawi et al, who claimed a notable improvement in dapsone release from BILS upon increasing the bile salt concentration from 0.25 to 0.5 M.17 The presence of bile salt embedded in the BILS bilayer leads to drainage of the lipophilic drug and facilitates its release.20 Further, when the bile salt is embedded between the vesicles’ bilayers, they were converted into mixed micelles, leading to an increased solubility rate of DAC and augmenting its release.11
The CH amount (B) exhibited a negative significant effect on % DAC release (p<0.0001). Our results agree with the findings of Khalil et al42 and Ruckmani and Sankar, who reported a remarkable decrease in drug release at a higher CH level.46 A possible reason for this is that incorporation of CH during the preparation of the vesicles enhanced lipid packing and decreased fluidity and deformability of the lipid bilayers, thus enhancing bilayer rigidity, reducing drug leakage, and making the vesicles more stable.24,43 Khelashvilia et al offered an interpretation for the mechanical stiffness enhancement of the vesicles’ membranes upon the incorporation of CH.47 He suggested that, the composition of the CH molecule, which consists of a planar ring with four fused steroid rings attached to a hydroxyl group and a hydrophobic tail, allows CH to be self-oriented inside the bilayer, where the steroid ring will align parallel to the hydrocarbon chains of the membrane PL, the hydroxyl group will make a hydrogen bond with the polar head groups of the PL, and the rigid steroid ring will interact with the hydrocarbon chains, which will result in opposing the splay mode of deformation between pairs of lipids and CH. This explanation is in line with Ayee and Levitan’s report.48
On the other hand, the duration of sonication was proved to exhibit a positive significant effect on % DAC release, and it is clearly shown in Table 1 that as the sonication time was increased, the percent of drug release was also increased. The reason for the positive effects of sonication parameters was introduced by Harbi et al, who claimed that this increase was a reflection of the vesicular sizes; upon decreasing the vesicular sizes, the lamellar diffusion areas will increase resulting in higher drug release.49 These findings are also supported by El-Helw and Fahmy, who reported a remarkable improvement in fluvastatin release, rationalizing it by claiming a connection between the size of the particles and the percent of drug release from BILS; the smaller size generated from a long sonication time will be accompanied by a higher surface area, resulting in an enhanced release rate.50
Optimization
The optimized DAC-loaded BILS formulation was chosen depending on the point prediction method of Box–Behnken design, where the desirability function was applied to select the most robust formulation that met the required goal of all responses within the stated limitations.23 Figure S2A–C presents several essential graphs: the graph of the desirability bar (Figure S2A), the associated 3D desirability graph (Figure S2B), and the contour desirability graph (Figure S2C) of the optimized formulation. The DAC-loaded BILS formulation showed a desirability of 0.825 for all of the responses.
The Design-Expert software generated an optimized preparation based on the results of experimental runs. The specified values of the independent variables, PL:SDC ratio, cholesterol amount, and time for sonication of the optimized formulation, were 5:1, 5 mg, and 30 min, respectively. The optimized BILS depending on the affirmed formulation result in a vesicle of size 285±10.8 nm, EE% of 93±5.67%, and % release of DAC 45±7.13%. As presented in Table S3, the actual values of the optimum preparation were highly in agreement with the predicted ones, resulting in a limited percentage of prediction error, ranging from 1.07% to 4.44% for various responses, confirming the accuracy and adequacy of the given mathematical model for dependent response speculation. This makes this the optimum formulation for further investigation.
Characterization of Optimized DAC-Loaded BILS After PEGylation
Particle Size, Polydispersity Index (PDI), and Zeta Potential Measurement
The inclusion of PEG produced a significantly smaller particle size (200±15.2 nm) compared with the un-pegylated (unPEG) variants (285±10.8 nm), which is emphasized by the TEM micrograph in Figure 2. This phenomenon was explained by Detampel et al, who claimed that the contribution of PEG-200 led to lipid bilayer dehydration, which enhanced the lateral packing of the fatty acid acyl chains and resulted in smaller particle size.51 Another reason, introduced by Shehata et al, was that PEG may provide an aqueous layer on the BILS surface, which results in limiting the aggregation of PEG BILS because of steric hindrance.52 This reduction in aggregation resulted in the production of BILS of smaller size than the unPEG BILS. This was in accordance with the results produced by Davarpanah et al and Tsermentseli et al.53,54 Concerning PDI, the dispersion is considered to be mono-dispersed, as the PDI was 0.227±0.015, which was less than 0.35.55 In this study, the obtained ZP value of optimized PEG-BILS was −25±2.6 mV, which is on the negative side due to the immobilization of polyethylene glycol to the bilosomal surface.53,56 This negative ZP has also been reported in previous studies formulating different PEG nanocarriers.22,53,57
 |
Figure 2 Transmission electron micrograph of unPEG-BILS (A) and PEG-BILS (B) optimum formulation. |
Entrapment Efficiency
There was a slight increase in DAC EE% in the case of PEG-BILS in comparison to unPEG-BILS (95.5±7.77% and 93±5.67%, respectively). This may be accredited to the PEG coat on the outer surface of the lipid bilayer resulting in an enhancement of the drug entrapped within the bilayer. These results are in agreement with similar studies.54,58
Transmission Electron Microscopy
TEM was conducted to investigate the morphology of unPEG-BILS and PEG-BILS. As observed in Figure 2, the examined sample exhibited homogeneous, discrete spherical particles with a lipid bilayer and with the absence of any irregular vesicles. The particle size of the vesicles measured by Zetasizer was typically in accordance with that obtained using TEM. In addition, a higher magnification demonstrated that the vesicles of PEG-BILS exhibited a smooth surface and sharp edges, with the coexistence of a PEG coat (lighter shade) framing the BILS. This is in accordance with previous findings.19,20,59
In Vitro Drug Release Study
The % release of DAC from PEG-BILS was decreased compared to unPEG-BILS, as shown in Figure S3 (35.11±2.3% and 45.21±7.13%, respectively). This slow release in PEG-BILS could be due to the presence of a PEG corona on the BILS surface, which retarded DAC diffusion from the BILS interior owing to the fast movement of the PEG hydrophilic chain.60 In addition, PEG-BILS exhibited high negative ZP, which may result in enhanced BILS stability and diminished BILS membrane fusion, hence lowering the DAC release out of BILS. The above results, suggest that DAC-loaded PEG-BILS would be stable in the blood circulation and would be released at a slow rate at the target site.58
Plasma Pharmacokinetics Study
Figure 3 illuminates the mean plasma concentration versus time profiles of DAC received after a single administration of DAC suspension, unPEG-BILS, and DAC-PEG-BILS in rats. The plasma concentration–time data were analyzed using the Excel Add-Ins program PK Solver software. Table 2 presents the estimated mean pharmacokinetic parameters calculated by the non-compartmental fitting of the concentration–time data of DAC with the related variability parameters. From Figure 3, it is clear that DAC-PEG-BILS delivered a greater amount of DAC to the rats’ plasma relative to DAC-unPEG-BILS and DAC suspension. The calculated AUC0–24 of DAC-PEG-BILS was significantly higher (p<0.05) than those of DAC-unPEG-BILS and DAC suspension (22,943, 19,238, and 14,892 h.ng/mL, respectively). In other words, DAC-PEG-BILS achieved 1.19 and 1.54 times the AUC0–24 compared to that obtained by DAC-unPEG-BILS and drug suspension, respectively. This may be attributed to deferred elimination of DAC when included in PEG-BILS, as shown in Table 2, where there was a significant prolongation in the elimination half-life and a remarkable decrease in the clearance. This may be due to the presence of PEG on the surface of the BILS. PEG is well known for its ability to create steric hindrance on the vesicles by the formation of a hydrolayer. This prevents vesicles from coming into contact with antibodies, opsonin, and proteases, subsequently limiting the rate of phagocytosis and degeneration. Moreover, the clearance of PEGylated vesicles was decreased through the kidney, which was accredited to the increase in the hydrodynamic volume, resulting in an increase in the plasma half-life of the drugs, as reported previously.61
 |
Table 2 Pharmacokinetic Parameters of DAC Suspension, DAC-unPEG-BILS, and DAC-PEG-BILS in Rat Plasma Following Oral Administration (n=6) |
 |
Figure 3 Mean plasma concentration–time curves of DAC in rats after oral administration of DAC suspension, DAC-unPEG-BILS, and DAC-PEG-BILS at a dose equivalent to 60 mg/kg of DAC (n=6). |
Drug Distribution
The goal of this study was to enhance the delivery of DAC in the liver, and this was the reason for studying the distribution behavior of DAC after loading into PEG-BILS, compared to DAC-unPEG-BILS and DAC suspension. As demonstrated in Figure S4, the mean liver concentration–time profile of DAC-PEG-BILS, DAC-unPEG-BILS, and DAC suspension was protracted after oral manipulation to rats. The most essential pharmacokinetic parameters in rat liver are shown in Table 3. As shown in Figure S4, the concentration of DAC suspension in liver tissue attained a peak at 2 h and then decreased quickly. In contrast, the concentration of DAC in DAC-PEG-BILS and DAC-unPEG-BILS in the liver declined more slowly than that of DAC suspension. The AUC0–24 values in DAC-unPEG-BILS and DAC-PEG-BILS were 2- and 3-fold higher, respectively, than the DAC suspension in the liver (p<0.01). These results suggest that the PEG-BILS is a promising drug carrier to the liver.
 |
Table 3 Pharmacokinetic Parameters of DAC Suspension, DAC-unPEG-BILS, and DAC-PEG-BILS in Rat Liver Following Oral Administration (n=6) |
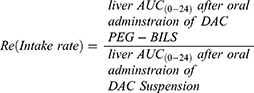
Referring to the AUC0−24 of various deliveries in the liver and the plasma, the liver targeting parameters were estimated as demonstrated in Table 4. The intake rate (Re) of DAC-unPEG-BILS and DAC-PEG-BILS in the liver was 2±0.07 and 3±0.04, respectively, implying that delivering DAC to the liver was significantly enhanced by the DAC being entrapped in PEG-BILS. This result is in agreement with previous findings.62
 |
Table 4 Hepatic Specific Targeting Parameters After Oral Administration of DAC Suspension, DAC-unPEG-BILS, and DAC-PEG-BILS in Rats (n=6) |
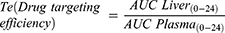
According to Gupta and Hung, liver targeting can be appraised by drug targeting efficiency (Te) depending on the knowledge of the AUC. As revealed in Table 4, the Te values of the liver in the case of PEG-BILS were 1.30±0.04 times higher than those of DAC-unPEG-BILS (Te=1.07±0.06) and DAC suspension (Te=0.64±0.01). Here, a value of Te>1 indicates higher selectivity of the PEG-BILS for the liver.63
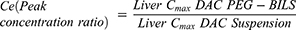
The peak concentration ratio (Ce) reflects the ability of a delivery system to change the biodistribution. The Ce value of DAC-PEG-BILS in the liver was raised by a factor of 1.21 compared to DAC-unPEG-BILS. Accordingly, it could be derived that PEG-BILS had a priority to accumulate DAC in the liver. All of these results demonstrate that DAC-PEG-BILS had a much better liver targeting potential compared to DAC-unPEG-BILS and DAC suspension.
The implementation of nanoparticles is restricted by their rapid discrimination by the RES. They are removed from the bloodstream within minutes after dose administration, based on their size and surface properties.64 In our investigation, even at 24 h after oral administration of the PEG-BILS, the accumulation of DAC in the liver was high. However, the DAC concentration in blood was observed in a lower amount at 24 h. This indicated that DAC-PEG-BILS were not rapidly removed from the blood. This suggested that DAC-PEG-BILS had avoided being recognized rapidly by Kupffer cells, and subsequently remained in the blood. This may be due to the existence of PEG on the BILS surface, which created steric hindrance on the vesicles so that they could avoid being engulfed by phagocytosis and degraded. Therefore, the drug uploaded in PEG-BILS has a great potential for liver targeting. However, further long-term studies are required on suitable animal models to confirm the superiority and tolerability of the fabricated PEG-BILS.
Conclusions
In this study, BILS was fabricated as a nanocarrier for hepatocyte-specific delivery of DAC for the management of hepatitis C. DAC-loaded BILS were formulated by adopting a thin film hydrating technique. Surface modification of bilosomes with PEG was applied to the optimized BILS formulation. The DAC-PEG-BILS were characterized by having high EE sustained release and small particle size. The bioavailability of the DAC-PEG-BILS was comparable to DAC-unPEG-BILS and DAC suspension, and the results revealed a superior increase in the concentration of DAC in plasma, delay in its clearance, and a prolonged release attribute in vivo for DAC-PEG-BILS. In addition, biodistribution studies proved that DAC-PEG-BILS introduced much more DAC into the liver and had a reasonably high concentration that lasted for a long time in comparison to DAC-unPEG-BILS and DAC suspension. Thus, the obtained results prove that bilosomes modified with PEG may possess the ability to be promoted as a successful method for specific targeted delivery of DAC to the liver.
Acknowledgments
This work was not supported by any specific grant from public funding agencies.
Disclosure
The authors state no conflicts of interest. The content and the writing of this article are the responsibility of the authors only.
References
1. Lavanchy D. Evolving epidemiology of hepatitis C virus. Clin Microbiol Infection. 2011;17(2):107–115. doi:10.1111/j.1469-0691.2010.03432.x
2. Zaman B, Siddique F, Hassan W. RP-HPLC method for simultaneous determination of sofosbuvir and ledipasvir in tablet dosage form and its application to in vitro dissolution studies. Chromatographia. 2016;79(23–24):1605–1613. doi:10.1007/s10337-016-3179-9
3. Gandhi Y, Eley T, Fura A, Li W, Bertz RJ, Garimella T. Daclatasvir: a review of preclinical and clinical pharmacokinetics. Clin Pharmacokinet. 2018;57(8):911–928. doi:10.1007/s40262-017-0624-3
4. Jagadabi V, Nagendra Kumar P, Mahesh K, Pamidi S, Ramaprasad L, Nagaraju D. A stability-indicating UPLC method for the determination of potential impurities and its mass by a new QDa mass detector in daclatasvir drug used to treat hepatitis C infection. J Chromatogr Sci. 2019;57(1):44–53. doi:10.1093/chromsci/bmy079
5. Böttger R, Pauli G, Chao P-H, Al-Fayez N, Hohenwarter L, Li S-D. Lipid-based nanoparticle technologies for liver targeting. Adv Drug Deliv Rev. 2020;154–155:79–101.
6. El-Kharrag R, Amin A, Greish YE. Low temperature synthesis of monolithic mesoporous magnetite nanoparticles. Ceramics Int. 2012;38(1):627–634. doi:10.1016/j.ceramint.2011.07.052
7. Rabanel M, Aoun V, Elkin I, Mokhtar M, Hildgen P. Drug-loaded nanocarriers: passive targeting and crossing of biological barriers. Curr Med Chem. 2012;19(19):3070–3102. doi:10.2174/092986712800784702
8. Liu J, Li M, Luo Z, Dai L, Guo X, Cai K. Design of nanocarriers based on complex biological barriers in vivo for tumor therapy. Nano Today. 2017;15:56–90. doi:10.1016/j.nantod.2017.06.010
9. Hu S, Niu M, Hu F, et al. Integrity and stability of oral liposomes containing bile salts studied in simulated and ex vivo gastrointestinal media. Int J Pharm. 2013;441(1–2):693–700. doi:10.1016/j.ijpharm.2012.10.025
10. He H, Lu Y, Qi J, Zhu Q, Chen Z, Wu W. Adapting liposomes for oral drug delivery. Acta pharmaceutica sinica B. 2019;9(1):36–48. doi:10.1016/j.apsb.2018.06.005
11. Aburahma MH. Bile salts-containing vesicles: promising pharmaceutical carriers for oral delivery of poorly water-soluble drugs and peptide/protein-based therapeutics or vaccines. Drug Deliv. 2016;23(6):1847–1867.
12. Xue W, Trital A, Shen J, Wang L, Chen S. Zwitterionic polypeptide-based nanodrug augments pH-triggered tumor targeting via prolonging circulation time and accelerating cellular internalization. ACS Appl Mater Interfaces. 2020;12(41):46639–46652. doi:10.1021/acsami.0c11747
13. Di J, Gao X, Du Y, Zhang H, Gao J, Zheng A. Size, shape, charge and “stealthy” surface: carrier properties affect the drug circulation time in vivo. Asian J Pharmaceutical Sci. 2020. doi:10.1016/j.ajps.2020.07.005
14. Zheng L, Sundaram HS, Wei Z, Li C, Yuan Z. Applications of zwitterionic polymers. React Funct Polym. 2017;118:51–61. doi:10.1016/j.reactfunctpolym.2017.07.006
15. Kapoor M, Howard R, Hall I, Appleton I. Effects of epicatechin gallate on wound healing and scar formation in a full thickness incisional wound healing model in rats. Am J Pathol. 2004;165(1):299–307. doi:10.1016/S0002-9440(10)63297-X
16. Elkomy MH, El Menshawe SF, Abou-Taleb HA, Elkarmalawy MH. Loratadine bioavailability via buccal transferosomal gel: formulation, statistical optimization, in vitro/in vivo characterization, and pharmacokinetics in human volunteers. Drug Deliv. 2017;24(1):781–791. doi:10.1080/10717544.2017.1321061
17. El-Nabarawi MA, Shamma RN, Farouk F, Nasralla SM. Bilosomes as a novel carrier for the cutaneous delivery for dapsone as a potential treatment of acne: preparation, characterization and in vivo skin deposition assay. J Liposome Res. 2020;30(1):1–11. doi:10.1080/08982104.2019.1577256
18. Abdelbary AA, Abd-Elsalam WH, Al-mahallawi AM. Fabrication of novel ultradeformable bilosomes for enhanced ocular delivery of terconazole: in vitro characterization, ex vivo permeation and in vivo safety assessment. Int J Pharm. 2016;513(1–2):688–696. doi:10.1016/j.ijpharm.2016.10.006
19. Al-mahallawi AM, Abdelbary AA, Aburahma MH. Investigating the potential of employing bilosomes as a novel vesicular carrier for transdermal delivery of tenoxicam. Int J Pharm. 2015;485(1–2):329–340. doi:10.1016/j.ijpharm.2015.03.033
20. Albash R, El-Nabarawi MA, Refai H, Abdelbary AA. Tailoring of PEGylated bilosomes for promoting the transdermal delivery of olmesartan medoxomil: in-vitro characterization, ex-vivo permeation and in-vivo assessment. Int J Nanomedicine. 2019;14:6555. doi:10.2147/IJN.S213613
21. US FDA Center for Drug Evaluation and Research. Generic drugs division of bioequivalence. FDA Recommended Dissolution Methods. 2016.
22. Naik S, Patel D, Surti N, Misra A. Preparation of PEGylated liposomes of docetaxel using supercritical fluid technology. J Supercrit Fluids. 2010;54(1):110–119. doi:10.1016/j.supflu.2010.02.005
23. Soni K, Rizwanullah M, Kohli K. Development and optimization of sulforaphane-loaded nanostructured lipid carriers by the Box-Behnken design for improved oral efficacy against cancer: in vitro, ex vivo and in vivo assessments. Artif Cells, Nanomed Biotechnol. 2018;46(sup1):15–31. doi:10.1080/21691401.2017.1408124
24. Parashar P, Rana P, Dwivedi M, Saraf SA. Dextrose modified bilosomes for peroral delivery: improved therapeutic potential and stability of silymarin in diethylnitrosamine-induced hepatic carcinoma in rats. J Liposome Res. 2019;29(3):251–263. doi:10.1080/08982104.2018.1551408
25. Vukelic S, Stojadinovic O, Pastar I, et al. Farnesyl pyrophosphate inhibits epithelialization and wound healing through the glucocorticoid receptor. J Biol Chem. 2010;285(3):1980–1988. doi:10.1074/jbc.M109.016741
26. Aboud HM, Ali AA, El-Menshawe SF, Elbary AA. Nanotransfersomes of carvedilol for intranasal delivery: formulation, characterization and in vivo evaluation. Drug Deliv. 2016;23(7):2471–2481. doi:10.3109/10717544.2015.1013587
27. Rao TS, Sridevi M, Naidu CG, Nagaraju B. Ionic liquid-based vortex-assisted DLLME followed by RP-LC-PDA method for bioassay of daclatasvir in rat serum: application to pharmacokinetics. J Analytical Sci Tech. 2019;10(1):20. doi:10.1186/s40543-019-0179-z
28. Nasr M, Ghorab MK, Abdelazem A. In vitro and in vivo evaluation of cubosomes containing 5-fluorouracil for liver targeting. Acta pharmaceutica sinica B. 2015;5(1):79–88. doi:10.1016/j.apsb.2014.12.001
29. Abdallah OM, Abdel‐Megied AM, Gouda AS. Development and validation of LC‐MS/MS method for simultaneous determination of sofosbuvir and daclatasvir in human Plasma: application to pharmacokinetic study. Biomed Chromatography. 2018;32(6):e4186. doi:10.1002/bmc.4186
30. Dodiya S, Chavhan S, Korde A, Sawant KK. Solid lipid nanoparticles and nanosuspension of adefovir dipivoxil for bioavailability improvement: formulation, characterization, pharmacokinetic and biodistribution studies. Drug Dev Ind Pharm. 2013;39(5):733–743. doi:10.3109/03639045.2012.694889
31. Zhang Y, Huo M, Zhou J, Xie S. PKSolver: an add-in program for pharmacokinetic and pharmacodynamic data analysis in Microsoft Excel. Comput Methods Programs Biomed. 2010;99(3):306–314. doi:10.1016/j.cmpb.2010.01.007
32. Lai L, Guo H. Preparation of new 5-fluorouracil-loaded zein nanoparticles for liver targeting. Int J Pharm. 2011;404(1–2):317–323. doi:10.1016/j.ijpharm.2010.11.025
33. Moolakkadath T, Aqil M, Ahad A, et al. Preparation and optimization of fisetin loaded glycerol based soft nanovesicles by Box-Behnken design. Int J Pharm. 2020;578:119125. doi:10.1016/j.ijpharm.2020.119125
34. Vardhan MV, Sankaraiah G, Yohan M, Rao HJ. Optimization of Parameters in CNC milling of P20 steel using Response Surface methodology and Taguchi Method. Materials Today. 2017;4(8):9163–9169.
35. El-Marakby EM, Hathout RM, Taha I, Mansour S, Mortada ND. A novel serum-stable liver targeted cytotoxic system using valerate-conjugated chitosan nanoparticles surface decorated with glycyrrhizin. Int J Pharm. 2017;525(1):123–138. doi:10.1016/j.ijpharm.2017.03.081
36. Shah N, Gohil D, Seth A. Nanostructured Lipid Carriers. Efficient Drug Delivery Carrier. 2017;2:548.
37. Guan P, Lu Y, Qi J, Wu W. Readily restoring freeze-dried probilosomes as potential nanocarriers for enhancing oral delivery of cyclosporine A. Colloids Surf B Biointerfaces. 2016;144:143–151. doi:10.1016/j.colsurfb.2016.04.006
38. Ahad A, Raish M, Ahmad A, Al-Jenoobi FI, Al-Mohizea AM. Eprosartan mesylate loaded bilosomes as potential nano-carriers against diabetic nephropathy in streptozotocin-induced diabetic rats. Eur J Pharmaceutical Sci. 2018;111:409–417. doi:10.1016/j.ejps.2017.10.012
39. de Freitas CF, Calori IR, Tessaro AL, Caetano W, Hioka N. Rapid formation of Small Unilamellar Vesicles (SUV) through low-frequency sonication: an innovative approach. Colloids Surf B Biointerfaces. 2019;181:837–844. doi:10.1016/j.colsurfb.2019.06.027
40. El-Say KM, Abd-Allah FI, Lila AE, Hassan AE-SA, Kassem AEA. Diacerein niosomal gel for topical delivery: development, in vitro and in vivo assessment. J Liposome Res. 2016;26(1):57–68. doi:10.3109/08982104.2015.1029495
41. Chen Y, Lu Y, Chen J, et al. Enhanced bioavailability of the poorly water-soluble drug fenofibrate by using liposomes containing a bile salt. Int J Pharm. 2009;376(1–2):153–160. doi:10.1016/j.ijpharm.2009.04.022
42. Khalil RM, Abdelbary A, Kocova El-Arini S, Basha M, El-Hashemy HA. Evaluation of bilosomes as nanocarriers for transdermal delivery of tizanidine hydrochloride: in vitro and ex vivo optimization. J Liposome Res. 2019;29(2):171–182. doi:10.1080/08982104.2018.1524482
43. Matloub AA, Salama AH, Aglan HA, AbouSamra MM, ElSouda SSM, Ahmed HH. Exploiting bilosomes for delivering bioactive polysaccharide isolated from Enteromorpha intestinalis for hacking hepatocellular carcinoma. Drug Dev Ind Pharm. 2018;44(4):523–534. doi:10.1080/03639045.2017.1402922
44. Allam AF. Sublingual fast dissolving niosomal films for enhanced bioavailability and prolonged effect of metoprolol tartrate. Drug Des Devel Ther. 2016;10:2421–2433. doi:10.2147/DDDT.S113775
45. Mohsen AM, Asfour MH, Salama AA. Improved hepatoprotective activity of silymarin via encapsulation in the novel vesicular nanosystem bilosomes. Drug Dev Ind Pharm. 2017;43(12):2043–2054. doi:10.1080/03639045.2017.1361968
46. Ruckmani K, Sankar V. Formulation and optimization of zidovudine niosomes. AAps Pharmscitech. 2010;11(3):1119–1127. doi:10.1208/s12249-010-9480-2
47. Khelashvilia G, Johnera N, Zhaob G, Harries D, Scott HL. Molecular origins of bending rigidity in lipids with isolated and conjugated double bonds: the effect of cholesterol. Chem Phys Lipids. 2014;178:18–26. doi:10.1016/j.chemphyslip.2013.12.012
48. Ayee MA, Levitan I. Paradoxical impact of cholesterol on lipid packing and cell stiffness. Front Biosci. 2016;21:1245–1259. doi:10.2741/4454
49. Harbi I, Aljaeid B, Khalid M, Zidan AS. Glycosylated sertraline-loaded liposomes for brain targeting: qbD study of formulation variabilities and brain transport. AAPS PharmSciTech. 2016;17(6):1404–1420. doi:10.1208/s12249-016-0481-7
50. El-Helw A-RM, Fahmy UA. Improvement of fluvastatin bioavailability by loading on nanostructured lipid carriers. Int J Nanomedicine. 2015;10:5797. doi:10.2147/IJN.S91556
51. Detampel P, Witzigmann D, Krähenbühl S, Huwyler J. Hepatocyte targeting using pegylated asialofetuin-conjugated liposomes. J Drug Target. 2014;22(3):232–241. doi:10.3109/1061186X.2013.860982
52. Shehata T, Kimura T, Higaki K. In-vivo disposition characteristics of PEG niosome and its interaction with serum proteins. Int J Pharm. 2016;512(1):322–328. doi:10.1016/j.ijpharm.2016.08.058
53. Davarpanah F, Yazdi AK, Barani M, Mirzaei M, Torkzadeh-Mahani M. Magnetic delivery of antitumor carboplatin by using PEGylated-Niosomes. DARU J Pharmaceutical Sci. 2018;26(1):57–64. doi:10.1007/s40199-018-0215-3
54. Tsermentseli SK, Kontogiannopoulos KN, Papageorgiou VP, Assimopoulou AN. Comparative study of PEGylated and conventional liposomes as carriers for shikonin. Fluids. 2018;3(2):36. doi:10.3390/fluids3020036
55. Zeisig R, Shimada K, Hirota S, Arndt D. Effect of sterical stabilization on macrophage uptake in vitro and on thickness of the fixed aqueous layer of liposomes made from alkylphosphocholines. Biochimica et Biophysica Acta. 1996;1285(2):237–245. doi:10.1016/S0005-2736(96)00167-8
56. Abdelbary AA, Abd-Elsalam WH, Al-Mahallawi AM. Fabrication of levofloxacin polyethylene glycol decorated nanoliposomes for enhanced management of acute otitis media: statistical optimization, trans-tympanic permeation and in vivo evaluation. Int J Pharm. 2019;559:201–209. doi:10.1016/j.ijpharm.2019.01.037
57. Cruz LJ, Tacken PJ, Fokkink R, Figdor CG. The influence of PEG chain length and targeting moiety on antibody-mediated delivery of nanoparticle vaccines to human dendritic cells. Biomaterials. 2011;32(28):6791–6803. doi:10.1016/j.biomaterials.2011.04.082
58. Panwar P, Pandey B, Lakhera P, Singh K. Preparation, characterization, and in vitro release study of albendazole-encapsulated nanosize liposomes. Int J Nanomedicine. 2010;5:101.
59. Zhang L, Han L, Sun X, Gao D, Qin J, Wang J. The use of PEGylated liposomes to prolong the circulation lifetime of salvianolic acid B. Fitoterapia. 2012;83(4):678–689. doi:10.1016/j.fitote.2012.02.004
60. Ramana LN, Sharma S, Sethuraman S, Ranga U, Krishnan UM. Investigation on the stability of saquinavir loaded liposomes: implication on stealth, release characteristics and cytotoxicity. Int J Pharm. 2012;431(1–2):120–129. doi:10.1016/j.ijpharm.2012.04.054
61. Li T, Chen L, Deng Y, et al. Cholesterol derivative-based liposomes for gemcitabine delivery: preparation, in vitro, and in vivo characterization. Drug Dev Ind Pharm. 2017;43(12):2016–2025. doi:10.1080/03639045.2017.1361965
62. Guo B, Cheng Y, Li N, et al. In vitro and in vivo studies of galactose-modified liver-targeting liposomes. J Drug Target. 2013;21(3):257–264. doi:10.3109/1061186X.2012.741135
63. Gupta P, Hung C. Quantitative evaluation of targeted drug delivery systems. Int J Pharm. 1989;56(3):217–226. doi:10.1016/0378-5173(89)90018-5
64. Moghimi SM, Hunter AC, Murray JC. Long-circulating and target-specific nanoparticles: theory to practice. Pharmacol Rev. 2001;53(2):283–318.
 © 2021 The Author(s). This work is published and licensed by Dove Medical Press Limited. The full terms of this license are available at https://www.dovepress.com/terms.php and incorporate the Creative Commons Attribution - Non Commercial (unported, v3.0) License.
By accessing the work you hereby accept the Terms. Non-commercial uses of the work are permitted without any further permission from Dove Medical Press Limited, provided the work is properly attributed. For permission for commercial use of this work, please see paragraphs 4.2 and 5 of our Terms.
© 2021 The Author(s). This work is published and licensed by Dove Medical Press Limited. The full terms of this license are available at https://www.dovepress.com/terms.php and incorporate the Creative Commons Attribution - Non Commercial (unported, v3.0) License.
By accessing the work you hereby accept the Terms. Non-commercial uses of the work are permitted without any further permission from Dove Medical Press Limited, provided the work is properly attributed. For permission for commercial use of this work, please see paragraphs 4.2 and 5 of our Terms.