")
Back to Journals » Nature and Science of Sleep » Volume 15
Intensity and Network Structure of Insomnia Symptoms and the Role of Mental Health During the First Two Waves of the COVID-19 Pandemic
Authors Roland A , Windal M , Briganti G, Kornreich C , Mairesse O
Received 24 August 2023
Accepted for publication 7 November 2023
Published 1 December 2023 Volume 2023:15 Pages 1003—1017
DOI https://doi.org/10.2147/NSS.S432944
Checked for plagiarism Yes
Review by Single anonymous peer review
Peer reviewer comments 2
Editor who approved publication: Dr Valentina Alfonsi
Aurore Roland,1,2,* Maxime Windal,1,3,* Giovanni Briganti,4– 7 Charles Kornreich,4,5 Olivier Mairesse1,2,4,8
1Brain, Body and Cognition, Department of Psychology, Faculty of Psychology and Educational Sciences, Vrije Universiteit Brussel, Brussels, Belgium; 2Brussels University Consultation Center, Department of Psychology, Faculty of Psychology and Educational Sciences, Vrije Universiteit Brussel, Brussels, Belgium; 3Faculty of Psychology, Université Libre de Bruxelles, Brussels, Belgium; 4Laboratoire de Psychologie Médicale et Addictologie, CHU/UVC Brugmann, Brussels, Belgium; 5Faculty of Medicine, Université libre de Bruxelles, Brussels, Belgium; 6Faculty of Medicine, Université de Mons, Mons, Belgium; 7Department of Psychology, Harvard University, Cambridge, MA, USA; 8Vital Signs and PERformance Monitoring (VIPER), LIFE Department, Royal Military Academy, Brussels, Belgium
*These authors contributed equally to this work
Correspondence: Aurore Roland, Vrije Universiteit Brussel, Pleinlaan 2, 1050 Elsene, Brussels, Belgium, Tel +32 629 25 26, Email [email protected]
Purpose: Insomnia, being a mental disorder, is best conceived as a network of symptoms. With the important increase in insomnia prevalence during the COVID-19 pandemic, our aim was to investigate how the structure of insomnia symptoms in the general population has changed due to the pandemic. We also looked at the directional dependencies of nightmares and of covid- and lockdown-related stress/anxiety and depression in insomnia.
Patients and Methods: 5986 persons replied to our online questionnaire for the first wave and 2843 persons to our second wave questionnaire. Both questionnaires included the Insomnia Severity Index (ISI). Regularized Gaussian Graphical Models (GGM) and Bayesian Directed Acyclic Graphs (DAG) were estimated.
Results: The pre- and peri-lockdown networks were equally strongly connected (first wave: S = 0.13, p = 0.39; second wave: S = 0.03, p = 0.67), but differed for the first lockdown regarding only six edges (M = 0.13, p < 0.001) and for the second lockdown only five edges (M = 0.16, p < 0.001). These symptoms all worsened during the lockdowns in comparison to before the pandemic (p < 0.001). The diurnal items of the ISI had the highest predictability and centrality values in the GGMs. Lockdown-related stress/anxiety influenced indirectly nightmares through covid-related stress/anxiety, lockdown-related depressive affect and mental fatigue. These reported feelings of stress/anxiety and depression showed an indirect impact on insomnia symptoms through mental and physical fatigue.
Conclusion: Though the lockdown slightly intensified insomnia symptoms, it did not alter their network structure. Despite their differences, both GGMs and DAGs agree that the diurnal symptoms of the ISI, play an essential role in the network structure. Both methods confirm the need for emphasizing the cognitive/affective component in the treatment of insomnia (ie cognitive behavioral therapy).
Keywords: insomnia, network analysis, covid-19, nightmares, mental health
Introduction
Insomnia is a sleep disorder characterized by difficulties initiating and/or maintaining sleep and/or early morning awakenings. These sleep disturbances cause daytime impairment, distress or dissatisfaction with sleep and must occur at least three times a week and despite adequate opportunity and circumstances for sleep. In pre-COVID-19 times, it occurred in approximately 6–10% of the population,1,2 but this prevalence increased during the first wave of COVID-19 and even further during the second wave.3 Insomnia was associated with more mental distress during the first wave of the COVID-19 pandemic.4
Fear of being contaminated with COVID-19 was associated with higher odds of insomnia and nightmares.5 The latter’s frequency in Italy increased during the first wave in comparison with pre-lockdown6 and then decreased during the second wave in comparison with the first wave.7 Individuals with greater COVID-related stress were more likely to report nightmares about confinement, helplessness, anxiety, war, separation, totalitarianism, sickness, death and apocalypse scenarios.8 Following the continuity hypothesis, daytime fears were thus reflected in nighttime dreams.9
Mental disorders, including insomnia, are often conceived as an underlying cause that can be assessed through the disturbances it produces. From this point of view, these different disruptions are to be considered as interchangeable consequences of the underlying condition (ie a common cause), that is insomnia itself. Recently, a new conceptual framework, the network approach of mental disorders, has been proposed as an alternative way of conceiving and analyzing mental constructs and disorders. It regards mental disorders as complex systems in which symptoms and other components causally influence each other, arising from the set of connections that its components present. Its statistical counterpart, network analysis, is a promising tool both in the diagnosis and potentially in the treatment of mental disorders.10 The network approach allows for modeling and studying the complex interactions among components of a system,11 as well as identifying comorbidities, the impact of associated factors12 and evaluating how variables interact with each other. Directed acyclic graphs (DAGs) enable the representation of unidirectional influences between variables, which can aid in the comprehension of underlying mechanisms and of the identification of the most predictive factors.
To our knowledge, there are few studies that have specifically investigated insomnia symptoms using network analysis. We are aware of only three network analyses specifically targeting insomnia.13–15 However, none of these studies investigated the structure of insomnia symptoms in the general population during the COVID-19 pandemic. Concerning nightmares, all networks we found used nightmares as a symptom of post-traumatic stress disorder (PTSD) like those of Chen et al,16 Lazarov et al17 and of McNally et al18 to name a few. They were never linked to other sleep variables. Our study will contribute to the existing literature on the subject, adding theoretical and therapeutic knowledge regarding the examined insomnia symptomatology under network analysis.
The aim of our study was thus to investigate the network topology of insomnia symptoms in the general population during the first and second Belgian wave of COVID-19. Our research questions were:
- Do the networks of insomnia symptoms during the first and second wave of COVID-19 differ in comparison with the pre-lockdown network?
- What is the role of nightmares, covid-related stress, lockdown-related stress and lockdown-related depression in the network of insomnia symptoms during the second wave?
Materials and Methods
Participants
The sampled population during the first lockdown included 5986 individuals. Mean age was 41.20 years (SD = 15.02). 68 persons were teenagers (1.14% of the total sample) and 442 were 65+ years old (7.38% of the total sample). The majority of participants were female (n = 3987, 66.61%) and male participants were significantly older than the female participants (t(5917) = 13.71, p = < 0.001, d = 0.38). Because participants were pseudonymized, some participants may have responded to both questionnaires. 2843 individuals responded to our survey during the second lockdown. Mean age was 41.33 years (SD = 14.37). 10 persons were teenagers (0.35% of the total sample) and 156 persons were 65+ years old (5.49% of the total sample). Once again, the majority of respondents were female (n = 1930, 67.89%) and male participants were significantly older than female participants (t(2835) = 6.52, p = < 0.001, d = 0.26). A part of the data used in this study has recently been published elsewhere.3 No specific inclusion or exclusion criteria were defined a priori. However, participants with incomplete records were excluded from the analysis.
Materials and Procedure
A few weeks following the first Belgian lockdown (April 1st 2020), the first questionnaire, available in ten languages, was launched online and distributed via hospital newsletters, radio, social media, the websites of the Belgian Association of Sleep research and Sleep medicine (BASS), European Sleep Research Society (ESRS) and of the World Sleep Society as well as international and local newspapers. The last responses to be accepted were from May 22nd, 2020. Since most respondents replied to the Dutch (53.7%) and the French (29.4%) versions, we decided to only use these two versions in our analysis. On the 23rd of November 2020, the second questionnaire (available only in French and Dutch) was launched and distributed via hospital newsletters, regular media (newspapers and radio) and social media. Data were retrieved on the 6th of February 2021. Most respondents replied to the Dutch version (75.6%). Questions had to be answered in function of their situation since the start of the lockdown and then with the pre-COVID-19 situation in mind.
Since our focus was on insomnia, we used a reliable and validated questionnaire, the Insomnia Severity Index (ISI).19 Since we did not want to burden our participants too much to guarantee a greater participation of respondents, we did not use a validated questionnaire for the other aspects (mental health, nightmares, …). These were thus only briefly surveyed, but to the extent possible, the response scale conformed to that of the ISI.
The ISI is a seven-item scale measuring severity of sleep onset, sleep maintenance and early morning wakening problems, sleep dissatisfaction, interference of sleep difficulties with daytime functioning, noticeability of sleep problems by others and distress caused by the sleep difficulties. Respondents are instructed to complete the questionnaire with respect to how they felt during the past two weeks.20 However, for the purpose of the current study, instructions were modified and participants were asked to respond in function of their situation since the start of the lockdown or before the lockdown.
This study is in compliance with the Declaration of Helsinki and was approved by the Comité d’éthique hospitalier (hospital ethical committee) of the Brugmann Hospital (Brussels, Belgium; reference: CE 2023/40). Informed consent was obtained from participants.
Statistical Analysis
Paired t-tests were performed using SPSS version 28 (https://www.ibm.com/products/spss-statistics) to investigate the effect of lockdown versus the pre-lockdown situation. Network analyses was performed using R version 4.1.2 (https://www.r-project.org/) and the packages bootnet,21 qgraph,22 bnlearn version 4.8.1,23 Rgraphviz,24 and networkcomparisontest.25
Network Estimation
We estimated pairwise LASSO-regularized Gaussian Graphical Models (GGM), using partial correlations. In a GGM, each symptom (variable) is represented as a node, and the connection between two symptoms is referred to as edges. Edge weights represent (regularized) partial correlation coefficients. The partial correlation network is initially estimated by inverting the variance-covariance matrix of the data set. Then, the regularization process, namely the graphical LASSO (least absolute shrinkage and selection operator) provides a conservative network structure (with fewer edges) by combining an l-1 regularized regression with an Extended Bayesian Information Criterion (EBIC). The LASSO procedure therefore provides a more conservative model, with fewer connections. However, although the network structure is easier to investigate, one cannot infer whether two unconnected nodes are actually conditionally independent given all the other nodes, based on a regularized partial correlation network estimation.21 Nodes in the network are placed using the Fruchterman-Reingold algorithm, which puts strongly connected nodes closer than others.26
Network Inference
To identify well-connected nodes, we estimated strength centrality, one-step expected influence27 and node predictability28 for the items in the network. Strength centrality is understood as a relative measure of importance of a given node in the network, as it is estimated as the absolute sum of all edge weights that a given node has with other nodes. It is considered the most robust and useful centrality parameter in psychological networks. Expected influence centrality is estimated as the sum of all edge weights and is the best option when one’s network has many negative edge weights,29 since one of our variables had many negative edge weights, we decided to also estimate this measure. Node predictability, also known as R2, is an absolute measure of connectedness, that is how well a given node is explained by other nodes. Node predictability is easily visualized as a pie chart surrounding the node. To compare network structures, we used the network comparison test,25 that uses global strength (sums of edge weights of the two networks) to assess whether the network structures are significantly different.
Network Accuracy and Stability
To check the accuracy of edges, the stability of centrality measures and the statistical difference between pairs of edges and pairs of centrality measures, we performed a bootstrapping procedure, which re-estimates the network model a number of times therefore including all edge weights and centrality estimates. Confidence intervals are estimated around edge weight estimates to investigate whether the estimation is accurate, and whether the difference between two edge weights is significantly different. A centrality-stability coefficient is estimated through subset bootstrapping (a re-estimation procedure where the number of participants involved in the re-estimation gradually decreases) to investigate whether the centrality order is stable These coefficients should ideally be above 0.5, but are also acceptable between 0.25 and 0.5.21 A centrality difference test is also performed to investigate the difference among centrality indices. In this study, we used 2500 bootstraps.
Directed Acyclic Graphs
To investigate the admissible causal relationships among the items in the network, we used Directed Acyclic Graphs (DAG), which are specific network structure that contain only directed edges (from A to B) as well as do not allow the presences of cycles (A to B to C) and loops (A to A). Structure learning algorithms allow for learning the magnitude and direction of the admissible causal effects. In this paper, we used a score-based algorithm, the Hill-Climbing algorithm, which selects the best network model based on goodness-of-fit measure. For further details about the algorithm, see Briganti et al.30
The computed values describing the DAGs are the Bayesian Information Criterion (BIC) and the Directional Probability. The BIC value is a relative measure of a model’s goodness-of-fit that indicates how important an arrow would be in a network if it were removed from it. Negative values correspond to decreases in the network score that would be caused by the arrow’s removal. In other words, the arrows with the lowest BIC value contribute the most to the network structure. Directional probability represents the percentage of bootstrapped networks in which an arrow pointed in a given direction. In accordance with Heeren et al31 and prior psychological research18,32–34 we estimated the DAGs using a Bayesian Hill-Climbing algorithm. For this, we utilized the R package bnlearn.23 As implemented in this package, this method employs a bootstrap function that estimates the structural features of the model by adding edges, removing them, and reversing their direction to optimize the BIC measure. Following Heeren et al,31 we ensured the stability of the resulting DAG. We bootstrapped 10000 samples (and applying 5 different random restarts and 10 perturbations to circumvent local maxima) estimated a network for each of the 10000 samples, and then averaged the 10000 estimated networks to construct the final network structure using a two-step procedure. First, we determined the frequency with which a specific edge appeared in 10,000 bootstrapped networks. The optimal cut-point approach of Scutari and Nagarajan35 was then used to retain edges, resulting in networks with both high sensitivity and specificity. Second, we identified the direction of every surviving edge in the bootstrapped networks. If an edge pointed from node A to node B in at least 51% of the bootstrapped networks, this direction was indicated in the final DAG by an arrow pointing from node A to node B. To ease the interpretation, we followed the reasoning of Heeren et al31 and produced two visualizations of our results: in the first one, the thickness of edges represents the BIC value, in the second one the thickness is relative to the directional probability.
Results
Effect of the First Wave of the COVID-19 Pandemic on the Intensity of Insomnia Symptoms
Table 1 shows the results of the paired t-tests. There was a significant worsening of all measured symptoms during the first lockdown. Most differences were small. Anxiety was the only symptom whose worsening was of medium size (t(5171) = −43.50, p < 0.001, d = −0.61). The changes in Sleep quantity (t(5171) = 4.35, p < 0.001, d = 0.06), DSA (t(5171) = −8.29, p < 0.001, d = −0.12) and Physical fatigue (t(5171) = −9.04, p < 0.001, d = −0.13) were negligible. In terms of percentage change between pre-lockdown and peri-lockdown, ISI total and Anxiety present a change of more than 30%, which indicates a potentially clinically significant increase in these two measures.36
 |
Table 1 Paired t-Test Results for Insomnia Symptoms |
Effect of the First Wave of the COVID-19 Pandemic on the Insomnia Symptoms Network
Figure 1 shows the pre- and peri-lockdown GGMs. For the edge weight see Tables S1 and S2. Most connections are positive in both networks. The most important connections in the pre-lockdown network are between Interference and Noticeability, between Mental fatigue and Physical fatigue, between Anxiety and Depression and between Dissatisfaction and Sleep quantity. The latter is the most important negative connection of the network. In the peri-lockdown network, these connections are also strong. Strong connections can also be seen between Anxiety and Mental fatigue and between Dissatisfaction and DMS. In both networks, the edge between Interference and Noticeability is the strongest edge.
 |
Figure 1 Regularized GGMs of insomnia symptoms. Notes: Each node represents a variable. Weight of edges (connection between nodes) is represented by the thickness and the color saturation of the edges. Positive connections are green and negative connections red. The pie chart surrounding each node represents node predictability. (A) Pre-lockdown network. (B) Peri-lockdown network. |
Network Interference
Mean node predictability for the pre-lockdown network is 0.45. The most predictable nodes are the diurnal symptoms of the ISI: Interference (0.68), Noticeability (0.62), Worry (0.62) and Dissatisfaction (0.56). Mean node predictability for the peri-lockdown network is 0.46. Again, the most predictable nodes are the diurnal symptoms of the ISI: Interference (0.67), Dissatisfaction (0.64), Worry (0.63) and Noticeability (0.59). Centrality for both networks can be seen in Figure 2. Interference is, in both networks, the most central node according to Strength centrality values. See Figures S1 and S2 for the strength centrality difference tests.
 |
Figure 2 Centrality measures. Notes: Peri, peri-lockdown; Pre, pre-lockdown. |
Network Stability
For non-parametric and case-drop bootstrapping results, see Figure S3–S6. The correlation stability coefficient for the two types of centrality measures in both GGMs is 0.75.
Network Comparison Test
The network comparison test showed that the two networks differed regarding network structure (M = 0.13, p < 0.001), but not regarding global strength (S = 0.13, p = 0.39) and that, with Bonferroni correction, 6 edges differ regarding strength. These edges and their edge weights are reported in Table 2.
 |
Table 2 Statistically Differing Edges Between Pre- and Peri-Lockdown GGMs |
Effect of the Second Wave of the COVID-19 Pandemic on the Intensity of Insomnia Symptoms
Table 3 shows the results of the paired t-tests. There was a significant worsening of all measured symptoms during the second lockdown. Among the 14 comparisons performed, nine differences were medium while five differences were small. Total ISI (t(2102) = ‑33.31, p < 0.001, d = 0.73), Mental fatigue (t(2102) = −32, p <0.001, d = −0.70) and Anxiety (t(2102) = −31.29, p < 0.001, d = 0.68) were the three strongest differences. In terms of percentage change between pre-lockdown and peri-lockdown, the measures of total ISI, DMS, EMA, Interference, Worry, Mental fatigue, Anxiety and Depression present a change of more than 30%, which suggests a clinically significant increase of these measures.36
 |
Table 3 Paired t-Test Results for Insomnia Symptoms |
Effect of the Second Wave of the COVID-19 Pandemic on the Insomnia Symptoms Network
Figure 3 shows the pre- and peri-lockdown GGMs. For the edge weight see Tables S3 and S4. Most connections are positive in both networks. The most important connections in the pre-lockdown network are between Interference and Noticeability, between Mental fatigue and Physical fatigue, between Anxiety and Depression, between DMS and EMA and between Dissatisfaction and Sleep quantity. The latter is the most important negative connection of the network. In the peri-lockdown network, these connections are also strong. Strong connections can also be seen between Anxiety and Mental fatigue, between Dissatisfaction and DMS, between Dissatisfaction and Worry and between Worry and Noticeability. The edge between Interference and Noticeability is the strongest edge in the pre-lockdown network. In the peri-lockdown network, the edge between Interference and Noticeability and the edge between Anxiety and Depression are the strongest edges.
 |
Figure 3 Regularized GGMs of insomnia symptoms. Notes: Each node represents a variable. Weight of edges (connection between nodes) is represented by the thickness and the color saturation of the edges. Positive connections are green and negative connections red. The pie chart surrounding each node represents node predictability. (A) Pre-lockdown network. (B) Peri-lockdown network. |
Network Interference
Mean node predictability for the pre-lockdown network is 0.49. The most predictable nodes are the diurnal symptoms of the ISI: Interference (0.70), Noticeability (0.67), Worry (0.63) and Dissatisfaction (0.56). Mean node predictability for the peri-lockdown network is 0.52. Again, the most predictable nodes are the diurnal symptoms of the ISI: Interference (0.72), Worry (0.67), Dissatisfaction (0.67) and Noticeability (0.66). Centrality indices for the pre- and peri-lockdown network can be seen in Figure 4. In both the pre- and peri lockdown network, Interference and Worry are the most central nodes according to Strength centrality values. See Figures S7 and S8 for Strength centrality difference tests.
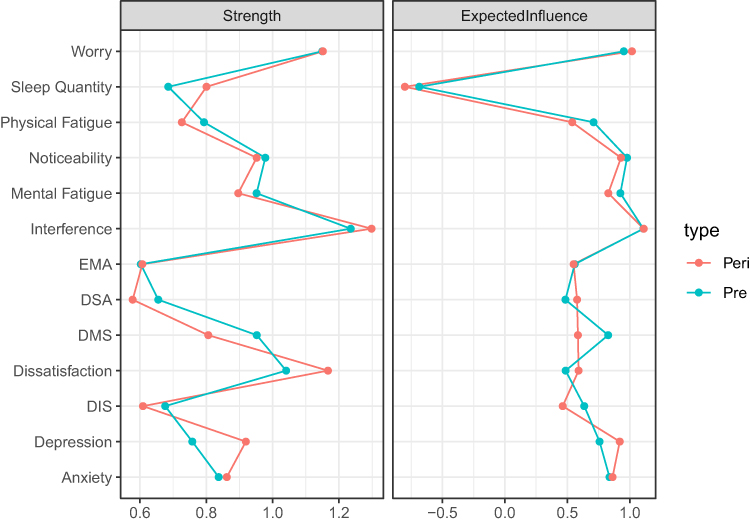 |
Figure 4 Centrality measures. Notes: Peri, peri-lockdown; Pre, pre-lockdown. |
Network Stability
For non-parametric and case-drop bootstrapping results, see Figures S9–S12. The correlation stability coefficient for the two types of centrality measures in both GGMs is 0.75.
Network Comparison Test
The network comparison test showed that the two networks differed regarding network structure (M = 0.16, p < 0.001), but not regarding global strength (S = 0.03, p = 0.67) and that, with Bonferroni correction, 5 edges differ regarding strength. These edges are reported in Table 4.
 |
Table 4 Statistically Differing Edges Between Pre- and Peri-Lockdown GGMs |
Role of Nightmares and COVID- and Lockdown-Related Stress and Depression
Figure 5 represents the DAG. The strength, BIC value, and directional probability for each arrow can be found in Table S5. For the item questions related to the variable names, see Table S2.
 |
Figure 5 Directed acyclic graphs (DAGs). Notes: (A) The thickness of an arrow indicates its importance to the overall network model fit (BIC value). Greater thickness indicates a greater contribution to model fit (non-significant arcs are plotted as dashed lines). (B) The thickness of an arrow indicates the likelihood of a given direction. Greater thickness corresponds to higher proportions of bootstrapped networks with the arrow pointing in that direction. |
Bayesian Information Criterion
In Figure 5 (Panel A), arrow thickness represents the change in the Bayesian Information Criterion (BIC; a relative measure of a model’s goodness-of-fit). The most important arrows in the network connect Interference to Worry, Lockdown-related stress/anxiety to Lockdown-related depression, Interference to Noticeability and Worry to Dissatisfaction.
Directional Probability
Globally, most of our arrows are directed in a determined direction and this is manifested by a majority of thick arrows (Panel B). Indeed, the average directional probability of all our edges is equal to 0.75 (with a standard deviation of 0.13). Because DAGs reflect the conditional independence connections and represent the joint probability distribution of each node, the structure of a node within a DAG can be viewed as a consequence of each node’s conditional distribution knowing its parent nodes in the estimated model.18,28 Therefore, from a descriptive perspective, the following phenomena are observed within this DAG: first, it appears that Interference is the parent node of the probabilistic model. This indicates that patients with Interference are statistically more likely to experience symptoms associated with Interference namely DSA, Noticeability, Sleep quantity, Physical fatigue, EMA, DIS, Mental fatigue, Lockdown depression, Dissatisfaction and Worry. Put differently, participants who report Depressive symptoms during lockdown (“child node”) are more likely to report Interference (“parent node”) than vice versa. The directional probabilities of these connections are all elevated except with Lockdown depression, Dissatisfaction and Worry. The directions of these three edges are therefore potentially reversible. Indeed, concerning for example Lockdown depression, such a value indicates that among the 10.000 bootstrapped networks, 5400 went from Interference to Lockdown depression, but it also means that 4600 went from Lockdown depression to Interference.
Secondly, we observe that Nightmares appear as a node at the end of the cascade, which means that this symptom is conditionally dependent on the presence of the others to which it is connected. On the other hand, Nightmares themselves do not spread through the network. Thus, Nightmares are represented as the outcome of the conditional dependence of the other nodes to which Nightmares is connected, namely Worry, Mental fatigue, Lockdown stress, Lockdown depression, DIS, DSA and COVID stress. Note that these directional probabilities are the highest of all edges in our network.
Third, Lockdown stress points to Nightmare, Lockdown depression, COVID stress and Mental fatigue. Furthermore, Lockdown stress is conditionally dependent on Worry, but their directional probability is 0.53 (indicating that the direction can go in both directions). Lockdown depression points to Nightmare, but also to DSA, Noticeability and Mental fatigue. Moreover, Lockdown depression is also dependent on Lockdown stress but also on Interference. On the other hand, since the directional probability is low, this connection may be bi-directional. Finally, COVID stress points to Nightmare but also to Mental fatigue and Physical fatigue. Also, COVID stress is itself dependent on DMS and Lockdown stress. Since the directional probabilities are near to 0.50 for Physical fatigue and DMS, these connections are probably bi-directional.
Discussion
The aim of our study was to investigate the network structure of insomnia symptoms in the general population during the first and second Belgian wave of COVID-19 and to look at the role of covid- and lockdown-related stress/anxiety, lockdown-related depressive feelings and nightmares in this network.
Effect of the COVID-19 Pandemic on the Insomnia Symptoms Network
All our GGMs were stable and most connections in the GGMs were positive. The global strength of the pre- and peri-lockdown networks was similar. This indicates that insomnia symptoms did not influence each other more during than before the pandemic.21 Our results also indicate that the network structures were slightly different. Three edges differed between pre-lockdown and the (first and second) lockdown: DIS - DMS, Interference - Noticeability and Sleep quantity - DSA. The edge weights of these edges became smaller during both lockdowns. We can thus conclude that the first and second lockdown had little impact on the network of insomnia symptoms even if there was a clear rise in the prevalence of insomnia3 and a worsening of its symptoms during that time.
Our network of ISI-items differed from the networks from Bai et al13 and Dekker et al.14 For example, we did not find that the diurnal and nocturnal ISI-items were connected though the variable Dissatisfaction. This could be explained by us having more than just ISI-items in our network. Most notably, we see that the variable Sleep quantity is strongly connected to the ISI-items.
Role of Nightmares and COVID- and Lockdown-Related Stress and Depression
Lockdown-related stress/anxiety and Lockdown-related depression each play an important and different role in the dynamics of our network’s insomnia symptoms. Concerning Lockdown-related stress/anxiety, we find COVID-related stress/anxiety and Lockdown-related depression both conditionally dependent on it. This could be interpreted as stress due to societal and social restrictions, curfew, or being alone at home being more likely to exacerbate COVID-related stress/anxiety than vice versa. Similar results were observed by Han et al37 showing that negative lockdown experiences strengthen the COVID-19 pandemic’s impact on anxiety and stress. Lockdown-related stress/anxiety also unsurprisingly contributes to an increase in Lockdown-related depressive feelings. While Lockdown-related depression exacerbates other symptoms such as DSA, Noticeability and DIS. Finally, both Lockdown-related stress/anxiety and Lockdown-related depression exacerbate Nightmares and Mental fatigue.
COVID-19-related stress/anxiety exacerbates the presence of Nightmares and Mental fatigue. Thus, stress maintained by the surroundings, environment and the professional sector seems to lead to mental and to nightmares. We do not yet know the function of dreams, but a popular theory is that the dream experience represents a simulation of reality, providing the opportunity to create a scenario with emotional mastery elements to deal with nightmare-related dysphoria.38
Nightmares are represented as conditionally dependent on a series of symptoms (mentioned above), including COVID-related stress/anxiety, Lockdown-related stress/anxiety and Lockdown-related depressive feelings, but they do not propagate through the network. They are also exacerbated by the prevalence of typical insomnia complaints, such as DIS, worrying about sleep and Mental fatigue and by DSA. This indicates that the occurrence of reported nightmares is contingent upon the presence of one or more of these reported symptoms. In addition, the connections pointing to nightmares are among the strongest connections in our DAG. This indicates that nightmares are unlikely to spread through our network via other symptoms. According to our research, nightmares should be interpreted as the consequence of a symptom dynamic, as opposed to the other way around. A similar result was found in a DAG of PTSD-symptoms using longitudinal data during the 2020 lockdowns16 and in DAGs of PTSD-symptoms using cross-sectional data in veterans17 and victims of childhood sexual abuse.18 Thus, from a therapeutic standpoint, this could potentially mean that by targeting symptoms that are higher up in the DAG, the nightmares, which are at the bottom, should diminish. However, in the case of PTSD, sleep difficulties and nightmares tend to remain after therapy for PTSD.39–41
Two Distinct Network Approaches Leading to Convergent Results
Despite their differences, the GGMs and DAGs in our study and in the study of Heeren et al31 have led to convergent results. Firstly, both network approaches pointed to Interference as a node with a particularly influential role in the network system. In GGMs, Interference has the highest strength index of all the symptoms investigated. This effect appears as many connections emanating from this symptom. In DAGs, Interference is not only the parent node (which makes it the symptom from which all those connected to it are conditionally dependent) but also the symptom propagating the most connections through the network, which is consistent with the concept of the high strength indices highlighted in GGMs. In this context, this interference complaint could be a therapeutic target, as it exacerbates a large number of symptoms, including Noticeability (for which the network connection is the most robust). Note that Noticeability is also conditionally dependent on Worrying about sleep, which itself depends on Interference. These findings parallel those of Windal MPsy et al (unpublished data, 2023), who emphasize a strong triangular relationship between these three variables.
Secondly, both methods revealed that the most robust connection was between Interference and Noticeability. This means that the estimation of how much sleep problems interfere with daily functioning and how noticeable these problems are by others are heavily linked in patients’ minds. Looking at our DAG, we see that the level of interference with daily functioning causes patients to think their sleep problems are noticeable.
The third convergent result is that both networks analysis jointly revealed that diurnal symptoms of insomnia had a major role in the network. These diurnal symptoms were the most central and predictive nodes of our GGMs, which means they are an important connection with the rest of the network. According to our DAGs, the diurnal symptoms of the ISI tend to have a causal role, while the nocturnal symptoms tend to be a consequence of each other or of the diurnal symptoms. It is an interesting contrast with the common belief of insomnia patients that sleep difficulties cause diurnal symptoms. For example, a patient would probably say that they are dissatisfied with their sleep because they do not sleep enough. Yet we see in our DAGs that it is the level of dissatisfaction with their sleep that directly impacts people’s estimation of whether they sleep enough. Dissatisfaction with sleep is caused by worrying about sleep and by the estimation of how much sleep difficulties interfere with daily functioning. Moreover, DSA (as a proxy for sleepiness) was in the GGMs but barely linked to the nocturnal insomnia symptoms. In the DAG, there was even no arrow between DSA and nocturnal insomnia symptoms. This is in line with a study from Espie et al42 where on all the variables they measured, insomnia had the least impact on DSA. These findings support the crucial need for the cognitive component of cognitive behavioral therapy for insomnia (CBT-I) during which can be worked on patient’s beliefs and worries43 and that insomnia is not a problem of sleeping too little but rather of underestimating one’s sleep quantity.44,45
Strengths and Limitations
Our study is characterized by a fairly large response rate considering the country’s population. Additionally, insomnia symptomatology was measured using a standardized, valid and reliable questionnaire (ISI) which is widely used in clinical practice. As explained in the methods section, we changed the time frame of the questionnaire from 2 weeks to before and during the lockdown. Measuring the variables from the networks was done exclusively through a self-report questionnaire. Since our participants answered the questionnaires twice, once for before the lockdown and once for during the lockdown, we did not have to rely on results from previous studies to compare both situations. However, this also means that there might be a recall bias and that participants’ view on their pre-lockdown sleep might be influenced by their view on their peri-lockdown sleep. Since we did not ask for participants’ contact information during the first questionnaire, we could not invite them to complete the second questionnaire. Consequently, there might be participants who replied to both questionnaires, but we were unable to match records, consequently ruling out performing temporal analyses over the two questionnaires.
Implications
Our findings contribute to the existing literature, aiming to enhance the comprehension of the intricate dynamics involved in the interplay of insomnia symptoms within the general population during the COVID-19 lockdowns. The consistent stability observed in our results across the two examined periods signifies a certain level of steadiness in the interaction among these symptoms, despite the observed variations in the severity of complaints. This implies that an escalation in the intensity of complaints does not necessarily involve a reconfiguration in the nature of the relationships underlying these complaints. This insight should be considered in the treatment of insomnia, particularly in the context of a health emergency, by placing greater emphasis on addressing the interference complaint and comprehending the inherent relationships among these symptoms, given their stability across time.
Suggestions for Further Research
Future research could now delve into examining the potential structural modification of the insomnia network structure. Indeed, the World Health Organization recently declared that COVID-19 is no longer a global health emergency.46 In this manner, we could ascertain whether the interference complaint persists over time as a primary symptom within this symptomatology, remaining central irrespective of the pandemic context. Moreover, it would be judicious to incorporate the perpetuating factors of insomnia and nightmares as novel variables within the network. This would afford a more comprehensive approach to understanding the mechanisms underpinning these two entities.
Conclusion
The lockdown had little impact on the network structure of insomnia symptoms despite a higher intensity of these symptoms. Lockdown-related stress/anxiety exacerbated indirectly nightmares through covid-related stress/anxiety, lockdown-related depressive feelings and mental fatigue. This anxiety and depressive feelings also had an indirect impact on insomnia symptoms through mental and physical fatigue. Despite their varying assumptions and procedure to determine nodes and edges, both GGMs and DAGs concur that Interference, and more generally the diurnal symptoms of insomnia, play an essential role in the network’s structure. Our two methods confirm the crucial need for incorporating a cognitive component in the treatment of insomnia.
Abbreviations
DIS, difficulties initiating sleep; DMS, difficulties maintaining sleep; DSA, difficulties staying awake; EMA, early morning awakenings.
Data Sharing Statement
The data is available at the Open Science Framework: https://osf.io/tv2dw/.
Ethics Approval Statement
This study is in compliance with the Declaration of Helsinki and was approved by the Comité d’éthique hospitalier (hospital ethical committee) of the Brugmann Hospital (Brussels, Belgium; reference: CE 2023/40). Informed consent was obtained from participants.
Acknowledgments
We are grateful to Prof. McNally and Prof. Heeren for their accurate and useful explanations specifically during the construction of the DAG networks.
Funding
AR (11N8923N) is funded by the Fonds Wetenschappelijk Onderzoek (FWO, Belgium) and MW is funded by the Brugmann Foundation (Belgium).
Disclosure
The authors declare no conflicts of interest in this work.
References
1. American Academy of Sleep Medicine. International Classification of Sleep Disorder.
2. American Psychiatric Association. Sleep-Wake disorders. In: Diagnostic and Statistical Manual of Mental Disorders.
3. Roland A, Colomb C, Noël S, et al. Prevalence of insomnia and sleep habits during the first and second wave of COVID-19 in Belgium. Psychol Belg. 2023;63(1):18–29. doi:10.5334/pb.1160
4. Alimoradi Z, Broström A, Tsang HWH, et al. Sleep problems during COVID-19 pandemic and its’ association to psychological distress: a systematic review and meta-analysis. E Clin Med. 2021;36:100916. doi:10.1016/j.eclinm.2021.100916
5. Goncalves M, Henriques A, Costa AR, et al. Insomnia and nightmare profiles during the COVID-19 pandemic in Portugal: characterization and associated factors. Sleep Med. 2022;90:44–52. doi:10.1016/j.sleep.2021.12.018
6. Scarpelli S, Alfonsi V, Mangiaruga A, et al. Pandemic nightmares: effects on dream activity of the COVID‐19 lockdown in Italy. J Sleep Res. 2021;30(5). doi:10.1111/jsr.13300
7. Scarpelli S, Alfonsi V, Gorgoni M, et al. Dreams and nightmares during the first and second wave of the COVID-19 infection: a longitudinal study. Brain Sci. 2021;11(11):1375. doi:10.3390/brainsci11111375
8. Kennedy KER, Bastien CH, Ruby PM, Killgore WDS, Wills CCA, Grandner MA. Nightmare content during the COVID‐19 pandemic: influence of COVID‐related stress and sleep disruption in the United States. J Sleep Res. 2022;31(1):56. doi:10.1111/jsr.13439
9. Schwartz S. Are life episodes replayed during dreaming? Trends Cogn Sci. 2003;7(8):325–327. doi:10.1016/S1364-6613(03)00162-1
10. Borsboom D, Cramer AOJ. Network analysis: an integrative approach to the structure of psychopathology. Annu Rev Clin Psychol. 2013;9(1):91–121. doi:10.1146/annurev-clinpsy-050212-185608
11. Beard C, Millner AJ, Forgeard MJC, et al. Network analysis of depression and anxiety symptom relationships in a psychiatric sample. Psychol Med. 2016;46(16):3359–3369. doi:10.1017/S0033291716002300
12. Cramer AOJ, Waldorp LJ, van der Maas HLJ, Borsboom D. Complex realities require complex theories: refining and extending the network approach to mental disorders. Behav Brain Sci. 2010;33(2–3):178–193. doi:10.1017/S0140525X10000920
13. Bai W, Zhao Y, An F, et al. Network analysis of insomnia in Chinese mental health professionals during the COVID-19 pandemic: a cross-sectional study. Nat Sci Sleep. 2021;13:1921–1930. doi:10.2147/NSS.S326880
14. Dekker K, Blanken T, Van Someren E. Insomnia and personality—a network approach. Brain Sci. 2017;7(12):28. doi:10.3390/brainsci7030028
15. Hu F, Li L, Huang X, Yan X, Huang P. Symptom distribution regularity of insomnia: network and spectral clustering analysis. JMIR Med Inform. 2020;8(4):e16749. doi:10.2196/16749
16. Chen S, Bi K, Lyu S, Sun P, Bonanno GA. Depression and PTSD in the aftermath of strict COVID-19 lockdowns: a cross-sectional and longitudinal network analysis. Eur J Psychotraumatol. 2022;13(2). doi:10.1080/20008066.2022.2115635
17. Lazarov A, Suarez-Jimenez B, Levi O, et al. Symptom structure of PTSD and co-morbid depressive symptoms – a network analysis of combat veteran patients. Psychol Med. 2020;50(13):2154–2170. doi:10.1017/S0033291719002034
18. McNally RJ, Heeren A, Robinaugh DJ. A bayesian network analysis of posttraumatic stress disorder symptoms in adults reporting childhood sexual abuse. Eur J Psychotraumatol. 2017;8(sup3). doi:10.1080/20008198.2017.1341276
19. Bastien C. Validation of the insomnia severity index as an outcome measure for insomnia research. Sleep Med. 2001;2(4):297–307. doi:10.1016/S1389-9457(00)00065-4
20. Morin CM. Insomnia: Psychological Assessment and Management. Guilford Press; 1993.
21. Epskamp S, Borsboom D, Fried EI. Estimating psychological networks and their accuracy: a tutorial paper. Behav Res Methods. 2018;50(1):195–212. doi:10.3758/s13428-017-0862-1
22. Epskamp S, Cramer AOJ, Waldorp LJ, Schmittmann VD, Borsboom D. qgraph: network visualizations of relationships in psychometric data. J Stat Softw. 2012;48(4). doi:10.18637/jss.v048.i04
23. Scutari M. Learning bayesian networks with the bnlearn r package. J Stat Softw. 2010;35(3). doi:10.18637/jss.v035.i03
24. Gentry J, Gentleman R, Huber W. How to plot a graph using rgraphviz; 2012. Available from: http://bioconductor.statistik.tu-dortmund.de/packages/2.10/bioc/vignettes/Rgraphviz/inst/doc/Rgraphviz.pdf.
25. van Borkulo C, Epskamp S, Jones P, Haslbeck J, Millner A. NetworkComparisontest: statistical comparison of two networks based on three invariance measures; 2019. Available from: https://CRAN.R-project.org/package=NetworkComparisonTest.
26. Fruchterman TMJ, Reingold EM. Graph drawing by force-directed placement. Softw Pract Exp. 1991;21(11):1129–1164. doi:10.1002/spe.4380211102
27. Boccaletti S, Latora V, Moreno Y, Chavez M, Hwang D. Complex networks: structure and dynamics. Phys Rep. 2006;424(4–5):175–308. doi:10.1016/j.physrep.2005.10.009
28. Haslbeck JMB, Waldorp LJ. How well do network models predict observations? On the importance of predictability in network models. Behav Res Methods. 2018;50(2):853–861. doi:10.3758/s13428-017-0910-x
29. McNally RJ. Network analysis of psychopathology: controversies and challenges. Annu Rev Clin Psychol. 2021;17(1):31–53. doi:10.1146/annurev-clinpsy-081219-092850
30. Briganti G, Scutari M, McNally RJ. A tutorial on bayesian networks for psychopathology researchers. PsyArXiv. 2021. doi:10.31234/osf.io/h4vxa
31. Heeren A, Hanseeuw B, Cougnon LA, Lits G. Excessive worrying as a central feature of anxiety during the first covid-19 lockdown-phase in Belgium: insights from a network approach. Psychol Belg. 2021;61(1):401. doi:10.5334/pb.1069
32. Bernstein EE, Heeren A, McNally RJ. Unpacking rumination and executive control: a network perspective. Clin Psychol Sci. 2017;5(5):816–826. doi:10.1177/2167702617702717
33. Blanchard MA, Roskam I, Mikolajczak M, Heeren A. A network approach to parental burnout. Child Abuse Negl. 2021;111:104826. doi:10.1016/j.chiabu.2020.104826
34. Heeren A. On the distinction between fear and anxiety in a (post)pandemic world: a commentary on schimmenti et al. Clin Neuropsychiatry. 2020;17(3):189–191. doi:10.36131/cnfioritieditore20200307
35. Scutari M, Nagarajan R. Identifying significant edges in graphical models of molecular networks. Artif Intell Med. 2013;57(3):207–217. doi:10.1016/j.artmed.2012.12.006
36. Farrar JT, Young JP, LaMoreaux L, Werth JL, Poole MR. Clinical importance of changes in chronic pain intensity measured on an 11-point numerical pain rating scale. Pain. 2001;94(2):149–158. doi:10.1016/S0304-3959(01)00349-9
37. Han L, Zhan Y, Li W, Xu Y, Xu Y, Zhao J. Associations between the perceived severity of the covid-19 pandemic, cyberchondria, depression, anxiety, stress, and lockdown experience: cross-sectional survey study. JMIR Public Health Surveil. 2021;7(9):e31052. doi:10.2196/31052
38. Scarpelli S, Bartolacci C. the functional role of dreaming in emotional processes. Front Psychol. 2019;10. doi:10.3389/fpsyg.2019.00459
39. Belleville G, Guay S, Marchand A. Persistence of sleep disturbances following cognitive-behavior therapy for posttraumatic stress disorder. J Psychosom Res. 2011;70(4):318–327. doi:10.1016/j.jpsychores.2010.09.022
40. Larsen SE, Fleming CJE, Resick PA. Residual symptoms following empirically supported treatment for PTSD. Psychol Trauma. 2019;11(2):207–215. doi:10.1037/tra0000384
41. Scurfield RM, Kenderdine SK, Pollard RJ. Inpatient treatment for war-related post-traumatic stress disorder: initial findings on a longer-term outcome study. J Trauma Stress. 1990;3(2):185–201. doi:10.1002/jts.2490030203
42. Espie CA, Kyle SD, Hames P, Cyhlarova E, Benzeval M. The daytime impact of dsm-5 insomnia disorder. J Clin Psychiatry. 2012;73(12):e1478–e1484. doi:10.4088/JCP.12m07954
43. Thakral M, Von Korff M, McCurry SM, Morin CM, Vitiello MV. Changes in dysfunctional beliefs about sleep after cognitive behavioral therapy for insomnia: a systematic literature review and meta-analysis. Sleep Med Rev. 2020;49:101230. doi:10.1016/j.smrv.2019.101230
44. Bianchi MT, Williams KL, Mckinney S, Ellenbogen JM. The subjective-objective mismatch in sleep perception among those with insomnia and sleep apnea. J Sleep Res. 2013;22(5):557–568. doi:10.1111/jsr.12046
45. Fernandez-Mendoza J, Calhoun SL, Bixler EO, et al. Sleep misperception and chronic insomnia in the general population: role of objective sleep duration and psychological profiles. Psychosom Med. 2011;73(1):88–97. doi:10.1097/PSY.0b013e3181fe365a
46. WHO. Nouveau coronavirus (2019-nCoV); 2023. Available from: https://www.who.int/fr/emergencies/diseases/novel-coronavirus-2019.
 © 2023 The Author(s). This work is published and licensed by Dove Medical Press Limited. The full terms of this license are available at https://www.dovepress.com/terms.php and incorporate the Creative Commons Attribution - Non Commercial (unported, v3.0) License.
By accessing the work you hereby accept the Terms. Non-commercial uses of the work are permitted without any further permission from Dove Medical Press Limited, provided the work is properly attributed. For permission for commercial use of this work, please see paragraphs 4.2 and 5 of our Terms.
© 2023 The Author(s). This work is published and licensed by Dove Medical Press Limited. The full terms of this license are available at https://www.dovepress.com/terms.php and incorporate the Creative Commons Attribution - Non Commercial (unported, v3.0) License.
By accessing the work you hereby accept the Terms. Non-commercial uses of the work are permitted without any further permission from Dove Medical Press Limited, provided the work is properly attributed. For permission for commercial use of this work, please see paragraphs 4.2 and 5 of our Terms.