")
Back to Journals » Nature and Science of Sleep » Volume 16
Evaluate the Relationship Between Obstructive Sleep Apnea and Metabolic Syndrome in Real-World Data
Authors Tang R, Li C, Di D, Zhou L, Qian Y, Qiang C, Ma C, Zhou R, Wang B, Wang M
Received 20 September 2023
Accepted for publication 22 February 2024
Published 28 February 2024 Volume 2024:16 Pages 217—231
DOI https://doi.org/10.2147/NSS.S433514
Checked for plagiarism Yes
Review by Single anonymous peer review
Peer reviewer comments 2
Editor who approved publication: Dr Valentina Alfonsi
Renzhe Tang,1,* Chong Li,2,* Dongmei Di,1 Lin Zhou,2 Yongxiang Qian,1 Chaohua Qiang,3 Chao Ma,1 Rui Zhou,1 Bin Wang,1 Min Wang1
1Department of Cardiothoracic Surgery, The Third Affiliated Hospital of Soochow University, Changzhou, Jiangsu Province, 213003, People’s Republic of China; 2Department of Respiratory Medicine, The Third Affiliated Hospital of Soochow University, Changzhou, Jiangsu Province, 213003, People’s Republic of China; 3Department of Echocardiography, The Third Affiliated Hospital of Soochow University, Changzhou, Jiangsu Province, 213003, People’s Republic of China
*These authors contributed equally to this work
Correspondence: Min Wang; Bin Wang, Department of Cardiothoracic Surgery, The Third Affiliated Hospital of Soochow University, No. 185 of Juqian Street, Changzhou, Jiangsu Province, 213003, People’s Republic of China, Email [email protected]; [email protected]
Objective: Obstructive sleep apnea (OSA) is a disorder characterized by disruption in breathing and hypoventilation. In parallel, metabolic syndrome (MetS) mainly co-occur with OSA, however, their association has not been fully elucidated. Therefore, this study aimed to reveal the relationship between OSA and MetS using data from the National Health And Nutrition Examination Survey (NHANES) database and pooled data from Genome-Wide Association Studies (GWAS).
Material and Methods: Data from the National Health and Nutrition Examination Survey and pooled data from genome-wide association analysis (GWAS) were used univariate and multivariate logistic regression analyses were carried out to evaluate the correlation between OSA and MetS, and multivariate logistic regression models were utilized for adjusting for potential confounders. Two-sample Mendelian randomization (MR) was used to assess the causal relationship between OSA and MetS. The variance-weighted inverse method was employed as the main method of analysis.
Results: A positive relationship of OSA with Mets was evidenced by multivariate logistic regression analysis, and OSA was associated with higher incidence rates of all-cause and cardiovascular mortality. OSA is strongly associated with abdominal obesity, hypertension, hyperglycemia, high triglycerides, and low HDL. Furthermore, except for hypertriglyceridemia, MR analysis indicated that genetically driven OSA was causally associated with a higher risk of MetS.
Conclusion: The positive relationship of OSA with Mets was revealed, and higher incidence rates of all-cause mortality and cardiovascular mortality were noted to be correlated with OSA. MR analysis further confirmed the causal relationship of OSA with MetS and cardiovascular disease.
Keywords: obstructive sleep apnea, metabolic syndrome, cardiovascular disease, NHANES, Mendelian randomization
Introduction
At present, disruption in breathing and hypoventilation are recognized as the frequent features of obstructive sleep apnea (OSA). It results in the decreased oxygen saturation, increased sleep arousal, and excessive daytime sleepiness due to partial or complete collapse of the upper airway during sleep despite continuous breathing.1,2 Epidemiological studies reported that OSA accounted for 14% of the world’s population, and its incidence increased in cases who aged 30–69 years old.3 Common symptoms of OSA include daytime sleepiness, fatigue, poor concentration, memory loss or headaches, all of which may negatively affect patients’ quality of life and expectations.4
As a complex metabolic disorder, metabolic syndrome (MetS) can be featured by the aggregation of risk factors, thereby elevating the incidence rates of cardiovascular and cerebrovascular diseases. The MetS was primarily described by the World Health Organization in 1998,5 followed by definitions presented by International Diabetes Federation (IDF) and National Cholesterol Education Program Adult Treatment Panel III (NCEP-ATP III).6 Notably, hyperglycemia, central obesity, hypertension, and dyslipidemia were commonly found in the definitions of MetS.7,8 The incidence of MetS in the United States, as defined by the NCEP ATP III, was estimated to be 24% in the National Health And Nutrition Examination Survey (NHANES).9 Research indicates that over half of individuals diagnosed with OSA also present with hypertension.10 While another research showed that OSA was significantly associated with primary and refractory hypertension. The more severe the OSA, the higher the risk of hypertension.11 As a noticeable risk factor for OSA, the accumulation of visceral fat, particularly in obese patients, was emphasized by previous studies. Quantification of the area of intra-abdominal fat in obese patients with and without OSA revealed a remarkably larger area of visceral fat and a greater visceral fat-to-total fat ratio in obese OSA patients versus those in obese non-OSA patients.12 An elevated incidence of sleep disorders was reported in type 2 diabetes mellitus (T2DM) cases, impairing their health, mood, and quality of life. In addition, cases with sleep disorders (eg, OSA) are more prone to metabolic disorders (eg, T2DM).13 The incidence of OSA in cases with obesity or MetS was 50–60%, which remarkably increased after co-occurrence of obesity and diabetes mellitus.14 A significant correlation of HDL with OSA severity was confirmed, and a higher apnea hypoventilation index (AHI) value was correlative with a lower HDL level.15
Numerous studies have concentrated on the close relationship between OSA and Mets. However, their main limitation is that they were limited to specific cohorts and their results might not be representative enough. The NHANES has provided comprehensive data related to all aspects of health and nutrition, and those data have been used worldwide.16,17 Nevertheless, traditional observational studies are susceptible to some types of bias, such as reverse causality and residual confounding.18 Mendelian randomization (MR) is considered as an equivalent method to randomized controlled studies,19 which uses genetic variations as instrumental variables (IVs) to infer an outcome-exposure causal relationship. This method can effectively avoid confounding bias and reverse causality bias in traditional epidemiological studies.20 In addition, MR has the advantage that its estimates of actual causal effects are more significant and accurate than those observed clinically, including meta-analysis of clinical and prospective studies.21
In the present study, it was attempted to derive data from the NHANES database to indicate whether OSA would be associated with MetS. Subsequently, pooled data from Genome-Wide Association Studies (GWAS) were utilized for evaluating the causal influence of OSA on MetS via MR analysis.
Material and Methods
Study Design
The two stages utilized in the present study can be observed in Figure 1. The NHANES was executed by the Centers for Disease Control and Prevention (CDC) of the USA. It employs a nationally representative, recurrent, cross-sectional survey methodology to evaluate the health and nutritional well-being of the noninstitutionalized US civilian population. Employing a multi-stage, stratified, clustered probability sample design, NHANES gathers data through a household interview encompassing demographics, socioeconomic status, health, and disease history. Additionally, a clinical examination is conducted within a Mobile Examination Clinic (MEC) to further enhance the comprehensiveness of the collected information.22 Using the NHANES database, it was attempted to carry out multivariate regression analysis for determining the possible relationship of OSA with Mets in stage 1. In stage 2, it was attempted to assess the causal influence of OSA on Mets through MR analysis of statistical data that could be derived from the GWAS.
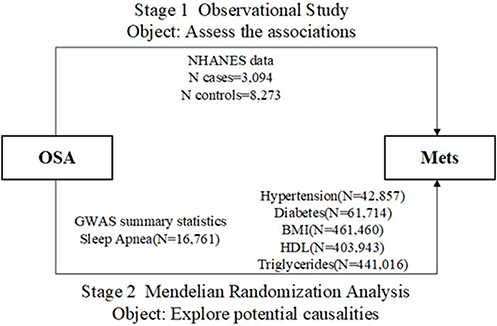 |
Figure 1 A two-stage study design: observational study and Mendelian randomization. |
Data Sources and Population of Observational Study
Data of the NHANES, particularly those recorded from 2005 to 2008, were utilized in the present research. Participants, whose OSA and Mets data were existed, were involved (n=11,367). A flowchart describing participants’ selection is illustrated in Figure 2. Obtaining the written informed consent from all participants was also undertaken.
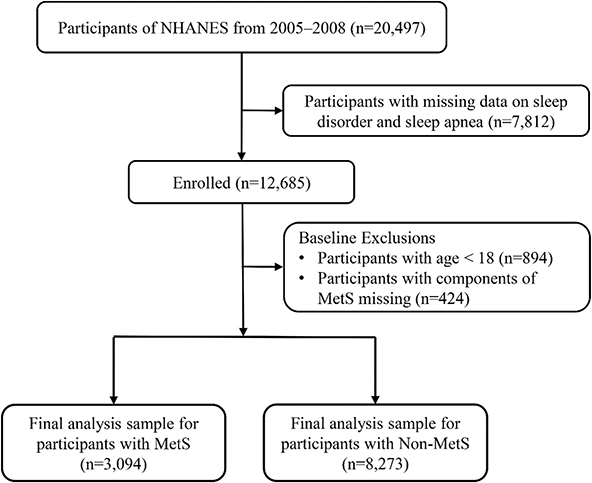 |
Figure 2 The flowchart of participants’ selection from the NHANES (2005–2008). |
Ascertainment of OSA and Mets
Assessment of OSA was carried out by two questions, in which a participant’s positive answer was indicative of his/her sleep disorder, “Have you been diagnosed with a sleep disorder”. Grouping of participants to the following groups was also undertaken on the basis of their answers to the subsequent questions: OSA, restless leg syndrome, insomnia, and other sleep disorders.
Using the International Diabetes Federation (IDF) guideline (2009 revision), the main analysis was carried out and the following criteria should be met: (i) on the basis of the quantification of waist circumference (WC) in a standing position at the umbilical level, WC ≥80 and ≥94 cm in women and men was indicative of abdominal obesity, respectively; (ii) on the basis of the quantification of blood pressure (both upper limbs) via a calibrated digital electronic tensiometer in the sitting position after a quarter of rest, diastolic blood pressure (DBP) or systolic blood pressure (SBP) was ≥85 mmHg or ≥130 (or taking antihypertensive medication), respectively; (iii) triglyceride (TG) level was ≥150 mg/dL (1.7 mmol/L) or statin/fibrate treatment; HDL-cholesterol (HDL-C) level was <50 and <40 mg/dL in women and men (or statin/fibrate treatment), respectively, as measured via an Auto-Analyzer; (iv) on the basis of the quantification of central obesity (WC > 80 and >94 cm in women and men, respectively), fasting glycaemia was ≥100 mg/dL (5.6 mmol/L) (or taking antidiabetic medication). Fasting blood glucose (FBG) level ≥7 mmol/L and/or taking antidiabetic medication would be indicative of diabetes. Cases who met three or all of the above mentioned four criteria were diagnosed with MetS.
Assessment of Covariates in Observational Epidemiological Analysis
Participants’ demographics, physical activity and medical conditions, body mass index (BMI), smoking status, drinking habits, and family poverty-to-income ratio (PIR) were selected on the basis of the clinical relevance and regarded as potential covariates. Through domestic surveys, demographic features and medical conditions were attained. Laboratory and medical examinations were undertaken for collecting BMI and other biochemical parameters. Non-Hispanic black, non-Hispanic white, Mexican-American, and other ethnic groups were involved. The following categories of educational level were taken into account: college or above, high school, and below high school. Married or unmarried statuses were also considered for marital status. Medical conditions were assessed by the question “Did you ever have diabetes/high cholesterol level/high blood pressure/heart failure/coronary heart disease/heart attack?”, and a cardiovascular event was regarded as heart disease. Smoking for more than one hundred cigarettes throughout the life was used a criterion to discriminate smokers. The quantifications of these variables were publicly available at www.cdc.gov/nchs/nhanes/.
All-Cause and Cardiovascular Mortality
Up to December 31, 2019, a passive mortality follow-up was undertaken on all participants who aged over 20 years in the NHANES III. Through probabilistic matching of the National Death Index records, it was attempted to assess mortality status (with date of death) and the cause of death. The underlying cause of death 113 (UCOD_113) code was utilized in the NHANES III-linked mortality file for recoding all deaths that occurred from 1999 to 2019 on the basis of the 10th revision of the International Classification of Diseases (ICD-10) guideline. Retrieving of all-cause mortality and the following cause-specific mortalities was undertaken as cardiovascular disease (CVD) (UCOD_113 55–64, 70).
Cross-Sectional Analysis
Data analysis was carried out via EmpowerStats (http://www.empowerstats.com) and R 3.5.3 software. Expressing continuous variables as mean ± standard deviation (SD) was undertaken, followed by categorical variables as frequency (percentage). The univariate and multivariate logistic regression analyses were utilized to indicate whether OSA would be correlated with MetS. Through multivariate logistic models, it was attempted to adjust potential confounding factors. P < 0.05 indicates statistical significance.
Basic Concept of Two-Sample MR
On the basis of randomly allocation of genetic variants during gamete formation and the lack of correlation with environmental factors, reverse causation and confounding were less likely recognized as bias sources for MR analysis versus traditional observational methods. Therefore, identification of single nucleotide polymorphisms (SNPs) was carried out by MR analysis, and their integration was resulted in figuring out the relationship between OSA and MetS. For validation of causal estimates, the following criteria were designed for genetic variants that were regarded as IVs in MR analysis (Figure 3):1 the necessity of correlation of genetic variants with OSA;2 stability of genetic variants against the influences of confounding factors; and3 the ability of genetic variants to influence MetS only through OSA.
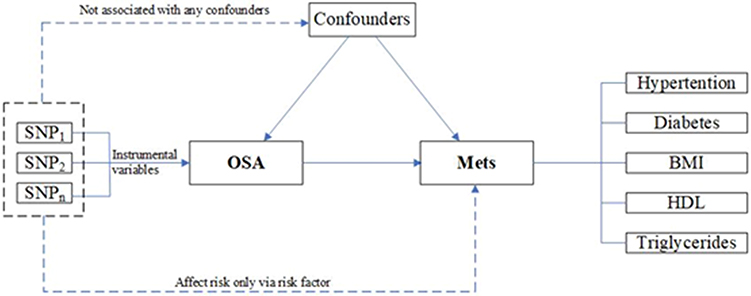 |
Figure 3 Principles of Two-sample Mendelian Randomization. |
Data Sources of MR Analysis
Statistical data (from GWAS) and a two-stage design were utilized in the MR analysis. GWAS data for OSA (16,761 cases and 201,194 controls) were acquired online (https://www.finngen.fi/en). As no GWAS data related to MetS were available, several influential factors of MetS (hypertension, diabetes, BMI, HDL, and TG) were used as outcome indicators for further MR analysis. The data related to hypertension were acquired from a meta-analysis of GWAS (175,935 controls and 42,857 cases). For the outcome dataset, SNPs for diabetes were derived from a meta-analysis of GWAS (61,714 cases and 1178 controls). The data for BMI were acquired from GWAS (461,460 samples). The data for HDL were obtained from GWAS (403,943 samples). The data for TG were acquired from GWAS (441,016 samples). In order to reveal whether OSA would have a causal relationship with CVD, data related to CVD were acquired from GWAS, accounting for 111,108 cases, of whom there were 107,684 controls. Table 1 summarizes demographic profiles involved.
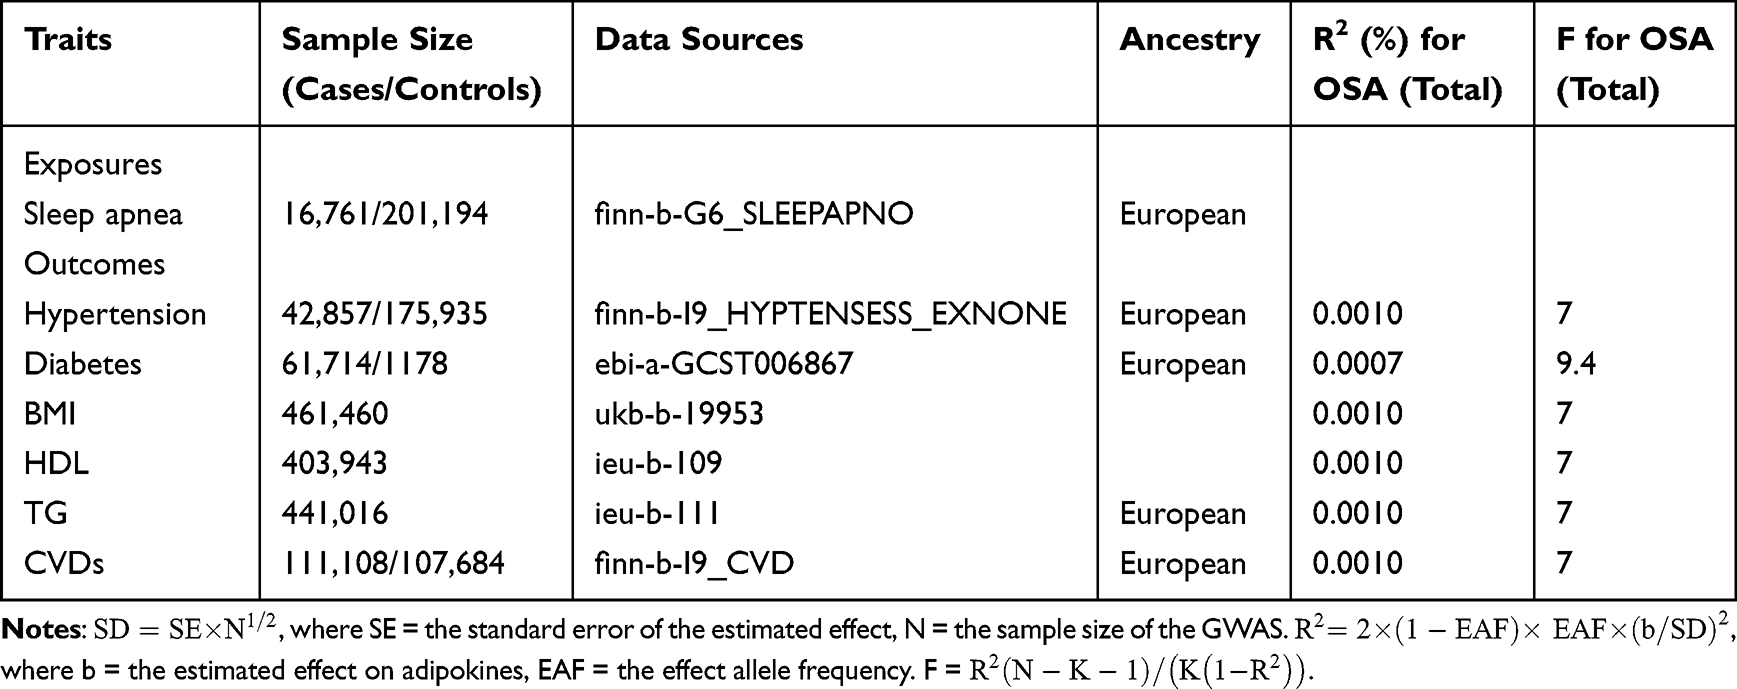 |
Table 1 Evaluation of Instrumental Variables and Data Sources |
Selection of SNPs for MR Analysis
SNPs of linkage disequilibrium (LD) were identified by detecting the corresponding LD, which were carried out independently by cutting SNPs smaller than 10,000 kb (r2< 0.001). Genetic variants closely associated with RA (P < 5×10⁻⁸) were regarded as IVs. Meanwhile, secondary phenotypes were searched for each SNP to exclude potential pleiotropic effects. Specifically, SNPs corresponding to the outcome-related phenotypes were excluded, while other SNPs were kept. After that, variance (R2) and F-statistics were utilized to evaluate the strength of IVs, so that weak-tool bias could be avoided,23 which was formulated as follows: 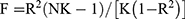 , where N denotes the sample size of the chosen GWAS, K denotes the number of SNPs involved, and R2 denotes the explained variance (cumulative) of the chosen SNPs during exposure. F >10 indicates a strong correlation of exposure with IVs, and the results of MR analysis were independent of weak-tool bias. The SNPs are listed in Supplementary Files 1–6.
MR Analysis
The SNP-OSA and SNP-hypertension statistics were harmonized to guarantee that alleles of SNPs of OSA and MetS were consistent. Besides, different outcomes (diabetes, BMI, HDL, TG, and CVD) were adjusted in a similar way. The inverse-variance weighting (IVW) method was dominantly applied in the MR analysis.24 Meanwhile, MR-PRESSO, MR-RAPS, maximum-likelihood, MR-Egger, and median weighting were employed to clarify the causality.25 Different hypotheses related to the effectiveness of IVs were made using each method. Estimation of weighted median was carried out if half of IVs were invalid. Despite low statistical capability of the MR-Egger method, an estimation was provided after correction of various effects. Specifically, the MR-RAPS was responsible for horizontal multiplicity correction by the adjusted scores, resulting in the reduced deviation due to horizontal multiplicity. The MR-PRESO method could automatically identify and remove outliers (IVW linear regression) to correct the MR estimation.25 These methods were employed to comprehensively investigate causality.
Sensitivity Analysis
Many methods were used for sensitivity analysis in this study. Firstly, the heterogeneity of different SNP estimates was evaluated by the Cochran’s Q test. If P was >0.05, no heterogeneity was indicated. Although the random-effects model could be used, the fixed-effect IVW method was dominant. Secondly, the horizontal pleiotropy of IVs was investigated by the MR-Egger intercept method.26 Estimation of average of the horizontal pleiotropic effect was carried out based on the intercept across SNPs in the MR-Egger test, and the estimated IVW might be biased if P < 0.05. Third, an SNP was verified using the leave-one-out sensitivity test. Fourthly, the presence of pleiotropy was directly examined by generating funnel and forest plots. It was attempted to conduct statistical analysis via “two-sample MR”, “MR-PRESSO”, and “mr.raps” packages in R software.
Results
Characteristics of NHANES
The subjects’ baseline features are listed in Table 2. Among 11,367 subjects, 50.52% and 49.48% were men and women, respectively, with a weighted mean age of 45.95 years old. Besides, 3094 subjects suffered from MetS. Compared with non-MetS subjects, MetS subjects’ age was significantly older, smokers’ dominancy was confirmed, accompanying by higher incidence rates of hypertension, hyperglycemia, hypertriglyceridemia, and low HDL, and significant difference could be identified (P< 0.001).
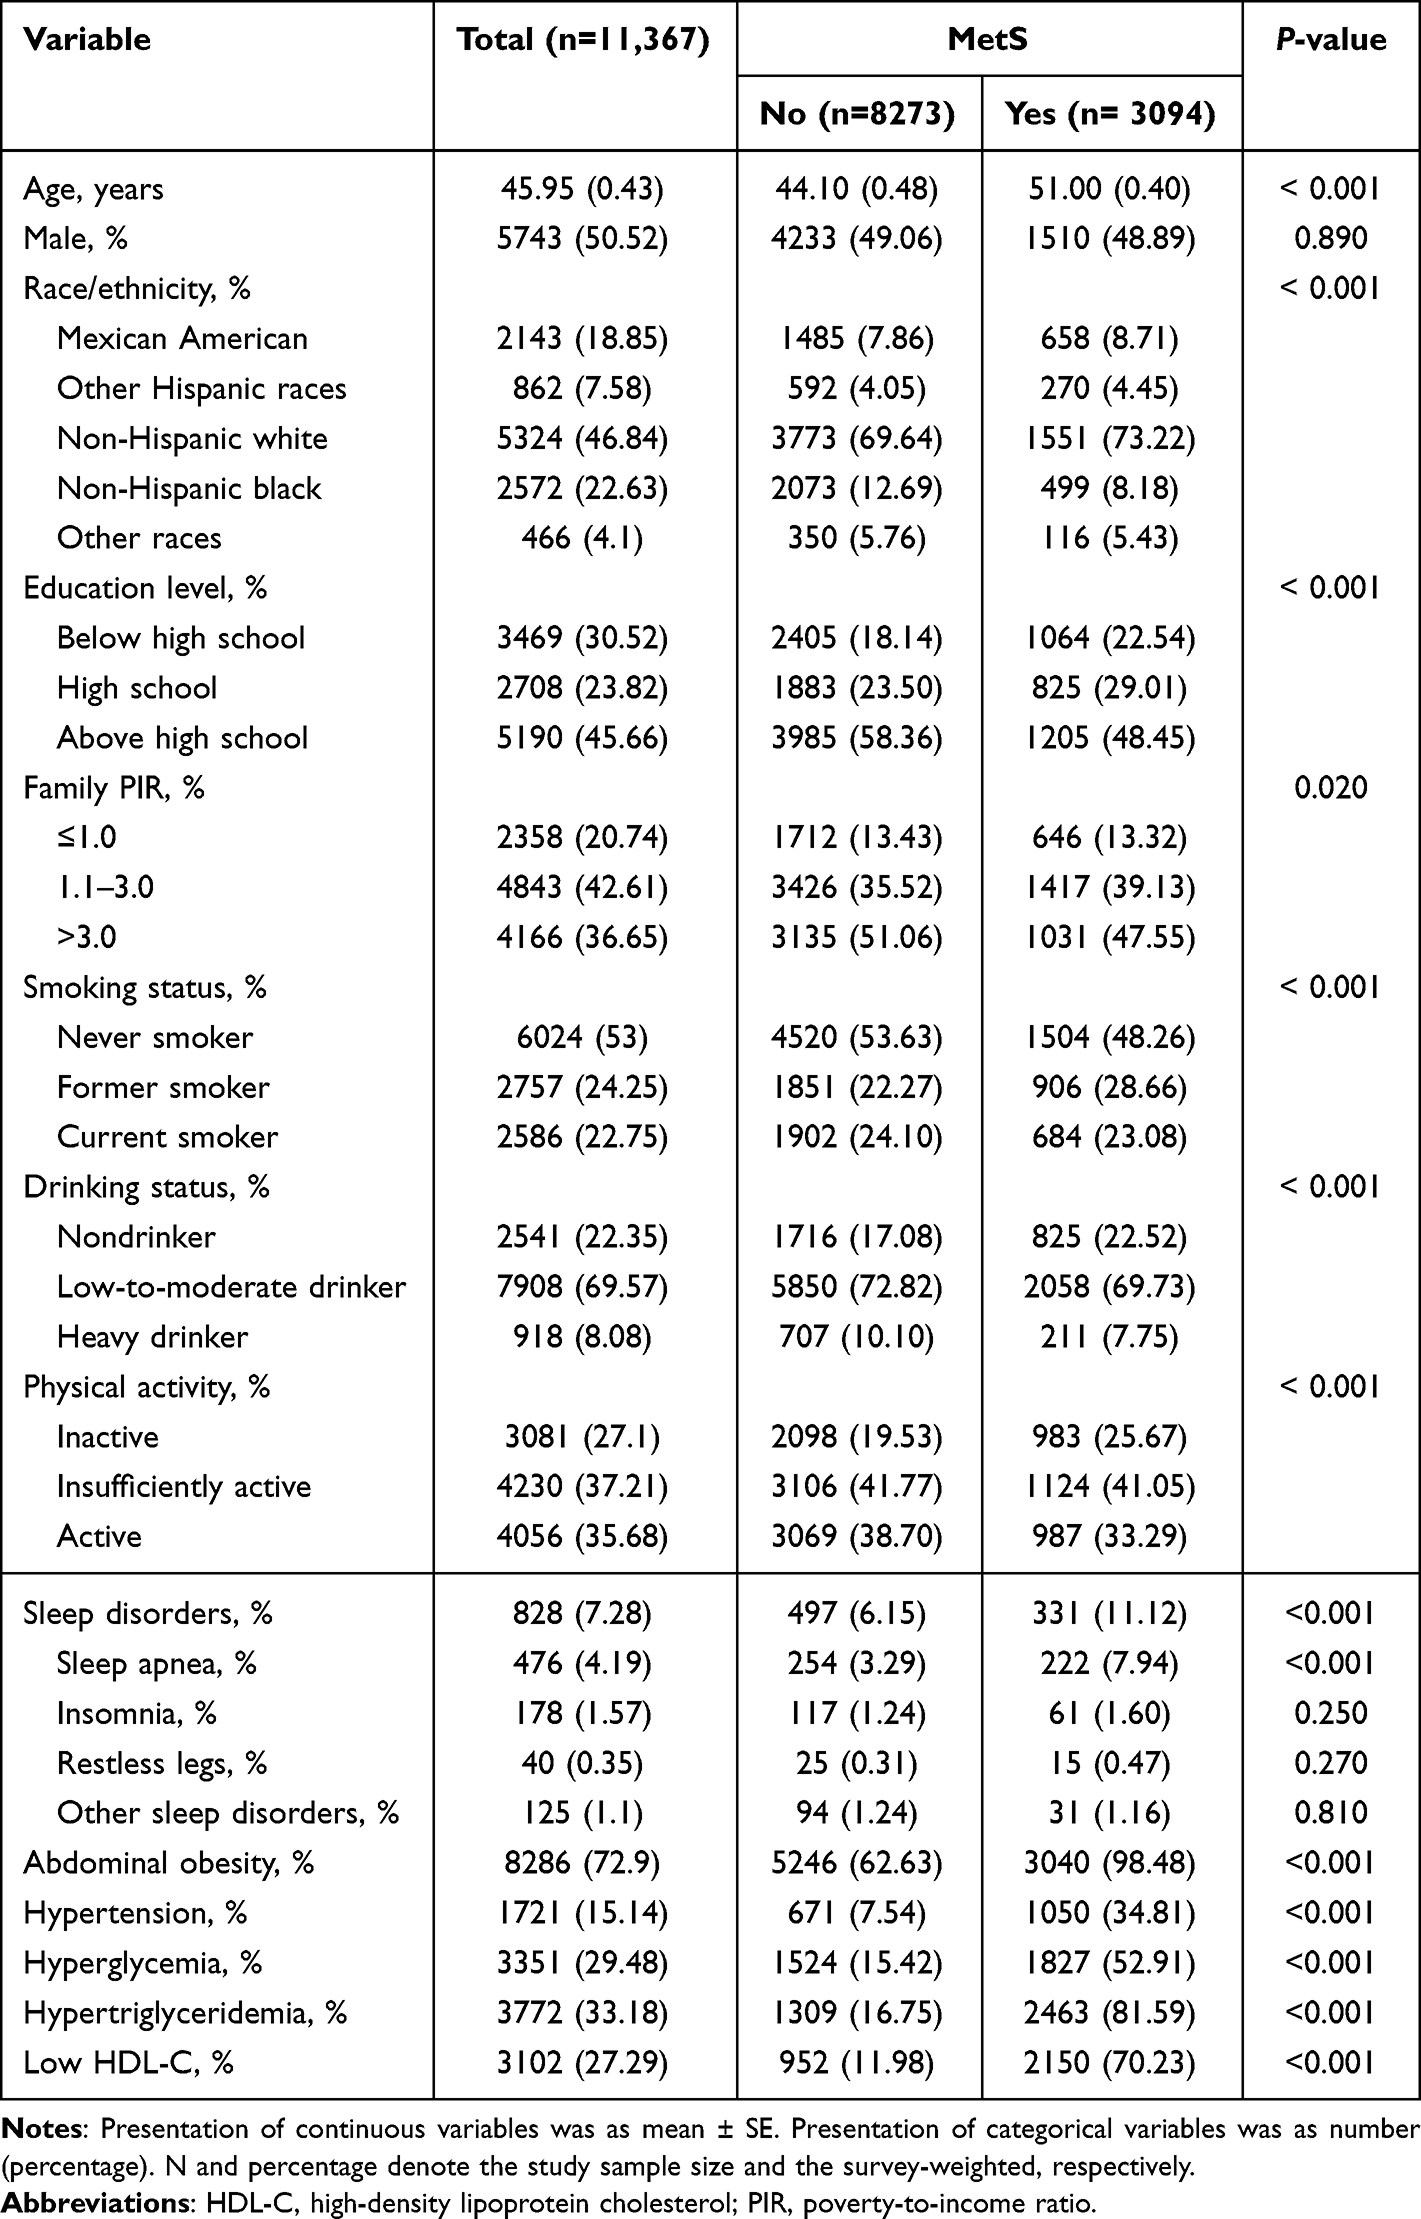 |
Table 2 Adult Participants’ Baseline Characteristics in the NHANES (2005–2008) |
The possible differential influences of subgroups on the relationship of OSA with the incidence of MetS were assessed via subgroup analysis (Figure 4). Among the 8 variables, no significant interaction could be statistically identified, except for age, when confounders could be adjusted (P for all interactions = 0.003). Notably, although OSA was significantly positively associated with the incidence of MetS in the majority of subgroups, no such association could be detected among subjects in the subgroups with heavy drinking.
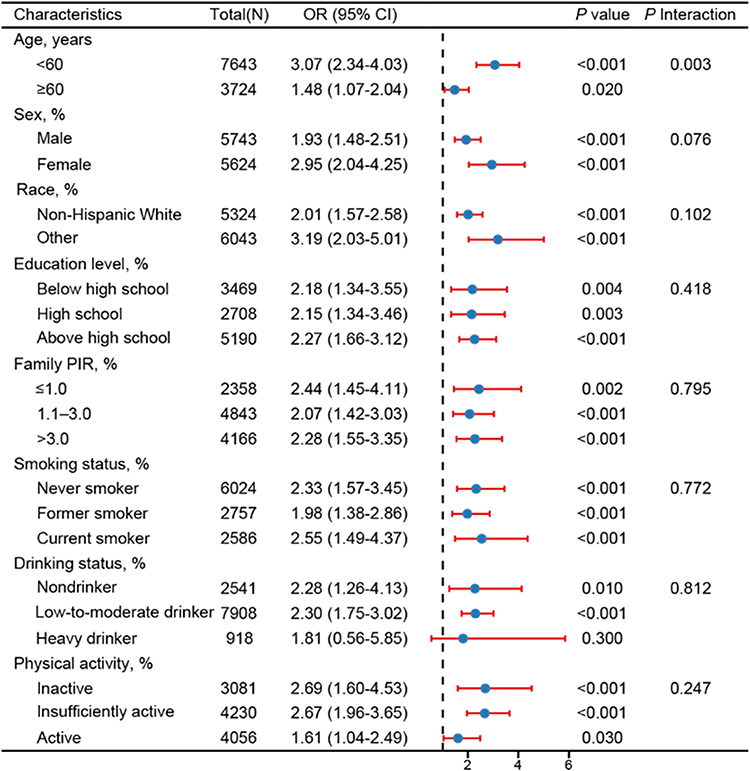 |
Figure 4 Stratified analysis of the association between sleep apnea and the incidence of MetS among adults in the NHANES (2005–2008). |
Effects of OSA on All-Cause and Cardiovascular Mortality
At median follow-up time of 12.4 years, 2147 all-cause deaths and 530 cardiovascular deaths could be identified among 11,367 adults. Survival differences were noted in all-cause (Figure 5A, P<0.001) and cardiovascular (Figure 5B, P<0.001) mortality among subjects on the basis of the Kaplan–Meier analysis grouped by OSA. All-cause and cardiovascular mortality rates were significantly elevated in subjects with OSA. The Cox regression analysis confirmed these results (Table 3). Compared with non-OSA subjects, significant association of OSA with all-cause and cardiovascular mortality could be revealed in Model 1. When age, gender, race, and educational level could be further adjusted in Model 2, no variation in the results could be identified and remained statistically significant. In Model 3, compared with non-OSA subjects, association of OSA with the greater risk of all-cause and cardiovascular mortality could be identified when family PIR, smoking status, drinking habits, and physical activity could be further adjusted, in which multivariate-adjusted hazard ratios (HRs) were 1.51 (95% CI: 1.06–2.15, P=0.024) and 1.46 (95% confidence interval [CI]: 1.20–1.77, P<0.001) for cardiovascular mortality and all-cause mortality, respectively.
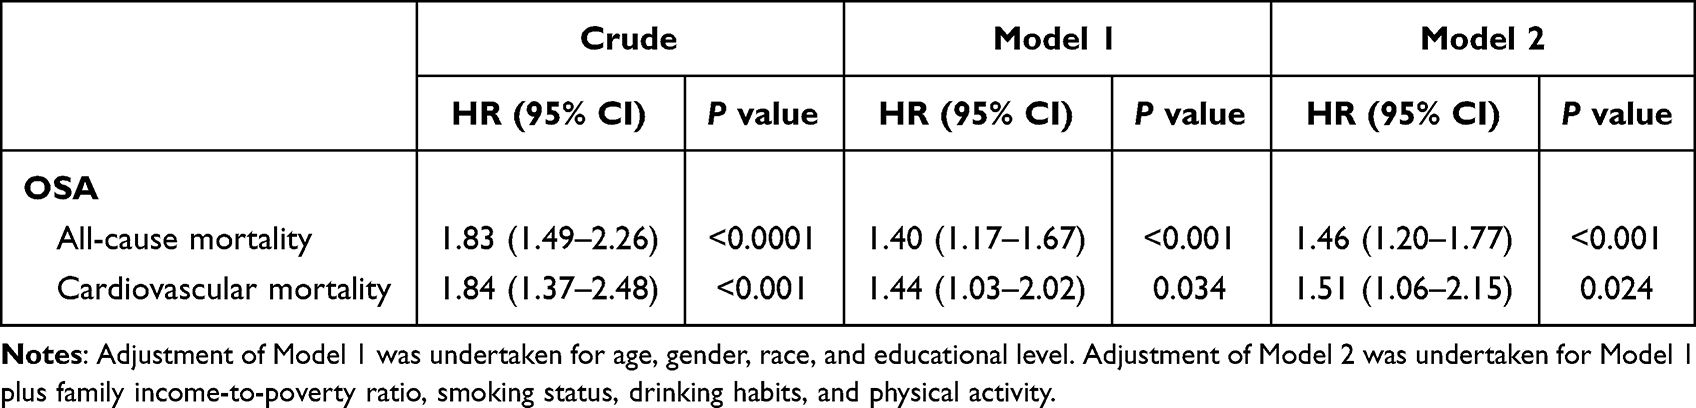 |
Table 3 HRs (95% CIs) of Cardiovascular and All-Cause Mortality According to Multiple Causes of OSA Among Adults in the NHANES (2005–2008) |
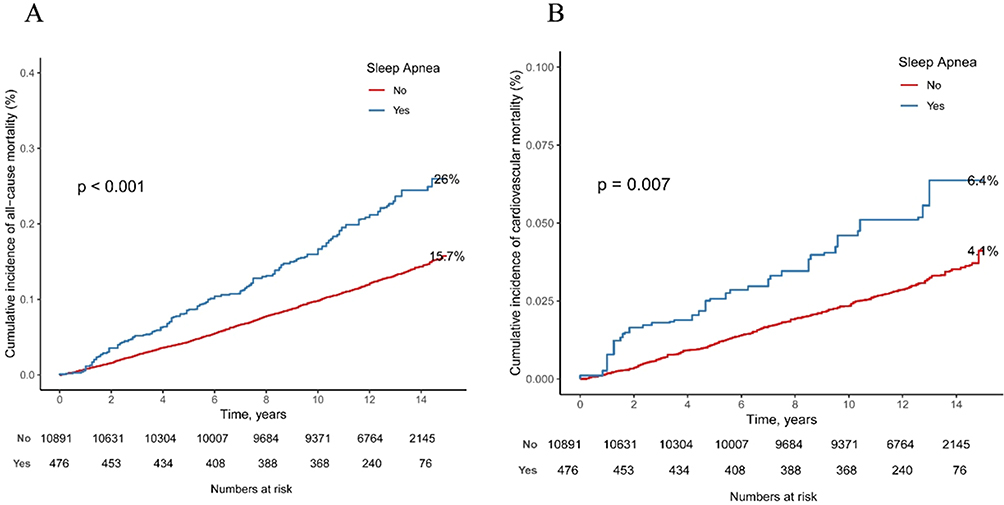 |
Figure 5 Kaplan-Meier survival curves for all-cause (A) and cardiovascular (B) mortality grouped by sleep apnea among adults in the NHANES (2005–2008). |
Association Between OSA and MetS
The association of OSA and MetS is shown in Table 4. In the unadjusted model, the positive relationship of OSA with MetS was confirmed (95% CI [2.07–3.12], OR=2.54, P<0.001). When covariates could be adjusted, such positive correlation could be still noted in Model 1 (95% CI [1.86–2.88], OR=2.31, P<0.001) and Model 2 (95% CI [1.82–2.80], OR=2.26, P<0.001). Similarly, once full adjustment was undertaken, the strongest correlation could be identified between OSA and abdominal obesity (95% CI [1.86–2.88], OR=2.31, P<0.001). What’s more, OSA showed a positive correlation with hypertension (95% CI [1.01–1.88], OR=1.38, P<0.044), hyperglycemia (95% CI [1.28–2.36], OR=1.74, P=0.002), hypertriglyceridemia (95% CI [1.16–1.74], OR=1.42, P=0.003), and low HDL (95% CI [1.39–2.26], OR=1.77, P<0.001) after full adjustment.
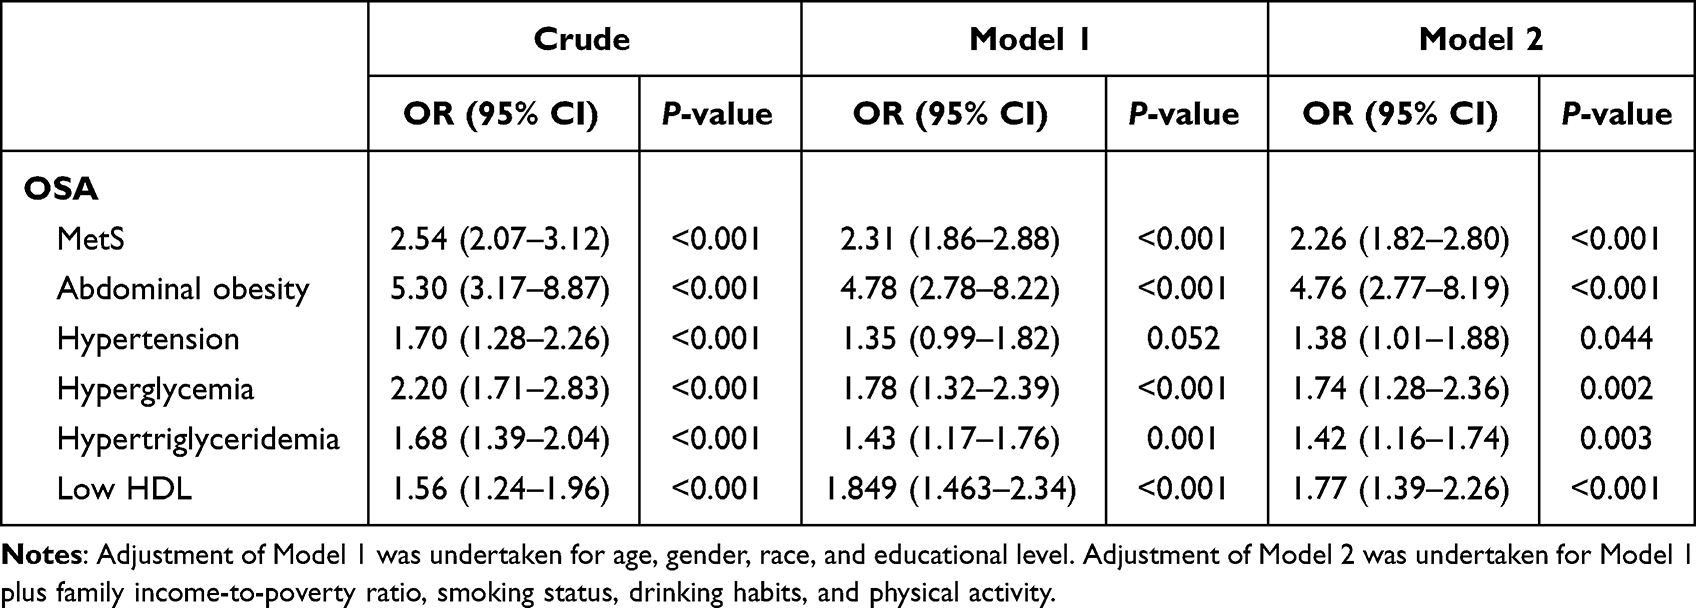 |
Table 4 ORs (95% CIs) of the Incidence of MetS and Its Components According to Multiple Causes of Sleep Disorders Among Adults in the NHANES (2005–2008) |
MR Analysis of OSA and MetS or CVD
As shown in Table 5, the relationship of OSA with the elevated risk of MetS was confirmed. It was revealed that the incidence of hypertension in the OSA group was 1.25-fold that of the control (95% CI [1.174–1.332], OR=1.250, P<0.001), and rise of the log-transformed OR of OSA by one unit could elevate the risk of diabetes (95% CI [1.152–1.624], OR=1.368, P<0.001). The high consistency of findings attained by the IVW method with those from MR analysis of OSA and hypertension or diabetes was proved. One SD elevation in standardized log transformed OSA was resulted in the reduction of the odds of BMI by 12.2% on the basis of the findings of the IVW method (95% Cl [1.042–1.208], OR=1.122, P=0.002), and such relationship could be also confirmed by the weighted median. One unit elevation in log odds of OSA was resulted in the escalated HDL level (95% CI [0.948–0.985], OR=0.966, P<0.001) and incidence of CVDs (95% CI [1.078–1.199], OR=1.137, P<0.001) on the basis of the findings of the IVW method. However, the difference in TG levels between the OSA group and the control group was not statistically significant (95% CI [0.995–1.027], OR=1.011, P=0.179). The consistency between the above mentioned findings and those attained by the IVW method could be approved. The association of OSA with MetS could be visualized via scatter plots (Figure 6).
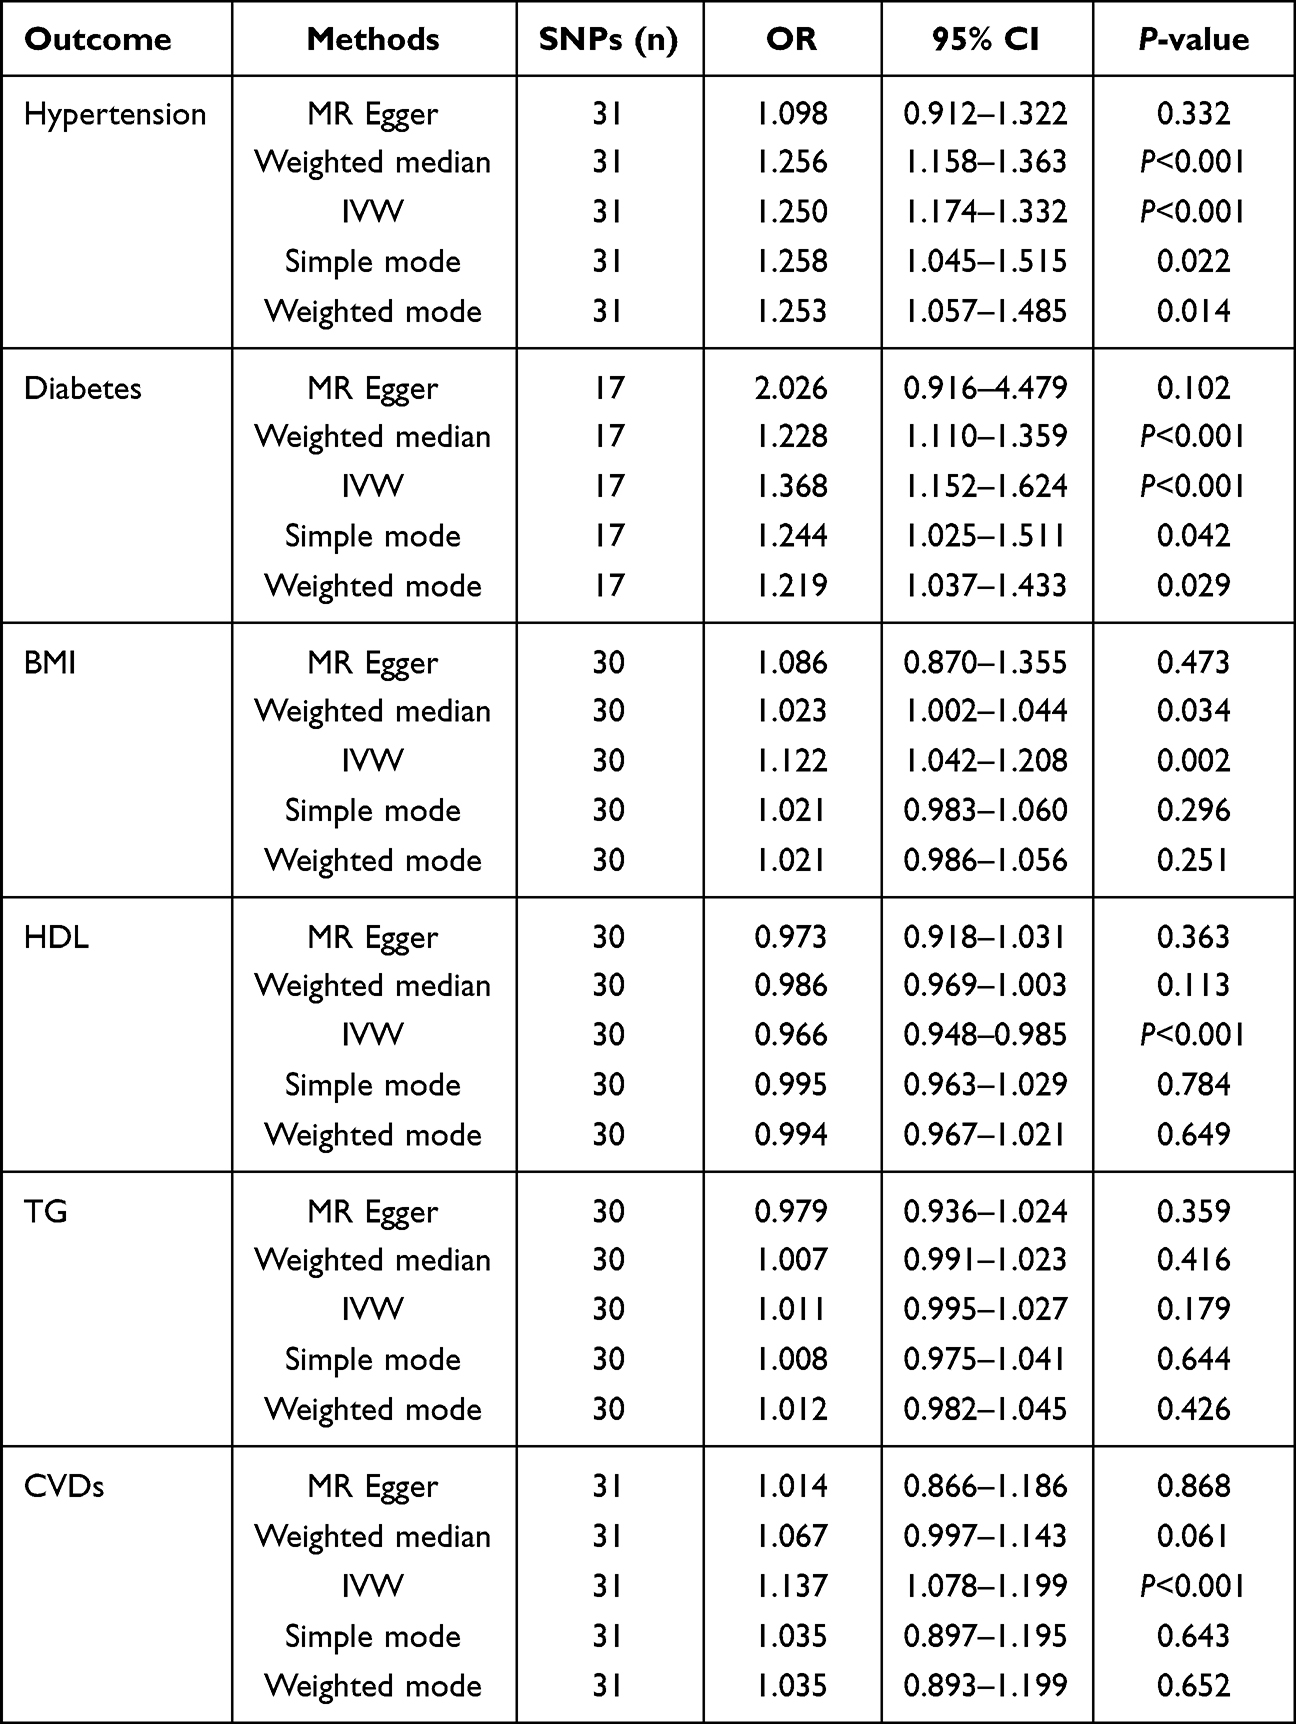 |
Table 5 MR Estimates of OSA Concerning the Risk for CVDs |
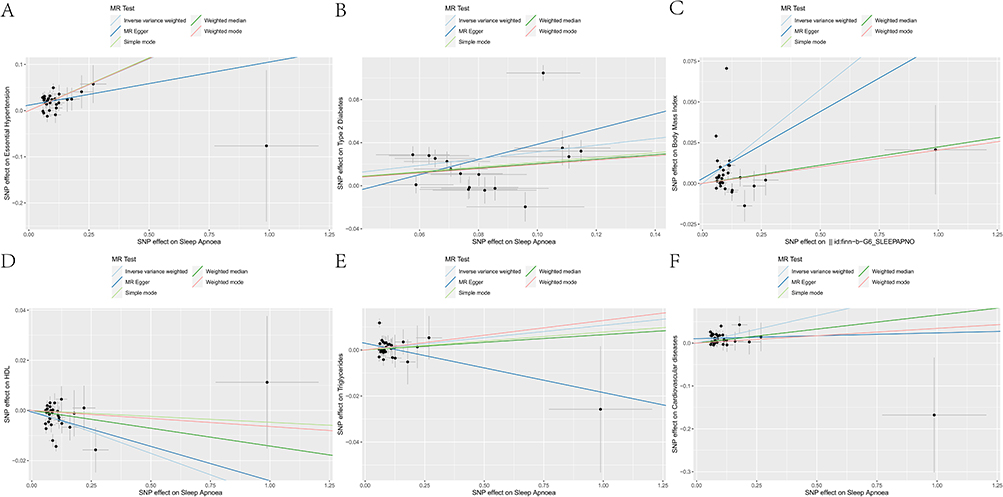 |
Figure 6 Visualization of causal influence of OSA on the incidence rates of Mets and CVD by scatter plots. Each point in the scatter plot represents a genetic variant, which shows us how each genetic variant (SNP) is associated with Exposure and Outcome. The magnitude of the causal relationship was indicated by the slope of the straight line. (A–E) Visualization of causal influence of OSA on the incidence rates of hypertension, diabetes, BMI, as well as on HDL and TG levels by scatter plots; (F) Visualization of causal influence of OSA on the incidence rate of CVD by the scatter plot. Abbreviations: MR, Mendelian randomization; IVW, inverse-variance weighted. |
Horizontal Pleiotropy MetS Assessment and Sensitivity Analysis
To indicate the presence of significant heterogeneity and horizontal pleiotropy, it was attempted to reveal the correlation among OSA, hypertension, diabetes, BMI, HDL level, TG level, and CVDs through some methods that were complementary to MR analysis. First, the negligible heterogeneity of SNPs was revealed on the basis of P-value > 0.05 in the heterogeneity test. The dominancy of the fixed-effect IVW method in the MR analysis was noted. Table 6 showsthe results of the heterogeneity test and pleiotropy. The negligible influence of IVs on such results was found through the “leave-one-out” sensitivity analysis, and the asymmetric distribution of single IVs was illustrated using a funnel plot, suggesting that the potential bias might not influence causality (Supplementary Figures 1 and 2).
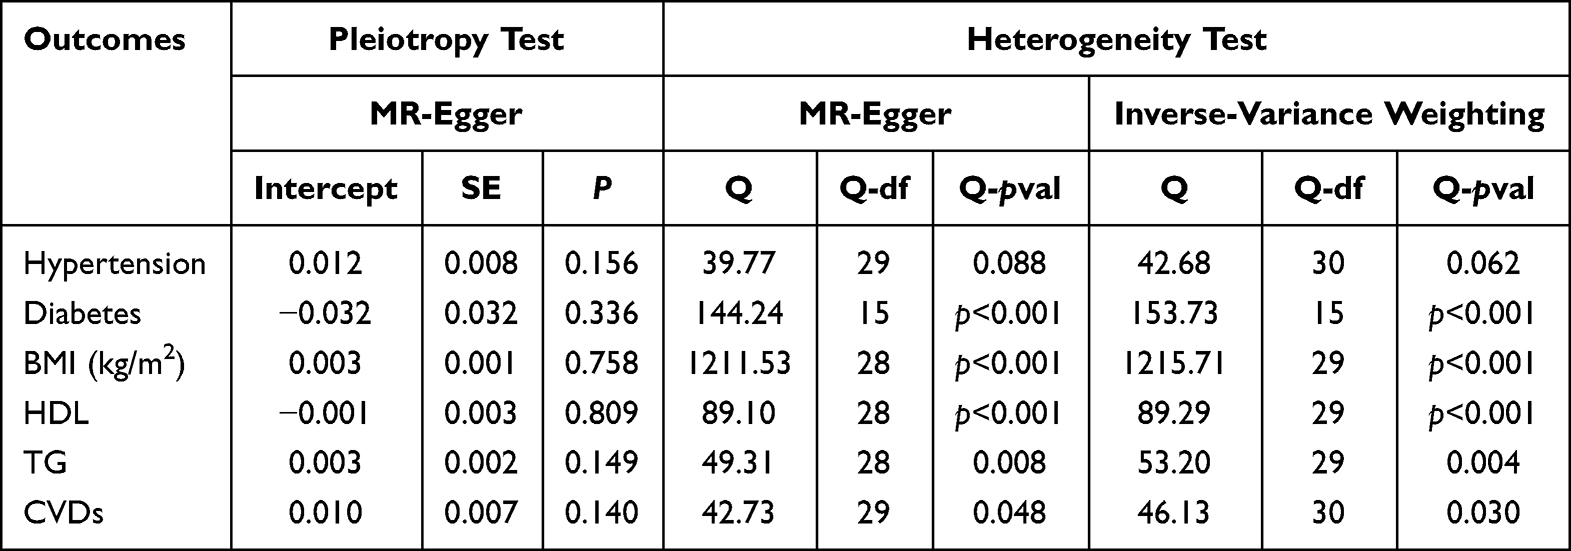 |
Table 6 Heterogeneity Test and Pleiotropy of OSA IVs from GWAS |
Discussion
The present cross-sectional study using the NHANES database demonstrated a positive association between OSA and Mets in both unadjusted models and after adjusting for demographic factors, lifestyle, dietary factors, and potential confounders of chronic disease (Table 4). In addition, the causal relationship between OSA and MetS was revealed by a two-sample MR. Notably, this is the first study that used MR to illustrate the association between OSA and MetS.
In patients with OSA, intermittent hypoxemia (IH) is one of its important features,27 triggering a surge in blood pressure and sympathetic nervous system overactivity via carotid chemoreceptors. Of note, patients with OSA who were awake also exhibited a persistent elevation in blood pressure that could be related to the enhanced sympathetic drive.28 In addition, there is evidence that the use of positive airway pressure (PAP) for OSA can lead to a reduction in the efficacy of anti-hypertensive therapy.29,30 Therefore, OSA is an important factor contributing to hypertension. The mechanisms by which OSA might cause diabetes were multifaceted. First, the correlation of OSA with insulin resistance could be confirmed. A previous study showed that versus the general population, there was a greater incidence of OSA in cases with T2DM, and it was further elevated with the severity of OSA.31 This could be attributed to intermittent hypoxemia (IH) leading to beta cell dysfunction and insulin resistance.32 Secondly, hypoxia could lead to the increased hypothalamic-pituitary-adrenal axis activity and circulating cortisol concentrations, which interfere with glucose metabolism and increase the risk of diabetes.33 Thirdly, in addition to the elevation of blood pressure, tissue sensitivity to insulin levels could be impaired by the sympathetic excitation. Finally, higher levels of inflammatory cytokines were found in OSA patients,34 which were more likely to lead to local or systemic inflammation. Inflammatory cytokines have also been noted to be associated with insulin resistance.35
Numerous studies have shown that OSA may influence BMI through leptin. Leptin can be combined with the surface OB receptor (OBRS) of the hypothalamus to activate the JAK-STAT signaling pathway to increase the expression levels of anorexia peptides and reduce appetite.36 The present study revealed that OSA and BMI had a positive correlation, and subsequent MR analysis demonstrated that there was a causal relationship between OSA and BMI. The Beijing Children and Youth Metropolitan Syndrome (BCAMS) study showed that among 3166 students who aged 6–12 years old, poor sleep was related to the higher BMI.37 In a Wisconsin sleep cohort study of 1024 adult participants who aged 30–60 years old, short sleep duration (<8 h) was shown to be associated with the lower leptin and higher BMI.38 Therefore, OSA may lead to obesity through the elevation of BMI caused by leptin, leading to the decreased leptin level, increased growth hormone-releasing peptide level, and enhanced appetite. The noticeable correlation of HDL with OSA severity was previously reported, accompanying by higher AHI values in patients with lower HDL levels.15 Several studies have evaluated circulating HDL-C concentrations in patients with OSA and the majority had reduced HDL-C levels.39,40 A meta-regression analysis showed that OSA was associated with higher total cholesterol, TG, and LDL levels, while lower HDL concentrations.41 As the pathological process of OSA is typically characterized by IH, oxidative stress, and inflammation, dysfunction of HDL is noteworthy, and its physiological effects are impaired.42 For instance, oxidative stress-related enzymes (eg, MPO) over-oxidize HDL.43 In addition, the reduced activity of HDL-bound paraoxonase-1 (PON-1) was also noted to be associated with HDL dysfunction. PON-1 has antioxidant properties, and lower circulating levels of PON-1 were identified in OSA patients than in controls.44 The present study confirmed a causal association between genetically driven OSA and HDL, while no causal association was detected between OSA and hypertriglyceridemia. IH during OSA may indirectly contribute to hypertriglyceridemia. As IH leads to a decrease in beta oxidation during lipolysis, more free fatty acids are used for synthesis of TG and cholesterol ester.45
The correlation of OSA with the incidence of CVD was previously proved,46 consistent with our findings which indicated the relationship of OSA with greater incidence rates of all-cause mortality and cardiovascular mortality. Meanwhile, MR analysis indicated a causal relationship between OSA and CVD. A greater risk of atrial fibrillation (AF) in OSA cases versus in non-OSA cases was previously concluded.47 A causal relationship of gene-driven OSA with AF has been explored recently.47,48 Acidosis, hypoxia, hypercapnia, and elevated pulmonary arterial pressure during OSA pathology could lead to the sympathetic-vagal activation, resulting in electrophysiological changes in the heart, increasing the frequency of premature atrial beats, and triggering AF.49,50 A range of 30–60% was reported for the incidence of sleep breathing disorders in cases with congestive heart failure.51 Furthermore, OSA is a common co-morbidity in cases with coronary artery disease (CHD).51 The positive relationship of OSA with CHD progression was previously revealed, and OSA appeared as a risk factor for CHD.52 Study showed the enhanced vasoconstriction in mice exposed to chronic intermittent hypoxemia, and an imbalance between vasoconstriction and diastole might lead to OSA-induced myocardial ischemic injury.53 Another MR-based study also illustrated an association between OSA and heart failure, hypertension, and AF, whereas no significant association was found with CHD.54
The present study had several strengths. The NHANES database appeared highly appropriate for figuring out correlations between diseases. Besides, the NHANES database considered potential confounders, enhancing the generalizability of the study results.55 MR is an effective method of causal inference. Genetic variations are regarded as IVs in MR analysis to figure out an outcome-exposure causal relationship, remarkably attenuating the confounding bias arisen from traditional epidemiological studies.56 Although the susceptibility of observational studies to unmeasured confounders and reverse causality was revealed, MR analysis has shown to have a high false-negative rate in case of controlling confounders. Thus, observational data from the NHANES database combined with a two-sample MR analysis made the study conclusions more reliable. This was the first study that employed MR to analyze the causal relationship between OSA and MetS.
However, some limitations should be described. Firstly, the data related to sleep disorders in the NHANES were derived from participants’ recollections and might be subjected to recall bias. Secondly, data from the NHANES and GWAS were derived from European and American populations, and further multi-ethnic research is therefore essential to confirm the findings. Thirdly, given the absence of direct MetS data within the GWAS database, variations in the definitions of central obesity could potentially influence the outcomes.57 Fourthly, there is a lack of objective evaluation of sleep because the diagnosis of OSA via polysomnography is not used. Furthermore, although Mendelian randomization demonstrated a causal relationship between OSA and MetS, further empirical evidence is awaited to prove this.
Conclusions
In conclusion, a positive association of OSA with MetS was suggested, accompanying by higher incidence rates of all-cause and cardiovascular mortality. MR analysis further confirmed the causal relationship of OSA with MetS and CVD. The next studies will concentrate on the specific mechanisms by which OSA affects MetS in order to propose individualized preventive and therapeutic measures.
Data Sharing Statement
The datasets presented in this study can be found in online repositories (https://www.finngen.fi/en; https://www.cdc.gov/nchs/nhanes/index.htm).
Ethics Statement
This study had no approval although it involves human participants. Data involved in this study were obtained from the NHANES website and GWAS database, with data collection approval by The National Center for Health Statistics Research Ethics Review Board and FINNGEN RESEARCH PROJECT. Participants gave informed consent before enrollment. Approved by the Ethics Committee of Changzhou First People’s Hospital, this study does not require ethical review.
Acknowledgments
We thank all the participants and researchers for their participation in this MR study. The IEU Open GWAS project and European Bioinformatics Institute GWAS Catalog provide summary data for the analyses.
Author Contributions
All authors made a significant contribution to the work reported, whether that is in the conception, study design, execution, acquisition of data, analysis and interpretation, or in all these areas; took part in drafting, revising or critically reviewing the article; gave final approval of the version to be published; have agreed on the journal to which the article has been submitted; and agree to be accountable for all aspects of the work.
Funding
This work was supported by Funding from Young Talent Development plan of Changzhou Health Commission (CZQM2020034, CZQM2020004). Young talents Science and technology project of Changzhou Health Commission (QN201913). The National Natural Science Fund (81701584). Social Development Projects of Changzhou Science and Technology Bureau (CE20205039). National Natural Science Foundation of China Grant Program (Project Approval No. 81970080).
Disclosure
The authors report no conflicts of interest in this work.
References
1. Kuna ST. Optimizing chronic management of adults with obstructive sleep apnea. Ann Am Thorac Soc. 2020;17(3):280–281. doi:10.1513/AnnalsATS.201912-897ED
2. Franklin KA, Lindberg E. Obstructive sleep apnea is a common disorder in the population-a review on the epidemiology of sleep apnea. J Thorac Dis. 2015;7(8):1311–1322. doi:10.3978/j.issn.2072-1439.2015.06.11
3. Lyons MM, Bhatt NY, Pack AI, Magalang UJ. Global burden of sleep-disordered breathing and its implications. Respirology. 2020;25(7):690–702. doi:10.1111/resp.13838
4. Rowley JA, Lareau S, Fahy BF, Garvey C, Sockrider M. What is obstructive sleep apnea in adults? Am J Respir Crit Care Med. 2017;196(1):P1–P2. doi:10.1164/rccm.1961P1
5. Alberti KG, Zimmet PZ. Definition, diagnosis and classification of diabetes mellitus and its complications. Part 1: diagnosis and classification of diabetes mellitus provisional report of a WHO consultation. Diabet Med. 1998;15(7):539–553. doi:10.1002/(SICI)1096-9136(199807)15:7<539::AID-DIA668>3.0.CO;2-S
6. Saklayen MG. The global epidemic of the metabolic syndrome. Curr Hypertens Rep. 2018;20(2):12. doi:10.1007/s11906-018-0812-z
7. Ahmed M, Kumari N, Mirgani Z, et al. Metabolic syndrome; definition, pathogenesis, elements, and the effects of medicinal plants on it’s elements. J Diabetes Metab Disord. 2022;21(1):1011–1022. doi:10.1007/s40200-021-00965-2
8. Cura-Esquivel I, Perales-Quintana MM, Torres-Gonzalez L, Guzman-Avilan K, Munoz-Espinosa L, Cordero-Perez P. Metabolic, inflammatory and adipokine differences on overweight/obese children with and without metabolic syndrome: a cross-sectional study. PLoS One. 2023;18(3):e0281381. doi:10.1371/journal.pone.0281381
9. Ford ES, Giles WH, Dietz WH. Prevalence of the metabolic syndrome among US adults: findings from the third National Health and Nutrition Examination Survey. JAMA. 2002;287(3):356–359. doi:10.1001/jama.287.3.356
10. Assallum H, Song TY, Aronow WS, Chandy D. Obstructive sleep apnoea and cardiovascular disease: a literature review. Arch Med Sci. 2021;17(5):1200–1212. doi:10.5114/aoms.2019.88558
11. Hou H, Zhao Y, Yu W, et al. Association of obstructive sleep apnea with hypertension: a systematic review and meta-analysis. J Glob Health. 2018;8(1):010405. doi:10.7189/jogh.08.010405
12. Levy P, Kohler M, McNicholas WT, et al. Obstructive sleep apnoea syndrome. Nat Rev Dis Primers. 2015;1:15015. doi:10.1038/nrdp.2015.15
13. Khandelwal D, Dutta D, Chittawar S, Kalra S. Sleep Disorders in Type 2 Diabetes. Indian J Endocrinol Metab. 2017;21(5):758–761. doi:10.4103/ijem.IJEM_156_17
14. Sultana R, Sissoho F, Kaushik VP, Raji MA. The case for early use of glucagon-like peptide-1 receptor agonists in obstructive sleep apnea patients with comorbid diabetes and metabolic syndrome. Life. 2022;12(8):1222. doi:10.3390/life12081222
15. Popadic V, Brajkovic M, Klasnja S, et al. Correlation of dyslipidemia and inflammation with obstructive sleep apnea severity. Front Pharmacol. 2022;13:897279. doi:10.3389/fphar.2022.897279
16. Ahluwalia N, Dwyer J, Terry A, Moshfegh A, Johnson C. Update on NHANES dietary data: focus on collection, release, analytical considerations, and uses to inform public policy. Adv Nutr. 2016;7(1):121–134. doi:10.3945/an.115.009258
17. Wen J, Wang C, Giri M, Guo S. Association between serum folate levels and blood eosinophil counts in American adults with asthma: results from NHANES 2011–2018. Front Immunol. 2023;14:1134621. doi:10.3389/fimmu.2023.1134621
18. Wang M, Jian Z, Yuan C, Jin X, Li H, Wang K. Coffee consumption and prostate cancer risk: results from National Health and Nutrition Examination Survey 1999–2010 and Mendelian randomization analyses. Nutrients. 2021;13(7):2317.
19. Davies NM, Holmes MV, Davey Smith G. Reading Mendelian randomisation studies: a guide, glossary, and checklist for clinicians. BMJ. 2018;362:k601. doi:10.1136/bmj.k601
20. Pu B, Gu P, Zheng C, Ma L, Zheng X, Zeng Z. Self-reported and genetically predicted effects of coffee intake on rheumatoid arthritis: epidemiological studies and Mendelian randomization analysis. Front Nutr. 2022;9:926190. doi:10.3389/fnut.2022.926190
21. Burgess S, Butterworth A, Malarstig A, Thompson SG. Use of Mendelian randomisation to assess potential benefit of clinical intervention. BMJ. 2012;345:e7325.
22. MacMillan Uribe AL, Leung CW, Crawford SD, Leak TM. Association between birthplace and time in the United States With Diet Quality in US adolescents: findings from the National Health and Nutrition Examination Survey, 2007 to 2018. J Nutr. 2022;152(11):2505–2513. doi:10.1093/jn/nxac117
23. Bowden J, Del Greco MF, Minelli C, Davey Smith G, Sheehan NA, Thompson JR. Assessing the suitability of summary data for two-sample Mendelian randomization analyses using MR-Egger regression: the role of the I2 statistic. Int J Epidemiol. 2016;45(6):1961–1974. doi:10.1093/ije/dyw220
24. Lawlor DA, Harbord RM, Sterne JA, Timpson N, Davey Smith G. Mendelian randomization: using genes as instruments for making causal inferences in epidemiology. Stat Med. 2008;27(8):1133–1163. doi:10.1002/sim.3034
25. Verbanck M, Chen CY, Neale B, Do R. Detection of widespread horizontal pleiotropy in causal relationships inferred from Mendelian randomization between complex traits and diseases. Nat Genet. 2018;50(5):693–698. doi:10.1038/s41588-018-0099-7
26. Bowden J, Davey Smith G, Burgess S. Mendelian randomization with invalid instruments: effect estimation and bias detection through Egger regression. Int J Epidemiol. 2015;44(2):512–525. doi:10.1093/ije/dyv080
27. Somers VK, White DP, Amin R, et al. Sleep apnea and cardiovascular disease: an American Heart Association/American College Of Cardiology Foundation Scientific Statement from the American Heart Association Council for High Blood Pressure Research Professional Education Committee, Council on Clinical Cardiology, Stroke Council, and Council On Cardiovascular Nursing. In collaboration with the National Heart, Lung, and Blood Institute National Center on Sleep Disorders Research (National Institutes of Health). Circulation. 2008;118(10):1080–1111. doi:10.1161/CIRCULATIONAHA.107.189375
28. Shen Z, Hu J, Wu H, et al. Global research trends and foci of artificial intelligence-based tumor pathology: a scientometric study. J Transl Med. 2022;20(1):409. doi:10.1186/s12967-022-03615-0
29. Javaheri S, Barbe F, Campos-Rodriguez F, et al. Sleep Apnea: types, Mechanisms, and Clinical Cardiovascular Consequences. J Am Coll Cardiol. 2017;69(7):841–858. doi:10.1016/j.jacc.2016.11.069
30. Javaheri S, Martinez-Garcia MA, Campos-Rodriguez F. CPAP treatment and cardiovascular prevention: we need to change the design and implementation of our trials. Chest. 2019;156(3):431–437. doi:10.1016/j.chest.2019.04.092
31. Elmasry A, Lindberg E, Berne C, et al. Sleep-disordered breathing and glucose metabolism in hypertensive men: a population-based study. J Intern Med. 2001;249(2):153–161. doi:10.1046/j.1365-2796.2001.00787.x
32. Ryan S. Adipose tissue inflammation by intermittent hypoxia: mechanistic link between obstructive sleep apnoea and metabolic dysfunction. J Physiol. 2017;595(8):2423–2430. doi:10.1113/JP273312
33. Song SO, He K, Narla RR, Kang HG, Ryu HU, Boyko EJ. Metabolic consequences of obstructive sleep apnea especially pertaining to diabetes mellitus and insulin sensitivity. Diabetes Metab J. 2019;43(2):144–155. doi:10.4093/dmj.2018.0256
34. Alberti A, Sarchielli P, Gallinella E, et al. Plasma cytokine levels in patients with obstructive sleep apnea syndrome: a preliminary study. J Sleep Res. 2003;12(4):305–311. doi:10.1111/j.1365-2869.2003.00361.x
35. Wieser V, Moschen AR, Tilg H. Inflammation, cytokines and insulin resistance: a clinical perspective. Arch Immunol Ther Exp. 2013;61(2):119–125. doi:10.1007/s00005-012-0210-1
36. Wei Z, Chen Y, Upender RP. Sleep disturbance and metabolic dysfunction: the roles of adipokines. Int J Mol Sci. 2022;23(3):1706.
37. Wrigley P, Khoury J, Eckerle B, et al. Prevalence of positive troponin and echocardiogram findings and association with mortality in acute ischemic stroke. Stroke. 2017;48(5):1226–1232. doi:10.1161/STROKEAHA.116.014561
38. Taheri S, Lin L, Austin D, Young T, Mignot E, Froguel P. Short sleep duration is associated with reduced leptin, elevated ghrelin, and increased body mass index. PLoS Med. 2004;1(3):e62. doi:10.1371/journal.pmed.0010062
39. Drager LF, Lopes HF, Maki-Nunes C, et al. The impact of obstructive sleep apnea on metabolic and inflammatory markers in consecutive patients with metabolic syndrome. PLoS One. 2010;5(8):e12065. doi:10.1371/journal.pone.0012065
40. Roche F, Sforza E, Pichot V, et al. Obstructive sleep apnoea/hypopnea influences high-density lipoprotein cholesterol in the elderly. Sleep Med. 2009;10(8):882–886. doi:10.1016/j.sleep.2008.07.017
41. Nadeem R, Singh M, Nida M, et al. Effect of CPAP treatment for obstructive sleep apnea hypopnea syndrome on lipid profile: a meta-regression analysis. J Clin Sleep Med. 2014;10(12):1295–1302. doi:10.5664/jcsm.4282
42. Rosenson RS, Brewer HB, Ansell BJ, et al. Dysfunctional HDL and atherosclerotic cardiovascular disease. Nat Rev Cardiol. 2016;13(1):48–60. doi:10.1038/nrcardio.2015.124
43. Hanikoglu F, Huseyinoglu N, Ozben S, Cort A, Ozdem S, Ozben T. Increased plasma soluble tumor necrosis factor receptor-1 and myeloperoxidase activity in patients with obstructive sleep apnea syndrome. Int J Neurosci. 2015;125(9):655–662. doi:10.3109/00207454.2014.960521
44. Meszaros M, Bikov A. Obstructive sleep apnoea and lipid metabolism: the summary of evidence and future perspectives in the pathophysiology of OSA-associated dyslipidaemia. Biomedicines. 2022;10(11):2754.
45. Barros D, Garcia-Rio F. Obstructive sleep apnea and dyslipidemia: from animal models to clinical evidence. Sleep. 2019;42(3). doi:10.1093/sleep/zsy236
46. Salari N, Khazaie H, Abolfathi M, et al. The effect of obstructive sleep apnea on the increased risk of cardiovascular disease: a systematic review and meta-analysis. Neurol Sci. 2022;43(1):219–231. doi:10.1007/s10072-021-05765-3
47. Li Y, Leng Y, Tang H, et al. Assessment of the causal effects of obstructive sleep apnea on atrial fibrillation: a Mendelian randomization study. Front Cardiovasc Med. 2022;9:843681. doi:10.3389/fcvm.2022.843681
48. Chen L, Sun X, He Y, Lu Y, Zheng L. Obstructive sleep apnea and atrial fibrillation: insights from a bidirectional Mendelian randomization study. BMC Med Genomics. 2022;15(1):28. doi:10.1186/s12920-022-01180-5
49. Linz D, Hohl M, Ukena C, et al. Obstructive respiratory events and premature atrial contractions after cardioversion. Eur Respir J. 2015;45(5):1332–1340. doi:10.1183/09031936.00175714
50. Yu L, Li X, Huang B, et al. Atrial fibrillation in acute obstructive sleep apnea: autonomic nervous mechanism and modulation. J Am Heart Assoc. 2017;6(9). doi:10.1161/JAHA.117.006264
51. Collen J, Lettieri C, Wickwire E, Holley A. Obstructive sleep apnea and cardiovascular disease, a story of confounders! Sleep Breath. 2020;24(4):1299–1313. doi:10.1007/s11325-019-01945-w
52. Chen L, Zou S, Wang J. Association of Obstructive Sleep Apnea Syndrome (OSA/OSAHS) with coronary atherosclerosis risk: systematic review and meta-analysis. Comput Math Methods Med. 2022;2022:8905736. doi:10.1155/2022/8905736
53. Li YE, Ren J. Association between obstructive sleep apnea and cardiovascular diseases. Acta Biochim Biophys Sin. 2022;54(7):882–892. doi:10.3724/abbs.2022084
54. Li Y, Miao Y, Zhang Q. Causal associations of obstructive sleep apnea with cardiovascular disease: a Mendelian randomization study. Sleep. 2023;46(3). doi:10.1093/sleep/zsac298
55. Zhang J, Wang X, Ma Z, et al. Associations of urinary and blood cadmium concentrations with all-cause mortality in US adults with chronic kidney disease: a prospective cohort study. Environ Sci Pollut Res Int. 2023;30(22):61659–61671.
56. Larsson SC, Burgess S, Michaelsson K. Association of genetic variants related to serum calcium levels with coronary artery disease and myocardial infarction. JAMA. 2017;318(4):371–380. doi:10.1001/jama.2017.8981
57. Alberti KG, Eckel RH, Grundy SM, et al. Harmonizing the metabolic syndrome: a joint interim statement of the International Diabetes Federation Task Force on Epidemiology and Prevention; National Heart, Lung, and Blood Institute; American Heart Association; World Heart Federation; International Atherosclerosis Society; and International Association for the Study of Obesity. Circulation. 2009;120(16):1640–1645. doi:10.1161/CIRCULATIONAHA.109.192644
 © 2024 The Author(s). This work is published and licensed by Dove Medical Press Limited. The full terms of this license are available at https://www.dovepress.com/terms.php and incorporate the Creative Commons Attribution - Non Commercial (unported, v3.0) License.
By accessing the work you hereby accept the Terms. Non-commercial uses of the work are permitted without any further permission from Dove Medical Press Limited, provided the work is properly attributed. For permission for commercial use of this work, please see paragraphs 4.2 and 5 of our Terms.
© 2024 The Author(s). This work is published and licensed by Dove Medical Press Limited. The full terms of this license are available at https://www.dovepress.com/terms.php and incorporate the Creative Commons Attribution - Non Commercial (unported, v3.0) License.
By accessing the work you hereby accept the Terms. Non-commercial uses of the work are permitted without any further permission from Dove Medical Press Limited, provided the work is properly attributed. For permission for commercial use of this work, please see paragraphs 4.2 and 5 of our Terms.