")
Back to Journals » Nature and Science of Sleep » Volume 15
EEG Power Spectral Density in NREM Sleep is Associated with the Degree of Hypoxia in Patients with Obstructive Sleep Apnea
Authors Zhang C, Wang Y, Li D, Li M, Zhang X, Rong W, Wang P, Li L , He S, Xu Y , Li Y
Received 3 August 2023
Accepted for publication 17 November 2023
Published 27 November 2023 Volume 2023:15 Pages 979—992
DOI https://doi.org/10.2147/NSS.S433820
Checked for plagiarism Yes
Review by Single anonymous peer review
Peer reviewer comments 2
Editor who approved publication: Dr Valentina Alfonsi
Chan Zhang,1,2,* Yanhui Wang,1,4,* Dongxiao Li,3 Mengjie Li,1,4 Xiaofeng Zhang,1,2 Wenzheng Rong,1,2 Pu Wang,1 Lanjun Li,1,2 Shujing He,1,2 Yuming Xu,1,2 Yusheng Li1,2
1Department of Neurology, The First Affiliated Hospital of Zhengzhou University, Zhengzhou University, Zhengzhou, Henan, 450000, People’s Republic of China; 2NHC Key Laboratory of Prevention and Treatment of Cerebrovascular Diseases, Zhengzhou, Henan, People’s Republic of China; 3Henan Neurodevelopment Engineering Research Center for Children, Henan Key Laboratory of Children’s Genetics and Metabolic Diseases, Children’s Hospital Affiliated to Zhengzhou University, Zhengzhou, Henan, 450018, People’s Republic of China; 4The Academy of Medical Sciences of Zhengzhou University, Zhengzhou University, Zhengzhou, Henan, People’s Republic of China
*These authors contributed equally to this work
Correspondence: Yuming Xu; Yusheng Li, Department of Neurology, the First Affiliated Hospital of Zhengzhou University, Zhengzhou University, Zhengzhou, Henan, 450000, People’s Republic of China, Tel +86-18236145799, Fax +86-371-66862134, Email [email protected]; [email protected]
Purpose: Obstructive sleep apnea (OSA) is a prevalent sleep-related breathing disorder. Research conducted on patients with OSA using electroencephalography (EEG) has revealed a noticeable shift in the overnight polysomnography (PSG) power spectrum. To better quantify the effects of OSA on brain function and to identify the most reliable predictors of pathological cortical activation, this study quantified the PSG power and its association with the degree of hypoxia in OSA patients.
Patients and Methods: This retrospective study recruited 93 patients with OSA. OSA patients were divided into three groups based on their apnea-hypopnea index (AHI) scores. The clinical characteristics and sleep macrostructure of these patients were examined, followed by an analysis of PSG signals. Power spectral density (PSD) in five frequency bands was analyzed during nonrapid eye movement (NREM) sleep, rapid eye movement (REM) sleep, and wakefulness. Finally, correlation analysis was conducted to assess the relationships among PSD, PSG parameters, and serum levels of S100β and uric acid.
Results: Obstructive sleep apnea occurred during both the NREM and REM sleep phases. Except for a decrease in the duration of N2 sleep and an increase in the microarousal index, there were no significant differences in sleep architecture based on disease severity. Compared to the mild OSA group, the theta and alpha band PSD in the frontal and occipital regions during NREM sleep and wakefulness were significantly decreased in the moderate and severe OSA groups. Correlation analysis revealed that theta PSD in N1 and N3 stages were negatively correlated the AHI, oxygen desaturation index, SaO2< 90% and microarousal index.
Conclusion: These findings imply that patients with more severe OSA exhibited considerable NREM hypoxia and abnormal brain activity in the frontal and occipital regions. Therefore, sleep EEG oscillation may be a useful neurophysiological indicator for assessing brain function and disease severity in patients with OSA.
Keywords: obstructive sleep apnea, OSA, quantitative EEG, polysomnography, power spectral density, nonrapid eye movement sleep, serum markers
Introduction
Obstructive sleep apnea (OSA) is a prevalent sleep-related breathing disorder that affects many individuals.1,2 It is characterized by recurrent episodes of complete or partial upper airway obstruction (apnea) during sleep, leading to sleep fragmentation,3,4 intermittent hypoxia, snoring, daytime sleepiness,5,6 inattention, memory loss, and behavioral abnormalities.7–9 Chronic hypoxia associated with OSA may adversely affect nervous system function, increasing the likelihood of structural and functional brain abnormalities10–12 and of impaired cognition.8,13–16 However, despite numerous studies, the consequences of chronic hypoxia during sleep on brain function and the related underlying mechanisms remain unclear. The apnea-hypopnea index (AHI) and oxygen desaturation index (ODI), two common clinical indicators of OSA disease severity, are not consistently or strongly correlated with functional capacity, making it challenging for clinicians to determine which patients are at risk of neurobehavioral dysfunction and require additional treatment.8,16 The potential value of quantitative electroencephalography (EEG) analysis as a biomarker of neurobehavioral function has been widely demonstrated in various neuropsychiatric disorders. Sleep-related neural activity provides important information for understanding brain function.17–19 Our study hypothesized about the underlying changes in sleep architecture and used quantitative EEG measurements to identify the most reliable predictors of aberrant cortical activity in patients with OSA.
Numerous studies have investigated the EEG power spectrum in patients with OSA. However, we noticed that the research findings regarding power spectral density (PSD) are currently inconsistent, and the underlying neurophysiological mechanisms are still unclear. Previous studies have discovered that the delta power of N2 sleep was higher in the severe OSA group compared to the simple snoring group and was associated with high AHI levels, while the power spectrum in other frequency bands decreased.18 In another study on OSA with various severity levels, the beta-band power spectrum of the severe OSA group during the NREM phase was higher than that of the mild OSA group, whereas the sigma-band power spectrum shrank.20 Significantly reduced slow-wave activity, an indicator of homeostatic sleep demand and depth, has been observed in OSA patients when compared to controls in some studies of NREM sleep, but not in all of them.21 In addition, only few studies have examined the pattern of EEG frequency variations across the entire sleep (NREM, REM, and waking) in individuals with varying degrees of apnea severity. Therefore, our research aimed to provide further insight into the relationship between hypoxia and EEG characteristics in different sleep stages of OSA patients with varying degrees of disease severity.
Clinically, OSA is a widespread condition linked to alterations in the brain structure, and serological indicators can be used as biomarkers to reflect aberrant brain function in patients with OSA. This could provide a new direction for analyzing the correlation between serum markers and PSD. S100β (released by astrocytes) activates the advanced glycation end product (RAGE) receptor, causing neuronal survival or death, activating astrocytes, and ultimately promoting an inflammatory response.22,23 In a meta-analysis, elevated serum S100β levels were observed in patients with OSA, suggesting that S100β could be used as a peripheral indicator of brain damage in these patients.24 In another clinical trial, S100β levels were found to be significantly correlated with AHI.25 However, correlation studies between S100β and EEG signals in OSA patients are relatively lacking and need to be further explored. This study aimed to fill this gap.
Prevention of oxidative stress is the primary reason for the neuroprotective effects of uric acid. As an antioxidant, uric acid can scavenge free oxygen radicals, thereby reducing oxidative stress levels, protecting endothelial cell function, reducing Ca2+ overload, and playing neuroprotective roles in various central nervous system diseases. A previous study reported that appropriate concentrations of uric acid significantly improved cell viability and apoptosis during oxygen-glucose deprivation (OGD)/reoxygenation and reduced production of reactive oxygen species (ROS).26 Elevated uric acid levels were associated with OSA severity in a retrospective study,27 but no correlation was found with PSD.
Uric acid has been associated with systemic inflammation, and recent studies have suggested that it may play a neuroprotective role in certain contexts. Uric acid is the end product of purine catabolism in humans and is considered the primary endogenous antioxidant in the bloodstream. It plays a crucial role in protecting against oxidative stress by interacting with reactive oxygen species (ROS) and converting non-enzymatically to allantoin.28–30 Oxidative stress is one of the major mechanisms involved in the pathophysiology of central nervous system inflammation and neurodegenerative diseases. In some studies, higher levels of uric acid have been associated with a reduced risk of neurodegenerative diseases such as Parkinson’s and Alzheimer’s.31 The protective effect of UA was also observed during CNS inflammation. In adult rat models of pneumococcal meningitis, pretreatment with UA alleviated meningeal inflammation in a dose-dependent manner, with the severity of inflammation decreasing as a function of UA concentration as UA levels increased to levels close to those found in humans.31 After the establishment of middle cerebral artery occlusion in male rats by a suture method, the injury and increase of ROS in brain tissue were observed, and the degree of brain injury and ROS production were reduced after the addition of appropriate concentration of uric acid. However, some research found that UA had a pro-inflammatory effect, triggering interleukin-3β-mediated inflammation by activating inflammasome, and its activation appears to play a central role in many pathologic inflammatory conditions.31 Hence the role of uric acid in disease is complex and need further research.26
Therefore, this study aimed to analyze the relationship between the power spectrum of polysomnography (PSG) and serum markers in OSA patients with varying degrees of disease severity. We hypothesized that the severity of OSA, especially during NREM sleep, is associated with the power spectrum characteristics of overnight sleep EEG.
Materials and Methods
Study Population
In this retrospective study, 444 patients who complained of snoring and had a clinical suspicion of OSA at the Neurology Department of the First Affiliated Hospital of Zhengzhou University, Zhengzhou, China, between 2020 and 2022 were enrolled. Individuals with other sleep disorders (eg, central sleep apnea, rapid eye movement sleep behavioral disorder, restless legs syndrome, narcoleptic spectral disorder, and periodic limb movement disorder) or those taking medications within the last month known to affect sleep status (eg, hypnotics, benzodiazepines) were excluded. Individuals with apparent artifacts in the EEG signal, and those with serious lung, kidney, liver, or brain diseases, cardiovascular disease, other complications of OSA (eg, hyperlipidemia, metabolic syndrome, osteoporosis) were excluded (Figure 1). Clinical data and PSG studies from 93 subjects were eventually selected and divided into three groups, according to the standards recommended by the Chinese Medical Association: mild OSA group (5≤AHI<15 events/h, N=27), moderate OSA group (15≤AHI<30 events/h, N=26), and severe OSA group (30≤AHI events/h, N=40) (Figure 1, Table 1). The study was conducted in accordance with the 1964 Helsinki Declaration and its later amendments or comparable ethical standards. The study protocol was approved by the Ethics Committee of the First Affiliated Hospital of Zhengzhou University, and informed consent was waived by our Institutional Review Board because of the retrospective nature of our study (ethics approval no. 2022 [101]). We pledge to strictly adhere to patient data confidentiality and take all necessary measures to protect patient privacy.
 |
Table 1 Characteristics of the Population (N = 93) Categorized by OSA Severity |
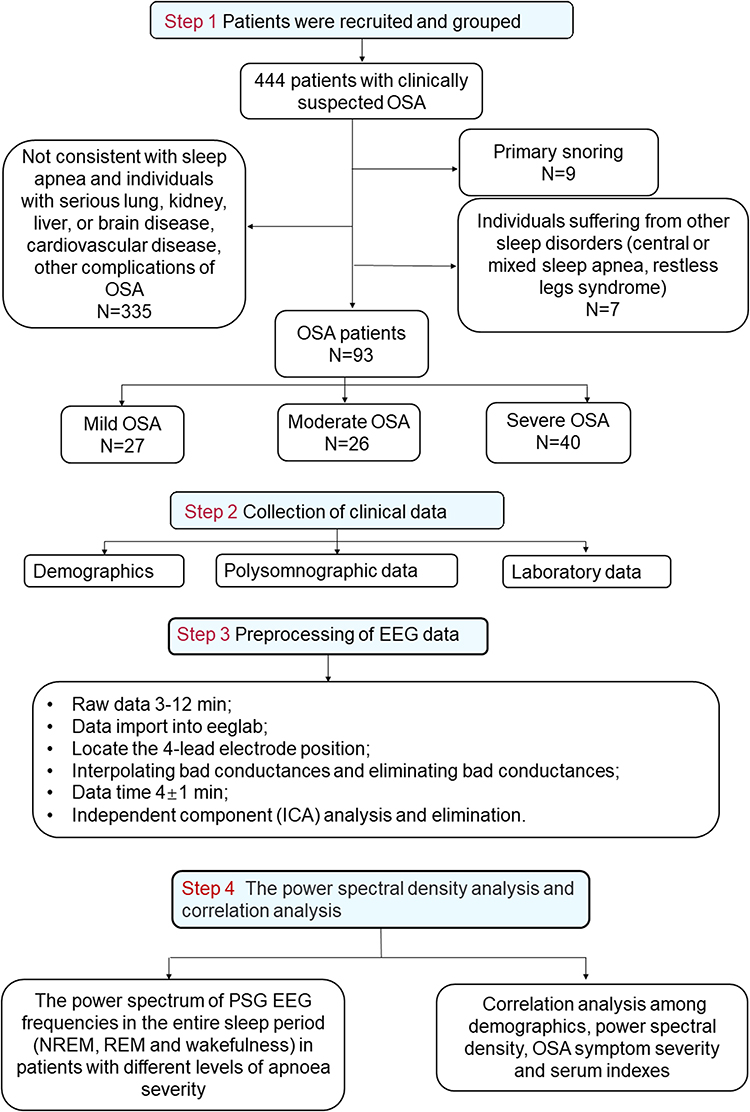 |
Figure 1 Flow chart of patient recruitment and grouping, clinical data collection, sleep EEG processing and data analysis. |
Overnight PSG
Sleep apnea was confirmed by an overnight PSG.32 Six EEG signals (F3-M2, F4-M1, C1-M2, C2-M1, O1-M2, and O2-M1), two channels of electrooculography (EOG) signals (E1-M2, E2-M2), chin EMG (EMG1-EMG2, EMG1-EMG3), electrocardiography (ECG), respiration (nasal pressure, airflow), oxygen saturation (SpO2), abdominal and chest movement, and leg movements were recorded.33 Due to limitations associated with our collection equipment and technology, we were unable to include the central channel in our analysis.
Sleep stages and respiratory events were analyzed according to the Chinese Medical Association guidelines. The sleep stages were divided into the NREM (N1, N2, and N3) sleep, rapid eye movement (REM) sleep, and wake stages. Sleep-related parameters such as time in bed, total sleep time (TST), sleep latency (SL), sleep efficiency (SE), wake time after sleep onset (WASO), and the proportion of each sleep period in total sleep (N1/TST, N2/TST, and N3/TST) were calculated and reported in the PSG study report (Table 1).
For apnea-hypopnea index (AHI), we calculated the number of apnea and hypopnea events per hour of sleep. For apnea-hypopnea events (AHE), it was calculated according to the total number of apnea and hypopnea event during sleep. Oxygen desaturation index (ODI) is the number of oxygen desaturation events that occur per hour during sleep, below a specific threshold; Micro-awakening index (MAI) refers to the number of micro-awakening per hour, including breath-related micro-awakening, leg motion-related micro-awakening, spontaneous micro-awakening, and periodic leg motion-related micro-awakening. A higher MAI value indicates poorer sleep continuity and lower sleep quality.
Spectral and Topographical Analysis of PSG EEG Signals
We used non-invasive electrodes to record scalp EEG signals from sleeping participants, as described in the overnight PSG method. All EEG signals were recorded at a sampling rate greater than or equal to 200 Hz, and were stored in the EDF format. The MATLAB software (MATLAB 2013a) was used for EEG preprocessing. A band-pass filter of 0.5–45.0 Hz was applied to the original signals in the EEGLab software. Signals from four channels (F3-M2, F4-M1, O1-M2, and O2-M1) were analyzed. Subsequently, data were processed using artifact removal and independent component analysis (ICA) (Figure 1, step 3). We first estimated the power spectrum in 5 frequency bands (delta,1.0–4.0 Hz; theta, 4.0–8.0 Hz; alpha, 8.0–13.0 Hz; beta,13.0–30.0 Hz; gamma, 30.0–45.0 Hz) for each 4 ± 1 min segment using the Welch method.18 This is a modification of the periodogram method that produces more reliable power spectrum estimates by applying windows, overlaps, and correlation analyses (see Figure 1, Step 4 for a flow chart). The topographical PSD variation in the three OSA groups over the five frequency bands was also examined.
Measurement of Serum S100β and Uric Acid
Three milliliters of elbow venous blood were extracted from fasting patients early in the morning before the PSG study. An enzyme-linked immunosorbent assay (ELISA) was used to test the expression levels of serum S100β protein according to manufacturer instructions. Blood samples were collected in test tubes without gel inhibitors and centrifuged at 3500 rpm at 4 °C for 15 min immediately, and then the precipitation-free liquid components were stored at −70 °C for assay. As a result, S100B protein was programmed by commercially available ELISA kit (S100B Human ELISA Kit, Abnova, Germany).34 Details of the S100B ELISA can be found in the supplementary online method (http://www.abnova.com/). Normal ranges for S100b <105 pg/mL.
Blood uric acid was measured by the Olympus Au400 automatic biochemical analyzer. Elbow venous blood was centrifuged at 4000 r/min for 10 min. The kit used for the analysis was purchased from Shanghai Kehua-Dongling Diagnostic Products Co., LTD., and the procedure was strictly followed according to the kit instructions. Normal ranges for uric acid are 120~430 μmol/L.
Statistical Methods
Statistical analyses were performed using the GraphPad Prism (version 8.3.0) and SPSS (version 26.0) software. The measured data are presented as mean ± standard deviation if normally distributed, or otherwise as median with interquartile range in brackets. Normally distributed variables were compared using a one-way analysis of variance. ANCOVA was performed to compare the powers of each spectral bandwidth among the groups after controlling for potential confounders, including age and sex. The significance of the comparison of the spectral powers of the groups during total sleep was defined as P< 0.05 after Tukey multiple comparisons. To identify the relevant independent EEG indices related to the severity of OSA, multiple regression analysis was used.
Results
Demographic and PSG Characteristics of OSA Patients
The demographic and PSG features of the three OSA severity groups are summarized in Table 1. The median patient age was 55 years. Severe OSA symptoms were more likely to occur in male patients. Demographically, we observed a difference in body mass index (BMI) between the severe OSA group and the other two groups (F (2, 72) = 5.076, P = 0.0087), which is consistent with previous reports. The AHI (NREM: F (2, 90) = 134.4, P < 0.0001; REM: F (2, 90) = 31.50, P < 0.0001), the total of apnea and hypopnea (NREM: F (2, 90) = 49.28, P < 0.0001; REM: F (2, 90) =14.71, P < 0.0001), and microarousal index during NREM and REM sleep (NREM: F (2, 90) = 12.61, P < 0.0001; REM: F (2, 90) = 5.765, P = 0.004) were significantly higher in the severe OSA group compared to the mild and moderate groups (Table 1, Figure 2D-F). The ODI index (F (2, 90) = 39.37, P < 0.0001) and SaO2<90% (F (2, 90) = 14.97, P < 0.0001) were also increased in patients with severe OSA (Table 1, Figure 2A and B). Sleep-related parameters such as time in bed, total sleep time, REM sleep latency, sleep efficiency, and WASO did not vary significantly between groups (Table 1). Moreover, except for a reduction in N2 sleep duration in patients with severe OSA (F (2, 90) = 4.876, P = 0.0098; Figure 2C), there was no change in sleep duration.
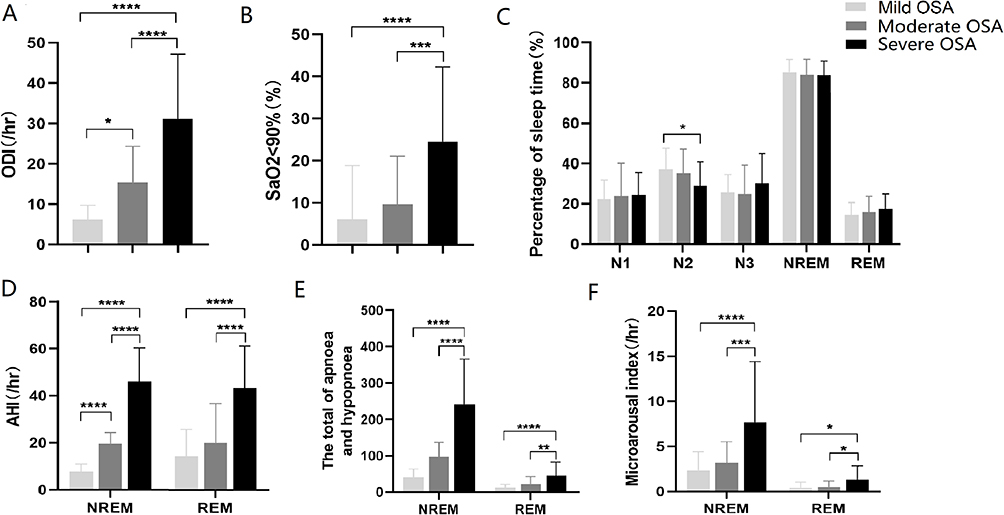 |
Figure 2 Polysomnographic characteristics in the mild OSA group, moderate OSA group, and severe OSA group. (A) The statistical results of ODI in OSA patients with different severity. (B) The SaO2<90% statistical results in OSA patients with different severity. (C) The percentage of time spent in different sleep periods. (D) The apnea hypopnea index (AHI) of OSA patients with different severity during NREM and REM periods. (E) The total sleep apnea hypopnea of OSA patients with different severity during NREM and REM periods. (F) The microarousal index of OSA patients with different severity during NREM and REM periods. Star symbols represent statistical significance levels: “****” represents p < 0.0001, “***” represents p < 0.001, “**” represents p < 0.01, “*” represents p < 0.05, no stars represent p > 0.05. |
Comparison of Spectral EEG Powers and Topographical Analysis
The absolute PSD of the five bands in the mild, moderate, and severe OSA groups are shown in Figure 3. In NREM sleep, reduced theta and alpha bands PSD were observed in the moderate and severe OSA groups compared to the mild group except for the N2 sleep phase (Figure 3B). The comparative results during N1 and N3 sleep are presented in Figure 3. In N1 sleep, reduced theta, alpha and beta band PSD was observed in the frontal region and occipital region in the moderate and severe OSA group compared to the mild group (theta: F3: F (2, 89) = 30.697, P = 0.032; F4: F (2, 89) = 30.793, P = 0.026; O1: F (2, 89) = 288.602, P = 0.003; alpha: O1: F (2, 89) = 201.349, P=0.005; beta: F3: F (2, 89) = 70.368, P = 0.014, Figure 3A). In N3 sleep, theta (F3: F (2, 88) = 23.043, P = 0.042; O1: F (2, 88) = 20.541, P = 0.046; O2: F (2, 88) = 459.514, P = 0.002) and alpha bands PSD (O1: F (2, 88) = 35.358, P = 0.028, O2: F (2, 88) = 93.35, P = 0.011, Figure 3C) in the frontal and occipital region were significantly decreased in the severe OSA group compared to the mild and moderate groups. During the wake period, we also observed a same trend in alpha power over the frontal and occipital regions in the moderate and severe OSA group (F3: F (2, 90) = 21.952, P = 0.044; O1: F (2, 90) = 19.408, P = 0.049, Figure 3D). PSD in the REM sleep have no different changes in the three groups and data did not show here. Figure 4 shows the topographic distribution of the absolute EEG power in the five frequency bands for the three OSA groups. By analyzing the EEG power spectral density in the N1, N2, N3, REM sleep and wake stages of OSA patients with different disease severities, combined with the results of hypoxic events in the PSG, we found that both changes in brain activity and hypoxic events in OSA patients mainly occurred during the NREM phase, suggesting a possible causal relationship between them.
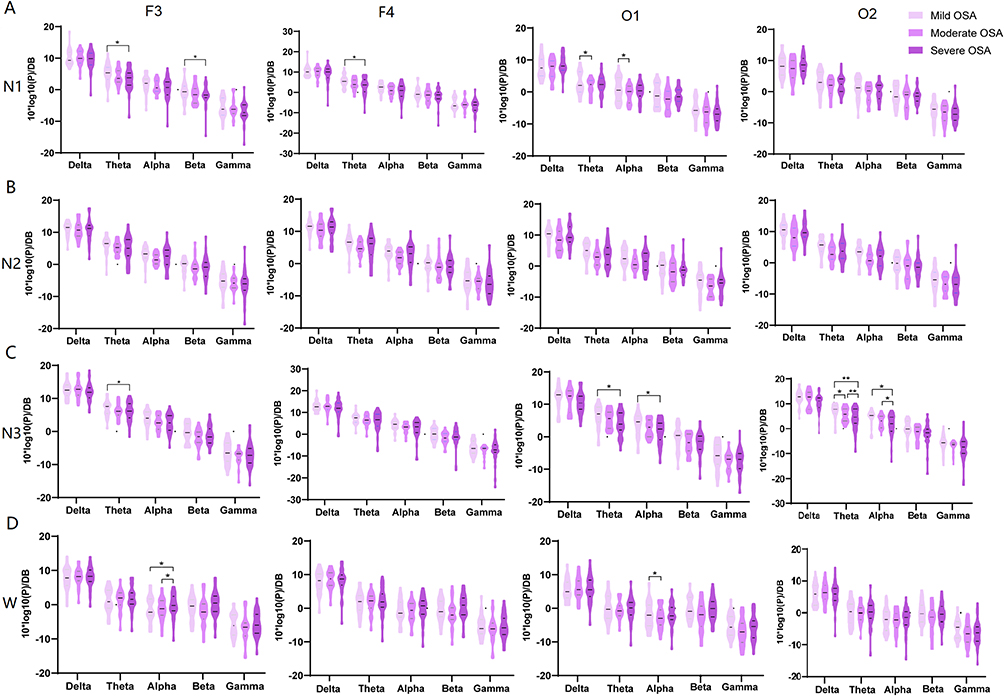 |
Figure 3 Comparisons of the absolute power spectral densities (PSD) in the mild OSA group, moderate OSA group, and severe OSA group during the whole sleep stages. The PSD of F3/F4 and O1/O2 channels in five frequency bands in OSA patients during N1 (A), N2(B), N3 sleep (C) and wakefulness (D). Star symbols represent statistical significance levels: “**” represents p < 0.01, “*” represents p < 0.05, no stars represent p > 0.05. |
 |
Figure 4 The topographic map results in the mild OSA group, moderate OSA group, and severe OSA group in each frequency band during N1, N2, N3 and wakefulness. |
Correlation Analysis Among PSD, OSA Symptom Severity, and Serum Indexes
The AHI showed a negative correlation with the theta band power of F3/4 channels in N1 sleep (AHI, F3 channel: r = −0.3168, P = 0.0021; F4 channel: r = −0.2770, P = 0.0075; Figure 5A and B). The theta PSD of F3/4 channels in N1 sleep showed a negative correlation with ODI and SaO2<90% (ODI, F3 channel: r = −0.2712, P = 0.0089, F4 channel: r = −0.2623, P = 0.0115; SaO2<90%, F3 channel: r = −0.2757, P = 0.0078) (Figure 5C-E). Correspondingly, the theta PSD in the N3 sleep of O1/2 channels demonstrated a similar pattern to that of AHI Figure 5F and G). The microarousal index (MAI) showed a negative correlation with theta PSD in the N3 sleep of O1/O2 channels (Figure 5H and I). The beta band power during N1 sleep had no relationship with OSA-related indices. Figure 6 presents Pearson correlation coefficients, indicating negatively correlation between AHI with theta PSD in N1/3 sleep. Additionally, ODI and SaO2<90% was negatively correlated with theta PSD in N1 sleep. Furthermore, it is interesting to note that MAI demonstrates negative correlation with theta PSD in N3 sleep but not in N1 sleep. These results suggest that severe OSA may alter the microstructure of the brain and may damage the central nervous system. Other power spectrum correlation analysis results were in the Supplementary Table.
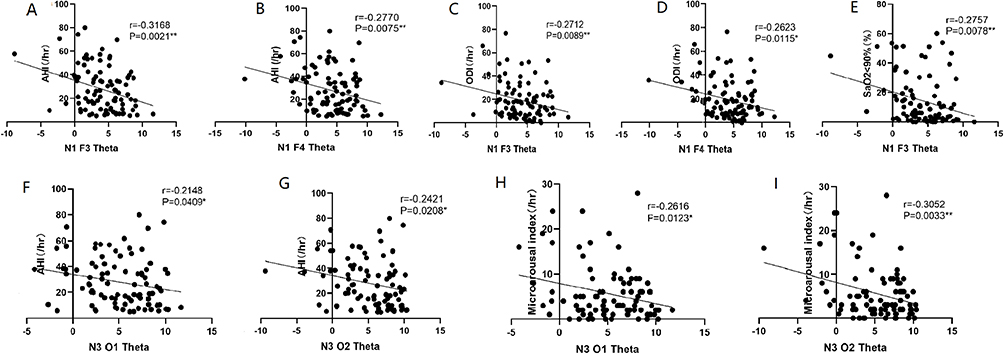 |
Figure 5 Correlation analysis between theta band power spectral density (PSD) in NREM sleep and severity of OSA symptom. The theta band power of F3/4 channels in N1 sleep was shown negatively correlated with AHI (A and B) (F3 channel: r=−0.3168, P=0.0021, F4 channel: r=−0.2770, P=0.0075), AHI during NREM (F3 channel: r=−0.3346, P=0.0011, F4 channel: r=−0.2962, P=0.0041), ODI (C and D) (F3 channel: r=−0.2712, P=0.0089, F4 channel: r=−0.2623, P=0.0115), SaO2<90% (E) (F3 channel: r=−0.2757, P=0.0078). The theta PSD of O1/2 channels in N3 sleep was negatively correlated with AHI (F and G) (O1 channel: r=−0.2138, P=0.0419; O2 channel: r=0.2421, P=0.0208) and Microarousal index (H and I) (O1 channel: r=−0.2616, P=0.0123, O2 channel: r=−0.3052, P=0.0033). |
 |
Figure 6 Matrix of Pearson’s correlation coefficients among demographics, power spectral density, OSA symptom severity and serum indexes. A color-coded correlation scale is presented on the right of the plot. Based upon the scale, blue ones stand for negative correlations and red ellipses stand for positive correlations, ns illustrate insignificant correlations of a given variable with itself. Star symbols represent statistical significance levels: “***” represents p < 0.001, “**” represents p < 0.01, “*” represents p < 0.05, no stars represent p > 0.05. Abbreviation: MAI, Microarousal index. |
In addition, we found that S100β had positive correlations with AHI (Figure 6, r = 0.401, P = 0.018), MAI (Figure 6, r = 0.453, P = 0.007) and WASO (Supplementary table, r = 0.449, P = 0.008), but negative correlations with theta power in the N1 stage (Figure 6, F3: r = −0.424, P = 0.013) and sleep efficiency (Supplementary table, r = −0.368, P = 0.032). Uric acid was negatively correlated with age (data did not shown), but had no significant correlation with the PSD of each of the five frequency bands (Figure 6).
Discussion
This study aimed to analyze the power spectrum of PSG EEG and its correlation with PSG parameters and serum markers in patients with OSA of varying degrees of severity. We initially assessed whether OSA could alter sleep architecture patterns. Except for a decrease in the duration of N2 sleep and an increase in the microarousal index, there were no significant differences in sleep architecture based on disease severity, although hypoxic events were observed throughout the sleep stages and were more prevalent in the NREM phase. In addition, we demonstrated that NREM theta and alpha powers over the frontal and occipital regions in N1 and N3 sleep were lower in the moderate and severe OSA groups compared to the mild OSA group. Also, a lower NREM theta power band was negatively correlated with the severity of OSA symptoms. This suggests that EEG oscillations may be a potential index or biomarker of OSA severity.
In a retrospective study, elevated S100b and uric acid levels were associated with OSA severity. However, no correlation was found between EEG PSD and these serum markers. Therefore, we aimed to analyze the relationship between the power spectrum and serum markers in patients with varying degrees of OSA severity. Indeed, our findings indicated a relationship between S100β and OSA. Instead, uric acid levels did not differ significantly among the three OSA groups, suggesting that uric acid may not be a sensitive indicator of OSA severity.
Little Group Differences in Sleep Architecture
Different PSG-derived OSA diagnostic modalities have been used for several years. Patients with OSA may experience most of their respiratory events during either REM or NREM sleep. Often, OSA is more severe during REM sleep than during NREM sleep; however, the underlying mechanisms remain unclear. Moreover, previous studies have found that REM-predominant OSA and NREM-predominant OSA have different physiological conditions based on common polysomnographic patterns,18,35–39 and a marked reduction in OSA severity in slow-wave sleep. In this study, we investigated the evolution of respiration-related hypoxia during the entire sleep period. Our findings on sleep architecture in patients with OSA showed that the AHI, ODI, and SaO2<90% in the moderate and severe OSA groups were significantly higher than those in the mild OSA group. NREM sleep and slow-wave sleep are considered to be closely associated with cognition and memory. Therefore, chronic hypoxia occurring mainly in the NREM/N3 phase may cause cognitive impairment in patients with OSA. Based on our findings, it is possible to better assist clinical staff in predicting and preventing cognitive impairment in OSA patients through improved evaluation and treatment of hypoxia during N3 sleep. For example, administering high-flow oxygen during N3 sleep may help prevent or mitigate cognitive impairment. The disruption of sleep structure in individuals with OSA has been extensively studied and documented. Previous research has shown significant alterations in sleep architecture, particularly in individuals over the age of 40 with chronic insomnia. These alterations often include a reduction in slow-wave (N3) and REM sleep, alongside an increase in light sleep (N1) and frequent awakenings during the night.20,40 However, it is worth noting that some studies focusing on male patients with OSA have found no significant differences in PSG parameters such as sleep efficiency, sleep latency, and REM sleep, except for higher duration in N1 and lower duration in N3.18 Recently, a study conducted by Wulterkens et al has revealed notable differences in the sleep structure of patients with comorbid insomnia and sleep apnea (COMISA) compared to patients with OSA and insomnia.41 In our study, we found no significant differences in sleep structure between patients with mild, moderate, and severe OSA, aside from the duration of N2 sleep and microarousal index. However, it is important to acknowledge that these discrepant results regarding sleep macrostructure may be influenced by factors such as inadequate statistical power and variations in the subjects being studied.
Reduced NREM Theta and Alpha Power in OSA Patients
In this study, we found that compared to the mild OSA group, the theta and alpha band PSD in the frontal and occipital regions during NREM sleep and wakefulness were significantly decreased in the moderate and severe OSA groups. Several alterations in resting-state EEG spectral domains have been identified in OSA, which could be reflected in specific EEG biomarkers of the brain. However, previous EEG studies of OSA have yielded inconsistent results. Chronic intermittent hypoxia during sleep results in several alterations in resting-state EEG spectral domains, which could reflect various brain activities in real time. Jiang et al found that in a cohort of patients with OSA, the quantitative EEG power of the beta band was higher than that in the non-OSA group, and the delta power spectrum was lower.20 However, another study on OSA came to a different conclusion, reporting that in the severe OSA group low-frequency delta power was increased, and other bands were decreased in both NREM and REM sleep.18 A topographic analysis of high-density EEG data revealed a broadband reduction in EEG power in OSA subjects.17 These discrepant results in EEG data are likely due to differences in the methodology and patients employed across studies.
Few studies have analyzed the pattern of changes in EEG frequencies during the entire sleep period (NREM, REM, and wakefulness) in patients with different levels of apnea severity. By analyzing the EEG PSD in the N1, N2, and N3 sleep stages, we identified same results in theta and alpha powers, specifically in the frontal and occipital areas during N1 sleep. During N1 sleep, which is characterized as a transitional stage from wakefulness to sleep, a decrease in theta power was observed in the frontal region. Theta oscillations (4–7 Hz) are commonly associated with relaxed mental states and meditation.42 Additionally, the frontal cortex is involved in various cognitive processes, including attention, working memory, and decision making. Thus, the decrease in theta power in the frontal area during N1 sleep may reflect a reduction in cognitive processing and the initiation of sleep-related processes. This may indicate that in patients with OSA, there are abnormal changes in frontal lobe neural activity during the transition from wakefulness to sleep. Our findings indicate potential neurophysiological changes or underlying mechanisms associated with sleep fragmentation in patients with OSA. This provides valuable insights for further evaluating sleep quality and exploring potential treatment options. For example, transcranial magnetic stimulation (TMS) targeting the frontal theta waves emerges as a promising physical therapy for future interventions.
Our study showed a decrease in both theta and alpha powers in the frontal and occipital area during N3 sleep. Occipital theta/alpha oscillations (4–13 Hz) are associated with visual processing and attention. This reduction in the visual area may reflect a downregulation of sensory input, further indicating a shift towards deeper sleep stages characterized by reduced responsiveness to external stimuli. Moreover, sleep-related processes such as memory consolidation, synaptic pruning, and neural regeneration may contribute to the stage-specific modulation of theta and alpha/spindle power. One possible explanation for this difference in stage-specific distribution may be related to the synchronization of neural networks. Different cortical regions may exhibit varying degrees of synchronization during specific sleep stages, resulting in differences in EEG power distribution. Another potential explanation could be the generation and modulation of neurotransmitters that play a role in sleep regulation. Changes in theta power distribution during sleep stages can be influenced by neurotransmitter release and receptor activity.43 Future studies investigating the specific contributions of neurotransmitters such as serotonin, acetylcholine, and norepinephrine may provide insights into these stage-specific distribution differences.
OSA is Negatively Associated with Reduced NREM Theta Power
It is not known whether the sleep periods of severe hypoxia are accompanied by differences in electrical activity. Therefore, we further analyzed the correlation between brain electrical activity and hypoxic events during different sleep stages.
We found that reduced theta band PSD in N1, and N3 were negatively correlated with AHI, ODI and microarousal index, indicating that abnormal EEG activity in the frontal and occipital regions may be a potential indicator of OSA severity. Moreover, decreased theta and alpha bands EEG activity during NREM sleep may also reflect an increased OSA severity. Our findings provide objective neurophysiological evidence of pathological cortical activity during NREM sleep that may be associated with different levels of OSA severity.
OSA is closely associated with the development of several cardiovascular and metabolic diseases, including hypertension, diabetes, and obesity. In addition, untreated OSA leads to neurobehavioral dysfunctions such as cognitive impairment and daytime sleepiness, to which EEG activity is related.44 Reduced theta activity during NREM sleep in healthy subjects predicts sleepiness, while reductions in sleep spindle density and sigma band power in older adults are related to the weakening of learning and memory processes during aging.45 Although the mechanisms underlying the slowing of sleep EEG activity in patients with OSA are unclear, imaging and EEG studies have shown that hypercapnia results in altered brain activity and in a reduction in functional connectivity magnetic resonance imaging indices.46 Thus, further investigation into the relationship and mechanisms between EEG spectral power and sleep apnea symptoms in OSA is necessary.
Limitations
Our study has several limitations that should be acknowledged. First, it relied on a relatively small sample size of 93 participants, which may have led to an increased likelihood of type two statistical errors. However, there was little difference in sample size among the three OSA groups, and the obtained results were significant (Table 1, Figure 3). In the future, we plan to collaborate with other clinical centers to include more patients and further improve our study.
Owing to limitations associated with our collection equipment and technology, we could only use frontal and occipital EEG electrodes, which may fail to detect more regional brain activity in detail. Multichannel EEG recordings may provide more spatial information and more accurate topographical maps. Therefore, future studies employing high-density EEG recordings are required.
It is also important to recognize that this study only demonstrated associations between sleep-breathing conditions and PSG parameters with EEG PSD, and these data do not prove causality. However, EEG oscillations have been used as an important indicator to assess brain activity. Previous studies have shown that sleep EEG abnormalities and cognitive performance in OSA were reversible after 6 months of continuous positive airway pressure treatment.12,14,33,47–49 Thus, the decrease in PSD observed in our study may have been caused by brain tissue damage due to chronic hypoxia. Designing interventions that directly target EEG biomarkers associated with OSA and/or specific symptom dimensions to improve clinical outcomes is a promising approach.
Furthermore, it is important to consider the potential changes in PSD throughout the night, as sleep organization and the brain circuits involved vary from the initial sleep cycles to the later sleep periods. For example, Heinzer et al showed that N3 power in patients with OSA was decreased in the first and second NREM episodes and positively correlated with sleep latency in the multiple sleep latency test.41 Further research in this area may provide valuable insights into the dynamics of sleep and its impact on brain activity.
Conclusion
In summary, hypoxic events were observed throughout the sleep stages in patients with OSA. Except for a decrease in the duration of N2 sleep and an increase in the microarousal index, there were no significant differences in sleep architecture based on disease severity. Reduced frontal and occipital theta band power during NREM sleep correlated closely with the degree of hypoxia in patients with OSA, may reflect pathological cortical activation, and could be a potential neurophysiological predictor of disease severity in patients with OSA.
Data Sharing Statement
The data on which this manuscript are open to researchers upon appropriate request.
Acknowledgments
Chan Zhang and Yanhui Wang are co-first authors for this study. This work was supported by National Natural Science Foundation of China (NSFC 81801110 and NSFC 82000850) and Medical Science and Technology project of Henan Province (SBGJ 202002060and SBGJ 202101016).
Disclosure
The authors report no conflicts of interest for this work.
References
1. Levy P, Kohler M, McNicholas WT, et al. Obstructive sleep apnoea syndrome. Nat Rev Dis Primers. 2015;1:15015. doi:10.1038/nrdp.2015.15
2. Jordan AS, McSharry DG, Malhotra A. Adult obstructive sleep apnoea. Lancet. 2014;383(9918):736–747. doi:10.1016/S0140-6736(13)60734-5
3. Wan XY, Zhao WR, Wu XR, Chen XY, Lei X. The brain imaging studies of obstructive sleep apnea: evidence from resting-state EEG and fMRI. Sheng Li Xue Bao. 2019;71(5):760–768.
4. Puskas S, Kozak N, Sulina D, Csiba L, Magyar MT. Quantitative EEG in obstructive sleep apnea syndrome: a review of the literature. Rev Neurosci. 2017;28(3):265–270. doi:10.1515/revneuro-2016-0064
5. Zhang F, Wu X, Duan W, Wang F, Huang T, Xiang M. Influencing factors of daytime sleepiness in patients with obstructive sleep apnea hypopnea syndrome and its correlation with pulse oxygen decline rate. Evid Based Complement Alternat Med. 2021;2021:6345734. doi:10.1155/2021/6345734
6. Guilleminault C, Do Kim Y, Chowdhuri S, Horita M, Ohayon M, Kushida C. Sleep and daytime sleepiness in upper airway resistance syndrome compared to obstructive sleep apnoea syndrome. Eur Respir J. 2001;17(5):838–847. doi:10.1183/09031936.01.17508380
7. Maspero C, Giannini L, Galbiati G, Rosso G, Farronato G. Obstructive sleep apnea syndrome: a literature review. Minerva Stomatol. 2015;64(2):97–109.
8. D’Rozario AL, Cross NE, Vakulin A, et al. Quantitative electroencephalogram measures in adult obstructive sleep apnea - Potential biomarkers of neurobehavioural functioning. Sleep Med Rev. 2017;36:29–42. doi:10.1016/j.smrv.2016.10.003
9. Gottlieb DJ, Punjabi NM. Diagnosis and management of obstructive sleep apnea: a review. JAMA. 2020;323(14):1389–1400. doi:10.1001/jama.2020.3514
10. Harper RM, Kumar R, Ogren JA, Macey PM. Sleep-disordered breathing: effects on brain structure and function. Respir Physiol Neurobiol. 2013;188(3):383–391. doi:10.1016/j.resp.2013.04.021
11. Duan W, Liu X, Ping L, et al. Distinct functional brain abnormalities in insomnia disorder and obstructive sleep apnea. Eur Arch Psychiatry Clin Neurosci. 2022;273(2):493–509. doi:10.1007/s00406-022-01485-7
12. Xiromeritis AG, Hatziefthimiou AA, Hadjigeorgiou GM, Gourgoulianis KI, Anagnostopo Ulou DN, Angelopoulos NV. Quantitative spectral analysis of vigilance EEG in patients with obstructive sleep apnoea syndrome: EEG mapping in OSAS patients. Sleep Breath. 2011;15(1):121–128. doi:10.1007/s11325-010-0335-6
13. Saunamaki T, Jehkonen M, Huupponen E, Polo O, Himanen SL. Visual dysfunction and computational sleep depth changes in obstructive sleep apnea syndrome. Clin EEG Neurosci. 2009;40(3):162–167. doi:10.1177/155005940904000308
14. Wang G, Goebel JR, Li C, Hallman HG, Gilford TM, Li W. Therapeutic effects of CPAP on cognitive impairments associated with OSA. J Neurol. 2020;267(10):2823–2828. doi:10.1007/s00415-019-09381-2
15. Vanek J, Prasko J, Genzor S, et al. Obstructive sleep apnea, depression and cognitive impairment. Sleep Med. 2020;72:50–58. doi:10.1016/j.sleep.2020.03.017
16. Quan SF, Chan CS, Dement WC, et al. The association between obstructive sleep apnea and neurocognitive performance--The Apnea Positive Pressure Long-term Efficacy Study (APPLES). Sleep. 2011;34(3):303–314B. doi:10.1093/sleep/34.3.303
17. Jones SG, Riedner BA, Smith RF, et al. Regional reductions in sleep electroencep halography power in obstructive sleep apnea: a high-density EEG study. Sleep. 2014;37(2):399–407. doi:10.5665/sleep.3424
18. Liu S, Shen J, Li Y, et al. EEG power spectral analysis of abnormal cortical activations during REM/NREM sleep in obstructive sleep apnea. Front Neurol. 2021;12:643855. doi:10.3389/fneur.2021.643855
19. Morisson F, Decary A, Petit D, Lavigne G, Malo J, Montplaisir J. Daytime sleepiness and EEG spectral analysis in apneic patients before and after treatment with continuous positive airway pressure. Chest. 2001;119(1):45–52. doi:10.1378/chest.119.1.45
20. Kang JM, Cho SE, Na KS, Kang SG. Spectral power analysis of sleep electroencephalograph y in subjects with different severities of obstructive sleep apnea and healthy controls. Nat Sci Sleep. 2021;13:477–486. doi:10.2147/NSS.S295742
21. Kang JM, Kim ST, Mariani S, et al. Difference in spectral power density of sleep EEG between patients with simple snoring and those with obstructive sleep apnoea. Sci Rep. 2020;10(1):6135. doi:10.1038/s41598-020-62915-x
22. Angelo MF, Aguirre A, Aviles Reyes RX, et al. The proinflammatory RAGE/NF-kappaB pathway is involved in neuronal damage and reactive gliosis in a model of sleep apnea by intermittent hypoxia. PLoS One. 2014;9(9):e107901. doi:10.1371/journal.pone.0107901
23. Langeh U, Singh S. Targeting S100B protein as a surrogate biomarker and its role in various neurological disorders. Curr Neuropharmacol. 2021;19(2):265–277. doi:10.2174/18756190MTA44NjEs3
24. Rezaei F, Abbasi H, Sadeghi M, Imani MM. The effect of obstructive sleep apnea syndrome on serum S100B and NSE levels: a systematic review and meta-analysis of observational studies. BMC Pulm Med. 2020;20(1):31. doi:10.1186/s12890-020-1063-8
25. Demirci Saglam G, Zamani A, Yosunkaya S, Kilinc I. Serum S100A12 and S100B proteins are independent predictors of the presence and severity of obstructive sleep apnea. Turk J Med Sci. 2019;49(3):746–754. doi:10.3906/sag-1806-147
26. Zhang B, Yang N, Lin SP, Zhang F. Suitable concentrations of uric acid can reduce cell death in models of OGD and cerebral ischemia-reperfusion injury. Cell Mol Neurobiol. 2017;37(5):931–939. doi:10.1007/s10571-016-0430-8
27. Sunnetcioglu A, Gunbatar H, Yildiz H. Red cell distribution width and uric acid in patients with obstructive sleep apnea. Clin Respir J. 2018;12(3):1046–1052. doi:10.1111/crj.12626
28. Mikami T, Sorimachi M. Uric acid contributes greatly to hepatic antioxidant capacity besides protein. Physiol Res. 2017;66(6):1001–1007. doi:10.33549/physiolres.933555
29. Aerqin Q, Jia SS, Shen XN, et al. Serum uric acid levels in neurodegenerative disorders: a cross-sectional study. J Alzheimers Dis. 2022;90(2):761–773. doi:10.3233/JAD-220432
30. Llull L, Amaro S, Chamorro A. Administration of uric acid in the emergency treatment of acute ischemic stroke. Curr Neurol Neurosci Rep. 2016;16(1):4. doi:10.1007/s11910-015-0604-7
31. Mijailovic NR, Vesic K, Borovcanin MM. The influence of serum uric acid on the brain and cognitive dysfunction. Front Psychiatry. 2022;13:828476. doi:10.3389/fpsyt.2022.828476
32. Gerstenslager B, Slowik JM. Sleep study. Statpearls, Treasure Island. 2022.
33. Wang J, Xu J, Liu S, et al. Electroencephalographic activity and cognitive function in middle-aged patients with obstructive sleep apnea before and after continuous positive airway pressure treatment. Nat Sci Sleep. 2021;13:1495–1506. doi:10.2147/NSS.S322426
34. Chen L, Hu X, Wu H, et al. Over-expression of S100B protein as a serum marker of brain metastasis in non-small cell lung cancer and its prognostic value. Pathol Res Pract. 2019;215(3):427–432. doi:10.1016/j.prp.2018.11.011
35. Joosten SA, Landry SA, Wong AM, et al. Assessing the physiologic endotypes responsible for REM- and NREM-based OSA. Chest. 2021;159(5):1998–2007. doi:10.1016/j.chest.2020.10.080
36. Rissanen M, Oksenberg A, Toyras J, Myllymaa S, Leppanen T. Total durations of respiratory events are modulated within REM and NREM sleep by sleeping position and obesity in OSA patients. Sleep Med. 2021;81:394–400. doi:10.1016/j.sleep.2021.02.020
37. Al Oweidat K, AlRyalat SA, Al-Essa M, Obeidat N. Comparing REM- and NREM-related obstructive sleep apnea in Jordan: a cross-sectional study. Can Respir J. 2018;2018:9270329. doi:10.1155/2018/9270329
38. Akhter S, Abeyratne UR, Swarnker V. Characterizing the NREM/REM sleep specific obstructive sleep apnea severity using snore sounds. Annu Int Conf IEEE Eng Med Biol Soc. 2017;2017:2826–2829. doi:10.1109/EMBC.2017.8037445
39. Liu Y, Su C, Liu R, et al. NREM-AHI greater than REM-AHI versus REM-AHI greater than NREM-AHI in patients with obstructive sleep apnea: clinical and polysomnographic features. Sleep Breath. 2011;15(3):463–470. doi:10.1007/s11325-010-0358-z
40. Vakulin A, D’Rozario A, Kim JW, et al. Quantitative sleep EEG and polysomnographic predictors of driving simulator performance in obstructive sleep apnea. Clin Neurophysiol. 2016;127(2):1428–1435. doi:10.1016/j.clinph.2015.09.004
41. Wulterkens BM, Hermans LWA, Fonseca P, et al. Sleep structure in patients with COMISA compared to OSA and insomnia. J Clin Sleep Med. 2023;19(6):1051–1059. doi:10.5664/jcsm.10500
42. Lomas T, Ivtzan I, Fu CH. A systematic review of the neurophysiology of mindfulness on EEG oscillations. Neurosci Biobehav Rev. 2015;57:401–410. doi:10.1016/j.neubiorev.2015.09.018
43. Flint RR, Chang T, Lydic R, Baghdoyan HA. GABA(A) receptors in the pontine reticular formation of C57BL/6J mouse modulate neurochemical, electrographic, and behavioral phenotypes of wakefulness. J Neurosci. 2010;30(37):12301–12309. doi:10.1523/JNEUROSCI.1119-10.2010
44. Wichniak A, Geisler P, Brunner H, et al. Spectral composition of NREM sleep in healthy subjects with moderately increased daytime sleepiness. Clin Neurophysiol. 2003;114(8):1549–1555. doi:10.1016/S1388-2457(03)00158-5
45. Pace-Schott EF, Spencer RM. Age-related changes in the cognitive function of sleep. Prog Brain Res. 2011;191:75–89.
46. Xu F, Uh J, Brier MR, et al. The influence of carbon dioxide on brain activity and metabolism in conscious humans. J Cereb Blood Flow Metab. 2011;31(1):58–67. doi:10.1038/jcbfm.2010.153
47. D’Rozario AL, Hoyos CM, Wong KKH, et al. Improvements in cognitive function and quantitative sleep electroencephalogram in obstructive sleep apnea after six months of continuous positive airway pressure treatment. Sleep. 2022;45(6). doi:10.1093/sleep/zsac013.
48. Kylstra WA, Aaronson JA, Hofman WF, Schmand BA. Neuropsychological functioning after CPAP treatment in obstructive sleep apnea: a meta-analysis. Sleep Med Rev. 2013;17(5):341–347. doi:10.1016/j.smrv.2012.09.002
49. Heinzer R, Gaudreau H, Decary A, et al. Slow-wave activity in sleep apnea patients before and after continuous positive airway pressure treatment: contribution to daytime sleepiness. Chest. 2001;119(6):1807–1813. doi:10.1378/chest.119.6.1807
 © 2023 The Author(s). This work is published and licensed by Dove Medical Press Limited. The full terms of this license are available at https://www.dovepress.com/terms.php and incorporate the Creative Commons Attribution - Non Commercial (unported, v3.0) License.
By accessing the work you hereby accept the Terms. Non-commercial uses of the work are permitted without any further permission from Dove Medical Press Limited, provided the work is properly attributed. For permission for commercial use of this work, please see paragraphs 4.2 and 5 of our Terms.
© 2023 The Author(s). This work is published and licensed by Dove Medical Press Limited. The full terms of this license are available at https://www.dovepress.com/terms.php and incorporate the Creative Commons Attribution - Non Commercial (unported, v3.0) License.
By accessing the work you hereby accept the Terms. Non-commercial uses of the work are permitted without any further permission from Dove Medical Press Limited, provided the work is properly attributed. For permission for commercial use of this work, please see paragraphs 4.2 and 5 of our Terms.