")
Back to Journals » Clinical Epidemiology » Volume 16
Development and Validation of an Intracranial Hemorrhage Risk Score in Older Adults with Atrial Fibrillation Treated with Oral Anticoagulant
Authors Bessette LG , Singer DE , Pawar A, Wong V, Kim DH , Lin KJ
Received 2 September 2023
Accepted for publication 7 February 2024
Published 17 April 2024 Volume 2024:16 Pages 267—279
DOI https://doi.org/10.2147/CLEP.S438013
Checked for plagiarism Yes
Review by Single anonymous peer review
Peer reviewer comments 3
Editor who approved publication: Dr Laura Horsfall
Lily G Bessette,1 Daniel E Singer,2 Ajinkya Pawar,1 Vincent Wong,1 Dae Hyun Kim,1,3,* Kueiyu Joshua Lin1,2,*
1Division of Pharmacoepidemiology and Pharmacoeconomics, Department of Medicine, Brigham and Women’s Hospital, Harvard Medical School, Boston, MA, USA; 2Division of General Internal Medicine, Department of Medicine, Massachusetts General Hospital, Harvard Medical School, Boston, MA, USA; 3Marcus Institute for Aging Research, Hebrew Rehabilitation Center, Harvard Medical School, Boston, MA, USA
*These authors contributed equally to this work
Correspondence: Kueiyu Joshua Lin, Division of Pharmacoepidemiology and Pharmacoeconomics, Department of Medicine, Brigham and Women’s Hospital, Harvard Medical School, 1620 Tremont St. Suite 3030, Boston, MA, 02120, USA, Tel +1 (617) 278-0930, Fax +1 (617) 232-8602, Email [email protected]
Background: High risk of intracranial hemorrhage (ICH) is a leading reason for withholding anticoagulation in patients with atrial fibrillation (AF). We aimed to develop a claims-based ICH risk prediction model in older adults with AF initiating oral anticoagulation (OAC).
Methods: We used US Medicare claims data to identify new users of OAC aged ≥ 65 years with AF in 2010– 2017. We used regularized Cox regression to select predictors of ICH. We compared our AF ICH risk score with the HAS-BLED bleed risk and Homer fall risk scores by area under the receiver operating characteristic curve (AUC) and assessed net reclassification improvement (NRI) when predicting 1-year risk of ICH.
Results: Our study cohort comprised 840,020 patients (mean [SD] age 77.5 [7.4] years and female 52.2%) split geographically into training (3963 ICH events [0.6%] in 629,804 patients) and validation (1397 ICH events [0.7%] in 210,216 patients) sets. Our AF ICH risk score, including 50 predictors, had superior AUCs of 0.653 and 0.650 in the training and validation sets than the HAS-BLED score of 0.580 and 0.567 (p< 0.001) and the Homer score of 0.624 and 0.623 (p< 0.001). In the validation set, our AF ICH risk score reclassified 57.8%, 42.5%, and 43.9% of low, intermediate, and high-risk patients, respectively, by HAS-BLED score (NRI: 15.3%, p< 0.001). Similarly, it reclassified 0.0, 44.1, and 19.4% of low, intermediate, and high-risk patients, respectively, by the Homer score (NRI: 21.9%, p< 0.001).
Conclusion: Our novel claims-based ICH risk prediction model outperformed the standard HAS-BLED score and can inform OAC prescribing decisions.
Keywords: atrial fibrillation, anticoagulants, prediction modeling, prescriber decisions, AF
Introduction
Non-valvular Atrial fibrillation (AF) is highly prevalent in older adults (10% for those >80-years-old),1 and it is associated with a five-fold increased risk of embolic stroke.2 Anticoagulation can reduce this risk by 40–80%, but bleeding is its major complication. Clinical practice guidelines3,4 recommend that AF patients with an estimated annual stroke risk5,6 ≥2.2% receive an oral anticoagulant (OAC). Following this recommendation, a large majority of older adults with AF should receive an OAC.7–9 However, nearly 50% of these patients are not anticoagulated,10–12 with risk of falls being one of the most commonly cited reasons for withholding anticoagulation, primarily due to the fear of intracranial hemorrhage (ICH) following a fall.10,13,14
There is limited evidence allowing prediction of ICH risk, particularly due to falls, in older AF patients taking OAC. The widely used and guideline recommended HAS-BLED score generates a risk of all-cause bleeding, where extracranial events predominate.3,15 Indeed, HAS-BLED was developed on a dataset that included only 9 intracerebral hemorrhage events. As a result, it may not accurately predict risk of ICH and a dedicated ICH prediction tool is needed.15 ICH events are generally far more likely to be fatal or disabling than extracranial bleeds and there are differences in their underlying mechanism.16 Here, we report the development and validation of an ICH risk prediction model among adults aged 65 or older with non-valvular AF using a nationally representative sample of Medicare fee-for-service population. We compare our AF ICH risk prediction model’s performance with the HAS-BLED score and the Homer score, a validated fall risk tool based on routinely collected clinical.17
Methods
Study Design and Population
This retrospective cohort study using Medicare claims data was approved by the Institutional Review Board of the Brigham and Women’s Hospital, Boston, Massachusetts. Data access complied with the data protection and privacy regulations set in the Data Use Agreement with the Centers for Medicare and Medicaid Services. The study cohort consisted of Medicare beneficiaries ≥65 years old who filled a prescription for one of the 5 OACs (i.e., warfarin, dabigatran, rivaroxaban, apixaban, and edoxaban) in 2010–2017 with no OAC exposure in the past 365 days and had ≥1 inpatient or outpatient diagnosis of AF in the preceding 365 days. The date of dispensing was the cohort entry (index) date. Over the baseline period, defined as the preceding 365 days from index date, patients were required to have continuous enrollment in Medicare Part A (inpatient), B (outpatient), and D (prescription coverage) without enrollment in a Medicare Advantage Plan. We excluded those who: 1) had missing age or sex; 2) or had valvular heart disease; and 3) or had a contraindication to DOAC or warfarin therapy, in the past 365 days (Supplementary Materials Figure S1 and Table S1). This study followed the transparent reporting of a multivariable prediction model for individual prognosis or diagnosis (TRIPOD) reporting guidelines for prediction models (Supplementary Materials TRIPOD Checklist).
Ascertainment of ICH
The primary outcome was any ICH event, including intraparenchymal, sub-arachnoid, subdural hemorrhage (SDH), intraventricular, and epidural bleeds, ascertained from the primary diagnosis of inpatient care setting claims based on a validated algorithm (PPV = 89–97%, Supplementary Materials Table S2).18,19 In a sensitivity analysis, we also evaluated the model performance predicting intraparenchymal hemorrhage (IPH) and SDH, individually. Follow-up began on the index date and continued for 365 days or until the first of an ICH event, death, disenrollment or end of available data.
Measurement of Candidate Predictors and Descriptors
During the baseline period, we assessed demographic variables (age, sex, race [White, Black, Asian, Hispanic, Other/Unknown]), 34 medications captured by National Drug Codes (NDCs)20 of dispensed prescriptions, 27 comorbidities based on International Classification of Diseases, Ninth and Tenth Revision, Clinical Modification (ICD-9-CM and ICD-10-CM) codes, and 6 measures of healthcare resource utilization as candidate predictors based on potential clinical associations (Supplementary Materials Table S3). We also included 23 predictors of frailty based on Current Procedural Terminology-4 codes and Healthcare Common Procedure Coding System level II codes, such as oxygen delivery systems, walking aids, and wheelchairs, as previously defined in a published claims-based frailty prediction model.21 We assessed the CHA2DS2-VASc score over the baseline period only as a descriptor of the patient population and not as candidate predictor.5,6
Alternative Models for Comparison
Based on inpatient and outpatient claims in the baseline period, we assessed a modified HAS-BLED score (hypertension, abnormal renal/liver function, stroke, bleeding history or predisposition, elderly, drugs/alcohol concomitantly) (Supplementary Materials Table S4). Note that labile international normalized ratio (INR) was not included because such information is not available in the Medicare data and is not relevant for patients not previously treated with OACs nor for the direct anticoagulants, generally.15,22 The Homer score was assessed over the baseline period and comprised of age, sex, 36 dispensed medications captured by NDCs and categorized by the Anatomical Therapeutic Chemical Classification system,23 and diagnoses from 26 non-overlapping Clinical Classifications Software categories captured by ICD-9-CM and ICD-10-CM codes.17
Statistical Analysis
We split the study population into training and validation sets by region. Patients from non-Midwest regions (Northeast, South, West, Other/Unknown) were included in the training set and patients from the Midwest region were included in the validation set. No prior data suggest geographical region is associated with ICH risk and the geographical variations in patient demographics and local practice differences can be used to test generalizability of our models. In the training set, we used regularized regression (i.e., elastic net) with ten-fold cross-validation to select informative candidate predictors while optimizing the bias-variance trade-off by shrinkage of model coefficients.24–26 Then, we enter the selected variables in a Cox proportional hazards regression to predict 1-year risk of ICH, which accounts for both the occurrence of the outcome and time to the event. In the training and validation set, we computed the area under the ROC curve (AUC) to assess discrimination ability and Hosmer-Lemeshow goodness of fit test27 to compare the proportions of predicted and observed ICH cases by decile of predicted ICH risk. In the validation set, we compared the performance of our AF ICH risk prediction model vs. the HAS-BLED bleeding risk score and the Homer score by AUC using Delong’s test28 for 1-year risk of ICH, which accounts for correlation of evaluating AUC in the same population. We also compared performance based on clinical reclassification which allows comparison of the performance of different models in classifying patients into multiple risk groups.29 We used 0.40%, the estimated 1-year risk of ICH in the US population aged 65 years or older with AF not on OAC,7 and twice this estimate, 0.80%, to define low, intermediate, and high-risk groups. We examined the classification by HAS-BLED score and calculated the proportion of subjects who were reclassified when the new AF ICH risk model was applied. We also calculated net reclassification improvement (NRI), which measures overall improvement in risk classification among ICH cases and among non-cases, and again allows for comparison of calibration in classifying patient into clinically relevant high, intermediate, and low risk groups.30 We also repeated the reclassification and NRI calculations after recalibrating both scores by fitting univariate logistic regressions with the respective score as the only predictor of ICH in the training set. We also used the Youden Index to select a predicted probability cut-off to identify individuals unlikely to have ICH and calculate the corresponding negative predictive value.31 Analyses were conducted in R version 4.1.1 and the Aetion Evidence PlatformⓇ (2023) (including R version 3.4.2).32 All reported p-values were based on two-sided tests with a significant level of 0.05.
Sensitivity Analyses
We conducted iv sensitivity analyses. First, we assessed if adding interaction terms between demographic variables (age [≥75 vs. <75 years], sex, and race [White vs. non-hite]) and all the predictors would improve the model performance by repeating our model development process in the training set. This analysis was used to test whether the original model assumption of no interaction substantially reduced model performance or not. Second, to account for informative censoring and the competing risk of death, we built an inverse probability censoring weighting (IPCW) model by using a regularized Cox regression (elastic net) to select among 92 component factors of claims-based frailty index to predict a composite outcome of censoring due to death, disenrollment, or end of data.21 Using the IPCW model, we generated and applied censoring weights to our study cohort to create a pseudo-population in which no one was censored due to death, disenrollment, or end of data. Then, we repeated our ICH model development process in the pseudo-population to predict ICH risk. Third, to assess whether the AF ICH model is robust in predicting ICH subtypes we assessed the AF ICH model’s AUC for 1-year risk of IPH and SDH outcomes individually. Fourth, to address the recent decrease in warfarin initiation, we excluded warfarin users in the training and validation sets and re-assessed the AF ICH model, HAS-BLED score, and Homer score’s AUC for 1-year risk of ICH, IPH, and SDH. Fifth, similarly, we excluded warfarin users in the training and validation sets, repeated the ICH model development process, and evaluated the AUC for a 1-year risk of ICH.
Results
Study Cohort
The study cohort was comprised of 629,804 individuals (mean age 77.5 [SD 7.4], 51.8 female) in the training set and 210,216 individuals (mean age 7.4 [SD 9.0], 53.3 female) in the testing set (Figure 1). The mean CHA2DS2-VASc and HAS-BLED score was 4.7 [SD 1.8] and 2.3 [SD 0.8] in the training and 4.7 [SD 1.7] and 2.3 [SD 0.7] in the validation set, respectively (Table 1). There were 3963 ICH events in the training set and 1397 ICH events in the validation set. The corresponding ICH event rate was 7.5 per 1000 person years and 7.9 per 1000 person years, respectively. This included IPH rates of 2.51 and 2.46 per 1000 person years for the 1331 and 434 IPH events in the training and validation sets, respectively, and SDH rates of 3.11 and 3.41 per 1000 person years for the 1648 and 603 SDH events in the training and validation sets, respectively. Over the course of follow-up, 76,729 (9.1%) patients died, 26,599 (3.2%) disenrolled, 146,355 (17.4%) reached the end of available data before 365 days of follow-up, 584,977 (69.6%) survived the 365-day follow-up period without an ICH event, and 5360 (0.6%) experienced an ICH event.
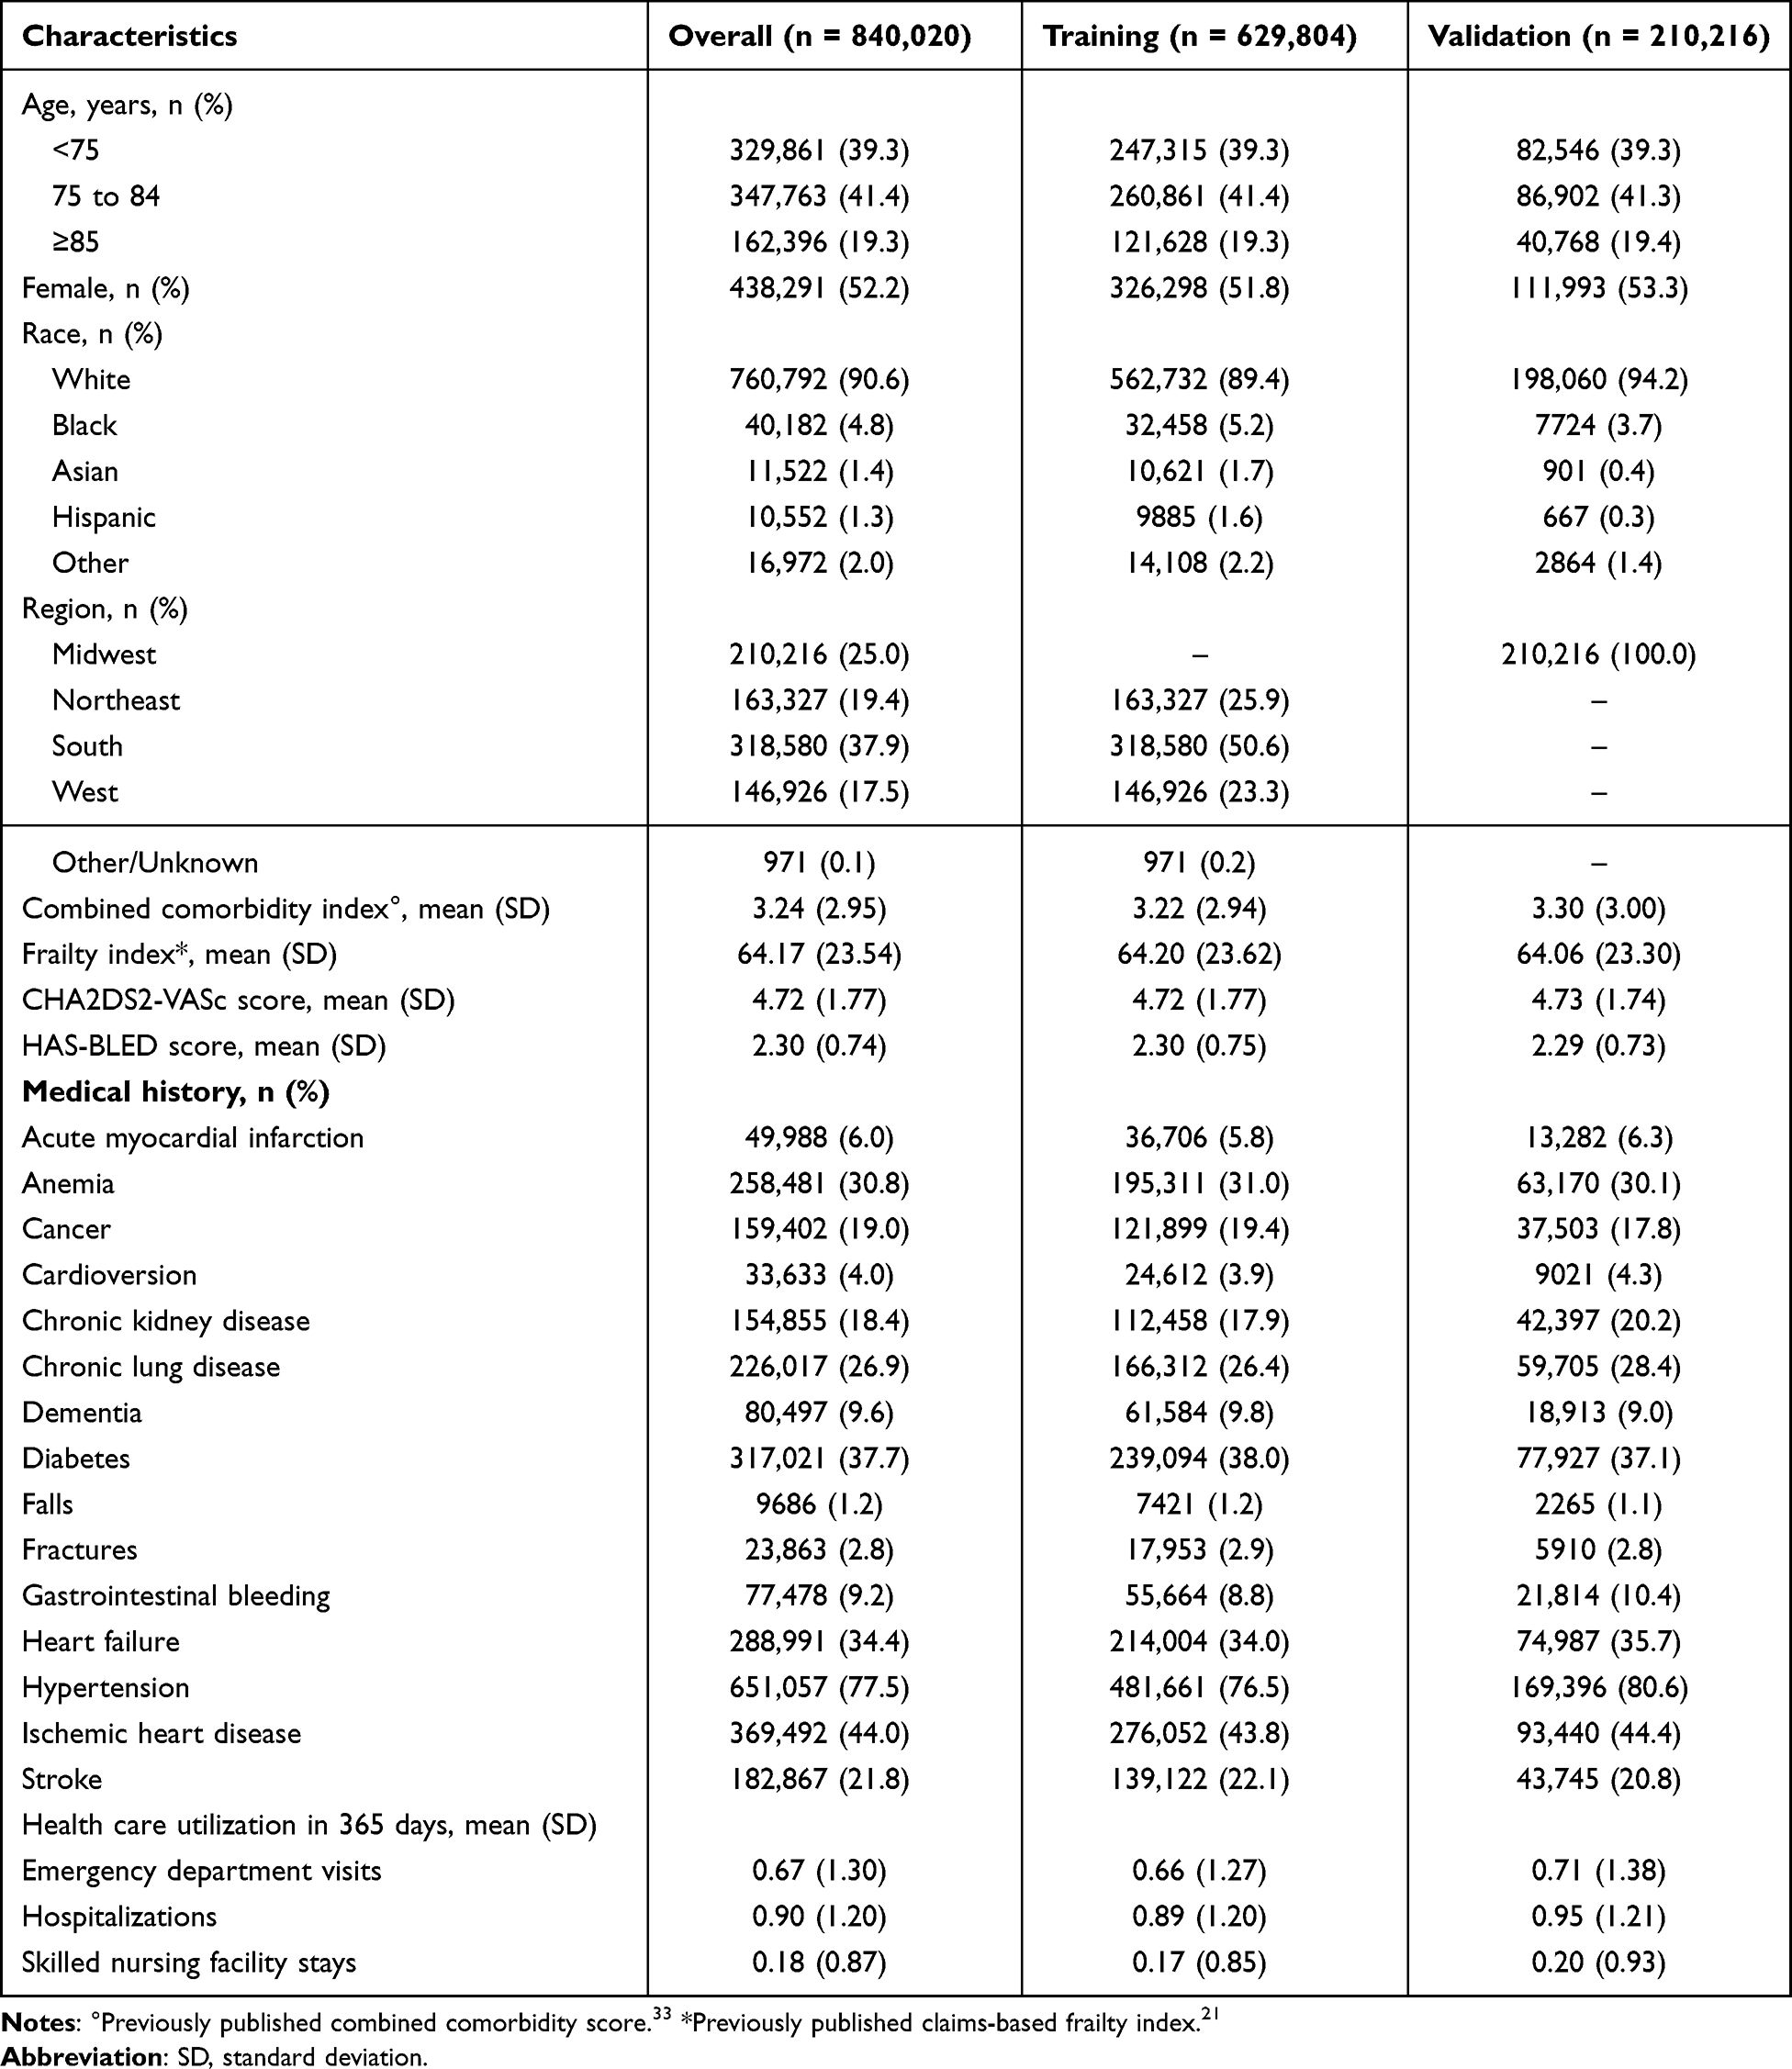 |
Table 1 Selected Characteristics of the Study Population |
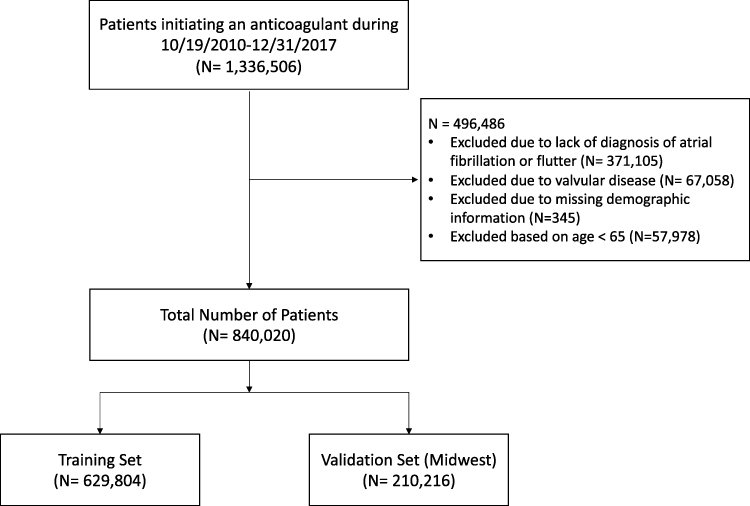 |
Figure 1 Study cohort attrition chart. |
Development of the AF ICH Risk Model
Among 93 candidate predictors, regularized Cox regression with ten-fold cross-validation selected the demographic variables (age, sex, race), 5 healthcare resource utilization variables, 7 frailty-related predictors, 16 comorbidities, and 10 dispensed prescription medications (Table 2). The AUC of the AF ICH risk model predicting 1-year risk of ICH was 0.653 95% CI (0.645, 0.661) in the training set and 0.647 95% CI (0.633, 0.661) in the validation set. In the first nine deciles of predicted ICH risk, the difference in the proportion of predicted ICH cases and observed ICH cases was less than 0.17 in the training set and 0.11 in the validation set. In the tenth decile of predicted ICH risk, the difference was 0.56 in the training and 0.49 in the validation set (Figure 2).
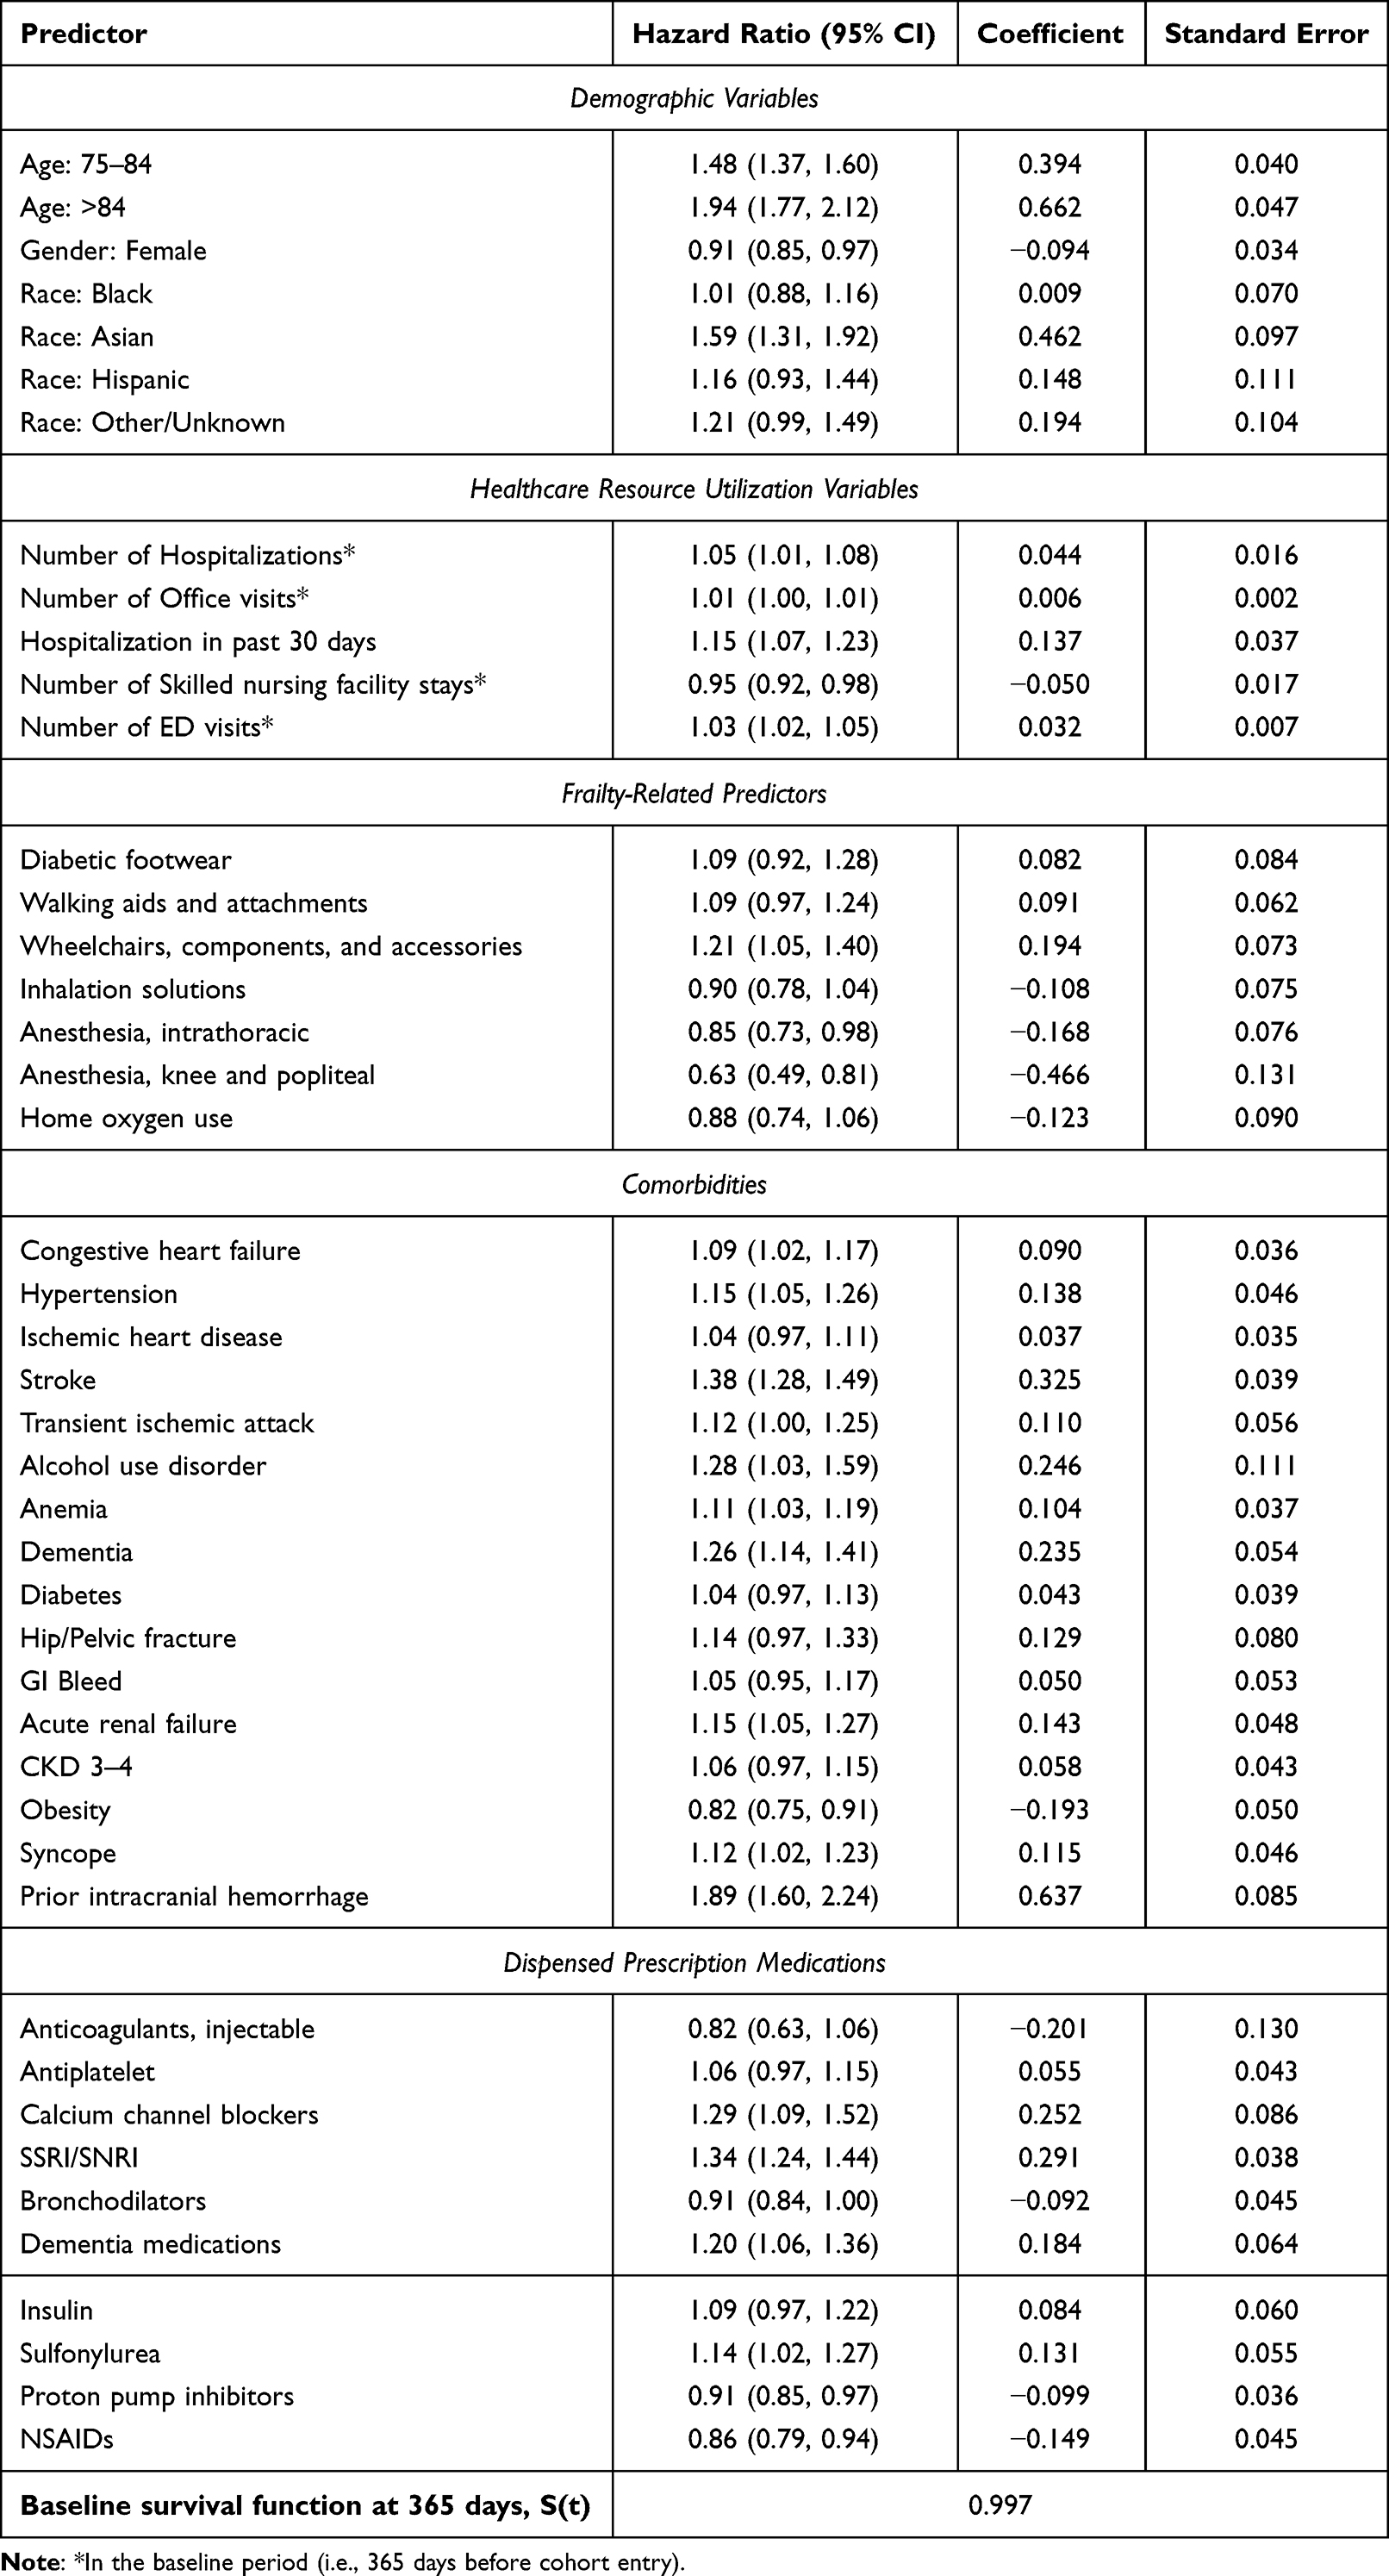 |
Table 2 Prediction Model for the Risk of 1-Year Risk of Intracranial Bleeding |
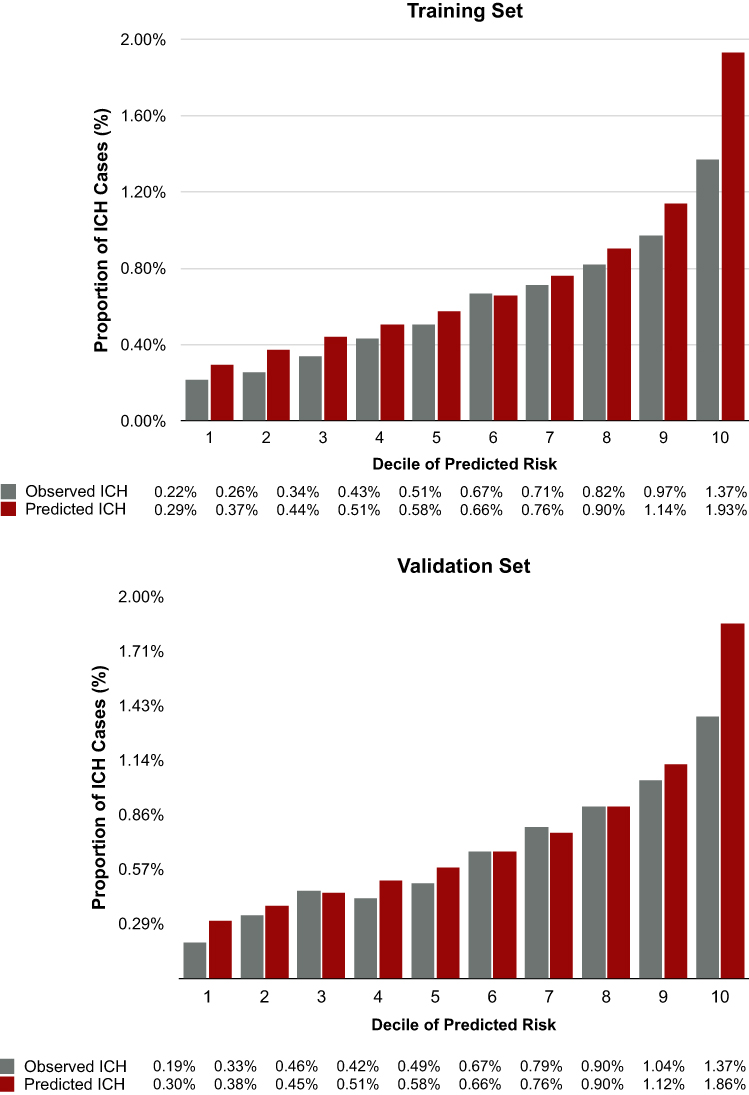 |
Figure 2 Observed vs. predicted ICH events based on AF ICH risk model. Abbreviations: ICH, intracranial hemorrhage; AF, atrial fibrillation. Note: Chi-squared values based on the Hosmer-Lemeshow test were 190.1 (p<0.001) in the training set and 46.4 (p<0.001) in the validation set. |
Comparison of AF ICH Risk Model, HAS-BLED and Homer Scores
In the validation set, the AUC of the AF ICH risk model predicting 1-year risk of ICH was substantially superior to that of the HAS-BLED score (0.647 vs. 0.567, p<0.001) and moderately superior to that of the Homer score (0.647 vs. 0.623, p<0.001) (Figure 3). In the training and validation set, respectively, the Hosmer-Lemeshow goodness of fit test yielded a chi-squared of 190.10 and 46.41 for the AF ICH risk model, <0.01 and 9.18 for the recalibrated HAS-BLED score, and 192.27 and 51.47 for the recalibrated Homer score. Without recalibration, the chi-square values of the Hosmer Lemeshow goodness of fit test of the training and validation set were 7,947,912 and 2,592,514 in the HAS-BLED score and 162,701 and 54,831 in the Homer score. P-values for all Hosmer-Lemeshow goodness of fit tests were all <0.001, except for the recalibrated HAS-BLED score with p-values of 1.00 and 0.33 in the training and validation set, respectively. In the validation set, our AF ICH risk score reclassified 57.8%, 42.5%, and 43.9% for HAS-BLED score and 0.0%, 44.1%, and 19.4% for the Homer score of low, intermediate, and high-risk patients with an NRI of 15.3% (12.0%, 18.8%) and 21.9% (18.4%, 25.1%), respectively (P<0.001) (Table 3). Using our prespecified low-risk group (predicted ICH risk = 0.4%) as the cut-off to prescribe OAC, only 0.28% of the patients developed ICH within one year after the cohort entry. We observed similar findings in the training set (Supplementary Materials Table S5). Using a predicted probability cut-off of 0.566% based on the Youden Index, our model had a negative predictive value of 99.7% in both the training and validation sets. At the cut-off based on the Youden Index, our model yielded a sensitivity of 77.8% and 77.9%, specificity of 44.0% and 43.0%, and positive predictive value of 0.9% and 0.9% in the training and validation sets, respectively.
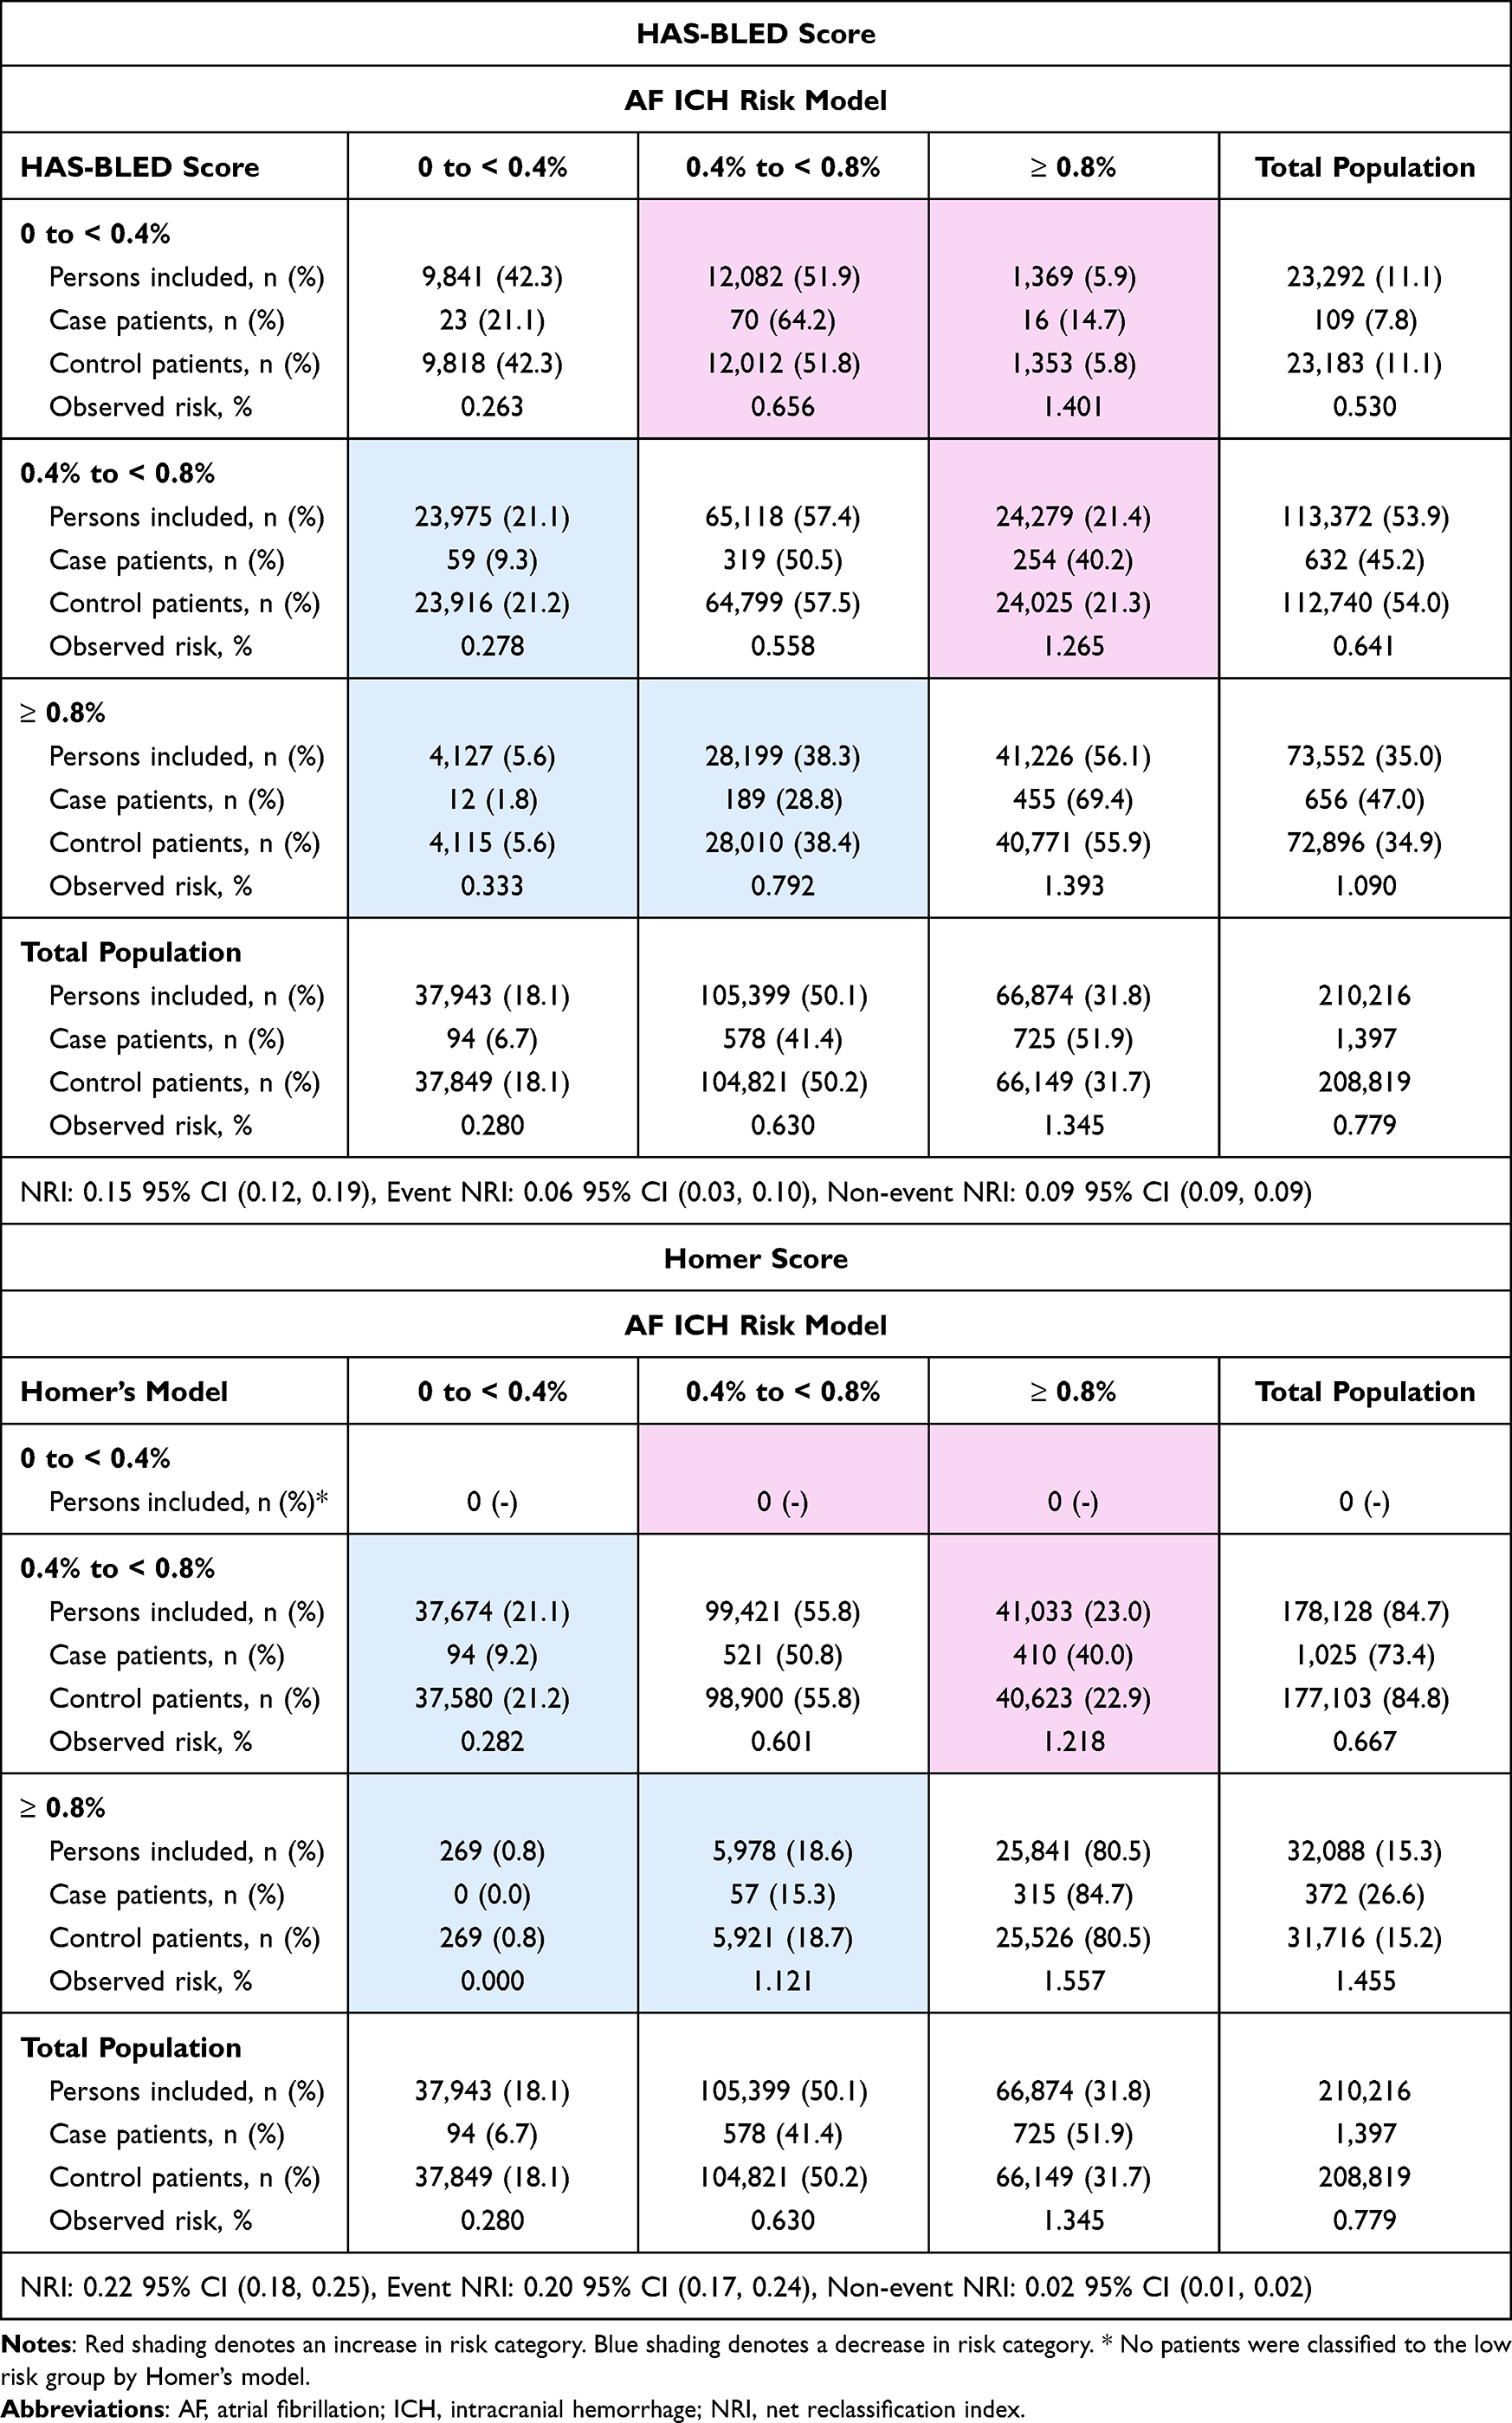 |
Table 3 Comparison Between Recalibrated HAS-BLED Score and Homer Score vs. New ICH Model: Reclassification of Predicted 1-Year ICH Risk Categories in the Validation Set |
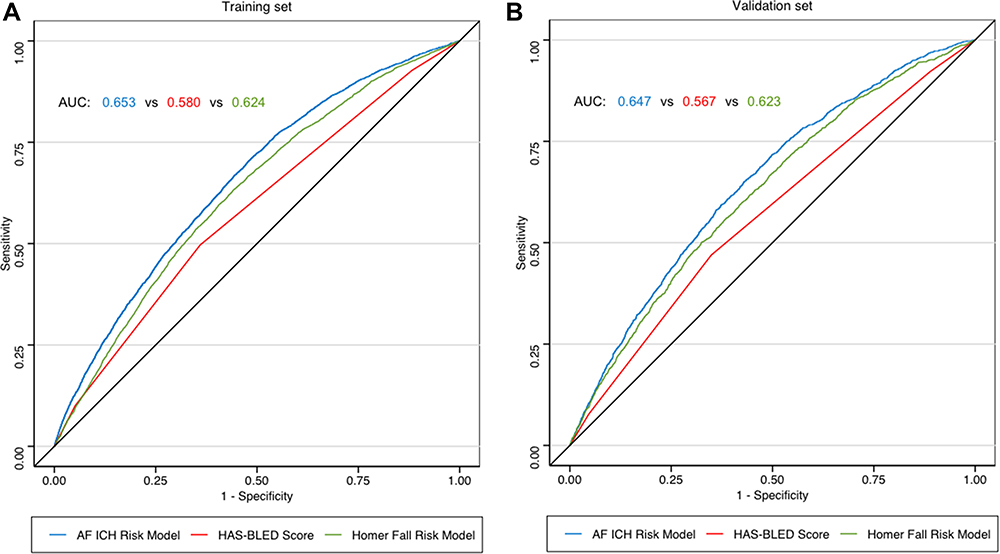 |
Figure 3 Comparison of AF ICH risk model vs. HAS-BLED score and vs. Homer fall risk model: AUC in predicting 1-year risk of ICH. Abbreviations: AF, atrial fibrillation; ICH, intracranial hemorrhage; AUC, area under receiver operating characteristic curve. Note: (A) (left) displays the model performance in the training set and (B) (right) displays the model performance in the validation set. |
Sensitivity Analysis
The AF ICH prediction model that included interaction terms between demographic variables and other predictors did not have higher AUC in the training set (0.651 with interaction vs. 0.653 without interaction; p = 0.074) and in the validation set (0.644 with interaction vs. 0.647 without interaction; p = 0.232) (Supplementary Materials Figures S2 and S3). Considering the competing risk of death, the AF ICH IPCW prediction model yielded similar results with an AUC of 0.653 in the training set of and 0.647 in the validation set (Supplementary Materials Tables S6, S7 and Figures S4, S5). Our model also had similar AUCs in predicting IPH and SDH, individually, in the training set (0.631 and 0.665, respectively) and in the validation set (0.625 and 0.664, respectively) (Supplementary Materials Figures S6–S9). In sensitivity analyses excluding warfarin users, our model remained superior to HAS-BLED and Homer Score in re-evaluation of AUC predicting ICH with an AUC of 0.651 and 0.653 in the training and validation set, respectively (Supplementary Materials Table S8 and Figures S10, S11). Re-development of the AF ICH model in a training set excluding warfarin users improved AUC performance in the training set from 0.651 to 0.658, but did not improve AUC performance in the validation set (0.653 vs. 0.642) when compared to the original AF ICH model performance in this subset of DOAC users (Supplementary Materials Tables S8 and S9).
Discussion
ICH is the most severe adverse effect of OAC.16 A well-calibrated claims-based score predicting ICH risk while on OAC can assist the OAC prescribing decision in the predominantly older population of patients with AF, who typically have multiple comorbidities and are taking multiple medications.4,34 Such a claims-based score can also balance ICH risk in comparative effectiveness studies of OACs. We developed and validated an ICH risk prediction score in a large, representative population of older adults with AF receiving OAC. Our model substantially outperformed the widely used HAS-BLED score, which targets the whole range of bleeding events, most of which are extracranial and generally less severe than ICH events. Our model also markedly outperformed the Homer fall risk score, where fall risk may be used as a proxy for ICH risk.
Anticoagulation is commonly withheld in AF patients with a history of recurrent falls or those at high fall risk due to the risk of ICH following a potential fall, but this prescribing decision is often subjective and not based on evidence. One simulation-based decision analysis that strongly argued against withholding OAC due to risk of falls has been widely cited for nearly 2 decades,35 yet it has hardly influenced underutilization of OAC for AF. A limitation is that the input data for the simulation were mainly drawn from the selected trial populations36,37 where frail patients with recurrent falls were severely under-represented. To aid shared decision-making based on evidence from routine care, researchers can use our AF ICH score to assess the predicted risk of ICH on OAC treatment.
To the best of our knowledge, our model is the first dedicated model that predicts ICH risk in older adults with AF. It is not surprising that our model dedicated to predicting ICH risk based on a very large national sample outformed the HAS-BLED score developed for all-cause bleeding risk in a much smaller dataset with few ICH events.15 Our study also demonstrated that the Homer score17 that was developed using a machine-learning approach predicting fall risk performed suboptimally when predicting ICH risk, although it did perform better than the HAS-BLED score. With the wide availability of electronic health records (EHR) and institutional clinical informatics support, clinicians are no longer limited to manual calculation of clinical risk scores based on few variables. We used a machine-learning approach that yields an interpretable model with coefficients associating each covariate with ICH risk (Table 2), so the quality of the covariate measurement can be evaluated. Our score based on 41 factors can be readily calculated from routinely collected data by a program embedded in an EHR. There are increasing uses of automatically calculated risk scores in EHR in routine care to aid clinical practice.38,39 Physicians can potentially use this AF ICH risk score to inform the prescribing decision of OAC. Our score can also be readily computed based on administrative claims data and used as a risk stratification tool or as a care-quality metric.39
Another potential application of our model in the research context is to improve confounding adjustment and subgroup analyses. The risk of ICH is an important confounder and potential effect modifier for comparative effectiveness and safety analyses of OAC.40–42 However, because the low incidence of ICH, its risk often cannot be estimated in small cohorts with statistical precision. Our model can be helpful in quantifying the propensity for ICH risk, with comparable performance in predicting the IPH and SDH subtypes. The predicted risk of ICH can be used as an adjustment tool to balance the background risk of ICH across the treatment arms and for risk stratification when assessing subgroup effects of OACs.
Based on our model, the predicted and observed risks of ICH align well in the low-risk patients, but the model can overestimate ICH risk in high-risk patients. Because clinicians tend to be overly conservative when withholding OAC for high risk of falling,10–12 we believe our model is most useful in identifying the low-risk group for safe prescribing of OAC. Using our prespecified low-risk group cut-off (predicted value = 0.4%) to prescribe OAC, we observed that 0.28% of the patients developed ICH within one year after the cohort entry in the validation set. The estimated 1-year risk of ICH in the US population aged 65 years or older with AF not on OAC was 0.40%.7 Since the estimated risk of ICH is not higher than that in AF patients not on OAC, we recommend OAC not to be withheld in the low-risk group based on our model. OAC decisions in the higher ICH risk need to be individualized, depending on the estimated risk of ischemic stroke and patient preference. For a rare outcome like ICH, it is expected that using the model to identify those with high likelihood of having ICH will inevitably select a subgroup in which a substantial number of patient will not have this rare event (i.e., positive predictive value may be low). Instead, our model demonstrated its utility to identify individuals unlikely to have ICH with a negative predictive value of 99.7% in the training and validation sets using the Youden Index based cut-off of 0.566%. Therefore, we recommend using our model to identify those with a very low likelihood of having ICH and consider prescribing OAC despite a high perceived fall risk.
Our study has limitations. First, our database did not have laboratory results, gait speed, balance measures, cognitive function, and vital signs, and we cannot assess their associations with the risk of ICH and of falls. However, we did use components of a validated frailty index to partially account for the effect of these features. Next, the predictors identified in our study should not be interpreted as having a causal effect on the ICH or falls. Lastly, our study cohort consists of older adults with AF, of which 76,729 (9.1%) patients died within one year, and competing risk due to death may be of concern. Yet, it is reassuring that accounting for competing risks due to death using IPCW yielded similar results.
In conclusion, we developed and validated a claims-based score predicting 1-year ICH risk among older adults with AF initiating OAC. This score performed substantially better than the standard HAS-BLED score and the Homer fall risk score. This score can assist the OAC decision in individual AF patients and can also balance ICH risk in comparative effectiveness studies of OACs.
Funding
This project was supported by NIH Grant RF1 AG063381 (to Dr. Lin) and R01AG062713 and K24AG073527 (to Dr. Kim).
Disclosure
Daniel E. Singer: Dr. Singer reports research support from Bristol Myers Squibb, and he has consulted for Bristol Myers Squibb, Fitbit (Google), Medtronic and Pfizer, all for unrelated work. Dae Hyun Kim: Dr. Kim reports personal fees from Alosa Health and VillageMD for unrelated work. The authors report no other conflicts of interest in this work.
References
1. Volgman AS, Nair G, Lyubarova R, et al. Management of atrial fibrillation in patients 75 years and older: JACC state-of-the-art review. J Am Coll Cardiol. 2022;79(2):166–179. doi:10.1016/j.jacc.2021.10.037
2. Wolf PA, Abbott RD, Kannel WB. Atrial fibrillation: a major contributor to stroke in the elderly. The Framingham Study. Arch Intern Med. 1987;147(9):1561–1564. doi:10.1001/archinte.1987.00370090041008
3. January CT, Wann LS, Calkins H, et al. 2019 AHA/ACC/HRS Focused Update of the 2014 AHA/ACC/HRS Guideline for the Management of Patients With Atrial Fibrillation: a Report of the American College of Cardiology/American Heart Association Task force on clinical practice guidelines and the heart rhythm society in collaboration with the society of thoracic surgeons. Circulation. 2019;140(2):e125–e151. doi:10.1161/CIR.0000000000000665
4. Hindricks G, Potpara T, Dagres N, et al. 2020 ESC Guidelines for the diagnosis and management of atrial fibrillation developed in collaboration with the European Association for Cardio-Thoracic Surgery (EACTS): the Task Force for the diagnosis and management of atrial fibrillation of the European Society of Cardiology (ESC) Developed with the special contribution of the European Heart Rhythm Association (EHRA) of the ESC. Eur Heart J. 2021;42(5):373–498. doi:10.1093/eurheartj/ehaa612
5. Lip GY, Nieuwlaat R, Pisters R, Lane DA, Crijns HJ. Refining clinical risk stratification for predicting stroke and thromboembolism in atrial fibrillation using a novel risk factor-based approach: the euro heart survey on atrial fibrillation. Chest. 2010;137(2):263–272. doi:10.1378/chest.09-1584
6. Friberg L, Rosenqvist M, Lip GY. Evaluation of risk stratification schemes for ischaemic stroke and bleeding in 182 678 patients with atrial fibrillation: the Swedish Atrial Fibrillation cohort study. Eur Heart J. 2012;33(12):1500–1510. doi:10.1093/eurheartj/ehr488
7. Singer DE, Chang Y, Fang MC, et al. The net clinical benefit of warfarin anticoagulation in atrial fibrillation. Ann Internal Med. 2009;151(5):297–305. doi:10.7326/0003-4819-151-5-200909010-00003
8. Banerjee A, Lane DA, Torp-Pedersen C, Lip GY. Net clinical benefit of new oral anticoagulants (dabigatran, rivaroxaban, apixaban) versus no treatment in a ‘real world’ atrial fibrillation population: a modelling analysis based on a nationwide cohort study. Thromb Haemost. 2012;107(3):584–589. doi:10.1160/th11-11-0784
9. Piccini JP, Singer DE. Putting risk prediction in atrial fibrillation into perspective. Eur Heart J. 2012;33(12):1431–1433. doi:10.1093/eurheartj/ehs031
10. Hagerty T, Rich MW. Fall risk and anticoagulation for atrial fibrillation in the elderly: a delicate balance. Cleve Clin J Med. 2017;84(1):35–40. doi:10.3949/ccjm.84a.16016
11. Gage BF, Birman-Deych E, Kerzner R, Radford MJ, Nilasena DS, Rich MW. Incidence of intracranial hemorrhage in patients with atrial fibrillation who are prone to fall. Am J Med. 2005;118(6):612–617. doi:10.1016/j.amjmed.2005.02.022
12. Ko D, Lin KJ, Bessette LG, et al. Trends in use of oral anticoagulants in older adults with newly diagnosed atrial fibrillation, 2010–2020. JAMA Network Open. 2022;5(11):e2242964. doi:10.1001/jamanetworkopen.2022.42964
13. Neidecker M, Patel AA, Nelson WW, Reardon G. Use of warfarin in long-term care: a systematic review. BMC Geriatr. 2012;12:14. doi:10.1186/1471-2318-12-14
14. Wilke T, Groth A, Pfannkuche M, et al. Real life anticoagulation treatment of patients with atrial fibrillation in Germany: extent and causes of anticoagulant under-use. J Thromb Thrombolysis. 2015;40(1):97–107. doi:10.1007/s11239-014-1136-8
15. Pisters R, Lane DA, Nieuwlaat R, de Vos CB, Crijns HJ, Lip GY. A novel user-friendly score (HAS-BLED) to assess 1-year risk of major bleeding in patients with atrial fibrillation: the Euro Heart Survey. Chest. 2010;138(5):1093–1100. doi:10.1378/chest.10-0134
16. Fang MC, Go AS, Chang Y, et al. Death and disability from warfarin-associated intracranial and extracranial hemorrhages. Am J Med. 2007;120(8):700–705. doi:10.1016/j.amjmed.2006.07.034
17. Homer ML, Palmer NP, Fox KP, Armstrong J, Mandl KD. Predicting falls in people aged 65 years and older from insurance claims. Am J Med. 2017;130(6):744.e17–744.e23. doi:10.1016/j.amjmed.2017.01.003
18. Graham DJ, Reichman ME, Wernecke M, et al. Stroke, bleeding, and mortality risks in elderly medicare beneficiaries treated with dabigatran or rivaroxaban for nonvalvular atrial fibrillation. JAMA Intern Med. 2016;176(11):1662–1671. doi:10.1001/jamainternmed.2016.5954
19. Cunningham A, Stein CM, Chung CP, Daugherty JR, Smalley WE, Ray WA. An automated database case definition for serious bleeding related to oral anticoagulant use. Pharmacoepidemiol Drug Saf. 2011;20(6):560–566. doi:10.1002/pds.2109
20. FDA. National drug code directory. Available from: https://www.fda.gov/drugs/drug-approvals-and-databases/national-drug-code-directory.
21. Kim DH, Schneeweiss S, Glynn RJ, Lipsitz LA, Rockwood K, Avorn J. Measuring frailty in medicare data: development and validation of a claims-based frailty index. J Gerontol Ser A. 2017;73(7):980–987. doi:10.1093/gerona/glx229
22. Lip GY, Frison L, Halperin JL, Lane DA. Comparative validation of a novel risk score for predicting bleeding risk in anticoagulated patients with atrial fibrillation: the HAS-BLED (Hypertension, Abnormal Renal/Liver Function, Stroke, bleeding history or predisposition, Labile INR, Elderly, Drugs/Alcohol Concomitantly) score. J Am Coll Cardiol. 2011;57(2):173–180. doi:10.1016/j.jacc.2010.09.024
23. Methodology WCCfDS. Structure and principles Norwegian institute of public health Available from: https://www.whocc.no/atc/structure_and_principles/.
24. Simon N, Friedman JH, Hastie T, Tibshirani R. Regularization paths for cox’s proportional hazards model via coordinate descent. J Statist Softw. 2011;39(5):1–13. doi:10.18637/jss.v039.i05
25. Friedman J, Hastie T, Tibshirani R. Regularization paths for generalized linear models via coordinate descent. J Stat Softw. 2010;33(1):1–22. doi:10.18637/jss.v033.i01
26. Tibshirani R. Regression shrinkage and selection via the lasso. J Royal Stat Soc Series B. 1996;58:267–288.
27. Hosmer DWL. Applied Logistic Regression.
28. DeLong ER, DeLong DM, Clarke-Pearson DL. Comparing the areas under two or more correlated receiver operating characteristic curves: a nonparametric approach. Biometrics. 1988;44(3):837–845. doi:10.2307/2531595
29. Cook NR. Statistical evaluation of prognostic versus diagnostic models: beyond the ROC curve. Clin Chem. 2008;54(1):17–23. doi:10.1373/clinchem.2007.096529
30. Pencina MJ, D’Agostino RB, D’Agostino RB, Vasan RS. Evaluating the added predictive ability of a new marker: from area under the ROC curve to reclassification and beyond. Stat Med. 2008;27(2):157–172. doi:10.1002/sim.2929
31. Youden WJ. Index for rating diagnostic tests. Cancer. 1950;3(1):32–35. doi:10.1002/1097-0142(1950)3:1<32::AID-CNCR2820030106>3.0.CO;2-3
32. Aetion Evidence Platform® (2023). Aetion® Substantiate Software for Real-World Data Analysis. Aetion, Inc. http://aetion.com
33. Gagne JJ, Glynn RJ, Avorn J, Levin R, Schneeweiss S. A combined comorbidity score predicted mortality in elderly patients better than existing scores. J Clin Epidemiol. 2011;64(7):749–759. doi:10.1016/j.jclinepi.2010.10.004
34. Staerk L, Sherer JA, Ko D, Benjamin EJ, Helm RH. Atrial Fibrillation: epidemiology, Pathophysiology, and Clinical Outcomes. Circ Res. 2017;120(9):1501–1517. doi:10.1161/circresaha.117.309732
35. Man-Son-Hing M, Nichol G, Lau A, Laupacis A. Choosing antithrombotic therapy for elderly patients with atrial fibrillation who are at risk for falls. Arch Intern Med. 1999;159(7):677–685. doi:10.1001/archinte.159.7.677
36. Risk factors for stroke and efficacy of antithrombotic therapy in atrial fibrillation. Analysis of pooled data from five randomized controlled trials. Arch Intern Med. 1994;154(13):1449–1457. doi:10.1001/archinte.1994.00420130036007
37. The efficacy of aspirin in patients with atrial fibrillation. Analysis of pooled data from 3 randomized trials. The Atrial Fibrillation Investigators. Arch Intern Med. 1997;157(11):1237–1240. doi:10.1001/archinte.1997.00440320143013
38. Callahan KE, Clark CJ, Edwards AF, et al. Automated frailty screening at-scale for pre-operative risk stratification using the electronic frailty index. J Am Geriatr Soc. 2021;69(5):1357–1362. doi:10.1111/jgs.17027
39. Electronic Frailty Index; 2023. Available from: https://www.england.nhs.uk/ourwork/clinical-policy/older-people/frailty/efi/#the-contract-requires-general-practice-to-use-An-appropriate-tool-for-example-The-electronic-frailty-index-efi-what-is-The-efi.
40. Donze J, Clair C, Hug B, et al. Risk of falls and major bleeds in patients on oral anticoagulation therapy. Am J Med. 2012;125(8):773–778. doi:10.1016/j.amjmed.2012.01.033
41. Rao MP, Vinereanu D, Wojdyla DM, et al. Clinical outcomes and history of fall in patients with atrial fibrillation treated with oral anticoagulation: insights from the ARISTOTLE trial. Am J Med. 2018;131(3):269–275.e2. doi:10.1016/j.amjmed.2017.10.036
42. Kim DH, Pawar A, Gagne JJ, et al. Frailty and clinical outcomes of direct oral anticoagulants versus warfarin in older adults with atrial fibrillation: a cohort study. Ann Internal Med. 2021;174(9):1214–1223. doi:10.7326/m20-7141
 © 2024 The Author(s). This work is published and licensed by Dove Medical Press Limited. The full terms of this license are available at https://www.dovepress.com/terms.php and incorporate the Creative Commons Attribution - Non Commercial (unported, v3.0) License.
By accessing the work you hereby accept the Terms. Non-commercial uses of the work are permitted without any further permission from Dove Medical Press Limited, provided the work is properly attributed. For permission for commercial use of this work, please see paragraphs 4.2 and 5 of our Terms.
© 2024 The Author(s). This work is published and licensed by Dove Medical Press Limited. The full terms of this license are available at https://www.dovepress.com/terms.php and incorporate the Creative Commons Attribution - Non Commercial (unported, v3.0) License.
By accessing the work you hereby accept the Terms. Non-commercial uses of the work are permitted without any further permission from Dove Medical Press Limited, provided the work is properly attributed. For permission for commercial use of this work, please see paragraphs 4.2 and 5 of our Terms.