")
Back to Journals » International Journal of Nanomedicine » Volume 19
Coordinated ASBT and EGFR Mechanisms for Optimized Liraglutide Nanoformulation Absorption in the GI Tract
Authors Kweon S, Park SJ, Lee HK, Kang SH, Chang KY, Choi JU, Park J , Shim JH , Park JW , Byun Y
Received 30 September 2023
Accepted for publication 14 March 2024
Published 23 March 2024 Volume 2024:19 Pages 2973—2992
DOI https://doi.org/10.2147/IJN.S442617
Checked for plagiarism Yes
Review by Single anonymous peer review
Peer reviewer comments 2
Editor who approved publication: Professor Jie Huang
Seho Kweon,1,2 Seong Jin Park,3 Ha Kyeong Lee,1 Seo Hee Kang,4 Kwan-Young Chang,4 Jeong Uk Choi,5 Jooho Park,6 Jung-Hyun Shim,7 Jin Woo Park,7 Youngro Byun1,3
1Department of Molecular Medicine and Biopharmaceutical Science, Graduate School of Convergence Science and Technology, Seoul National University, Seoul, 08826, Republic of Korea; 2College of Pharmacy, Chonnam National University, Gwangju, 61186, Republic of Korea; 3College of Pharmacy, Seoul National University, Seoul, 08826, Republic of Korea; 4Global R&D Center, IcureBNP, Seoul, 06170, Republic of Korea; 5College of Pharmacy, Kyung Hee University, Seoul, 02447, Republic of Korea; 6Department of Biomedical & Health Science, Konkuk University, Chungju, 27478, Republic of Korea; 7College of Pharmacy and Biomedical and Healthcare Research Institute, Mokpo National University, Jeonnam, 58554, Republic of Korea
Correspondence: Jin Woo Park; Youngro Byun, Tel +82 61 450 2704, Email [email protected]; [email protected]
Background: For maintenance therapy in type 2 diabetes, glucagon-like peptide-1 agonist (GLP-1A), which exhibits low cardiovascular risk and high efficacy, is a promising peptide therapeutic. However, developing an oral GLP-1A presents challenges due to the analog’s poor cellular permeability and gastrointestinal (GI) stability.
Methods: To mitigate such limitations, an oral nanoformulation of liraglutide (LG) was designed and achieved by combining LG with bile acid derivatives using the nanoprecipitation method. This strategy allowed the bile acid moieties to localize at the nanoparticle surface, enhancing the binding affinity for apical sodium-dependent bile acid transporter (ASBT) and improving GI stability. The in vitro characteristics, cellular permeability, and absorption mechanisms of the LG nanoformulation (LG/TD-NF) were thoroughly investigated. Furthermore, the in vivo oral absorption in rats and the glucose-lowering effects in a diabetic (db/db) mouse model were evaluated.
Results: The LG/TD-NF produced neutral nanoparticles with a diameter of 58.7 ± 4.3 nm and a zeta potential of 4.9 ± 0.4 mV. Notably, when exposed to simulated gastric fluid, 65.7 ± 3.6% of the LG/TD-NF remained stable over 120 min, while free LG was fully degraded. Relative to unformulated LG, the Caco-2 cellular permeability of the nanoformulation improved, measuring 10.9 ± 2.1 (× 10− 6 cm/s). The absorption mechanism prominently featured endocytosis simultaneously mediated by both ASBT and epidermal growth factor receptor (EGFR). The oral bioavailability of the LG/TD-NF was determined to be 3.62% at a dosage of 10 mg/kg, which is 45.3 times greater than that of free LG. In a diabetes model, LG/TD-NF at 10 mg/kg/day exhibited commendable glucose sensitivity and reduced HbA1c levels by 4.13% within 28 days, similar to that of subcutaneously administered LG at a dosage of 0.1 mg/kg/day.
Conclusion: The oral LG/TD-NF promotes ASBT/EGFR-mediated transcytosis and assures cellular permeability within the GI tract. This method holds promise for the development of oral GLP-1A peptides as an alternative to injections, potentially enhancing patient adherence to maintenance therapy.
Keywords: nanoformulation of GLP-1A, oral liraglutide, ASBT-mediated endocytosis, EGFR
Introduction
Type 2 diabetes mellitus (T2DM) is a chronic disease characterized by inadequate insulin production, and in some instances, a decline in insulin sensitivity as the condition progresses.1 Orally administered pharmacological agents, such as metformin, dipeptidyl peptidase-4 inhibitors, and sodium-glucose cotransporter-2 inhibitors, are extensively utilized as potential therapeutic interventions for T2DM management in the context of long-term treatment. Moreover, injectable therapeutic peptides, including glucagon-like peptide-1 agonist (GLP-1A) and insulin, often serve as primary treatment modalities.2,3 Due to their superior glucose-lowering effects and reduced cardiovascular risks compared to chemical-based medications, these therapeutic peptides have garnered significant attention in drug development. Thus, there is an intensified focus on advancing synthesis and purification technologies to further the development of these peptides.4 However, the need for prolonged and frequent invasive administration can lead to decreased patient compliance and heightened risk for infections, potentially resulting in treatment failure. Several modified forms of GLP-1A have been introduced to mitigate these limitations. Some of these have extended half-lives, such as liraglutide (LG), lixisenatide, albiglutide, dulaglutide, and semaglutide. There is also a growing interest in dual-target agonists, which act on both the GLP-1 receptor and glucagon receptor.5,6 However, it is essential to note that simply extending half-life does not ensure superior diabetes treatment efficacy.7 In addition, patients tend to prefer oral treatments over injections.8,9
The gastrointestinal (GI) tract poses significant challenges for orally administered peptides. Various barriers, including biochemical (enzymatic degradation, acidic pH), mucosal, and cellular barriers (attributed to molecular size and hydrophobicity), obstruct their passage into systemic circulation, resulting in an oral bioavailability of less than 0.1%.10,11 Employing permeability enhancers has become a common strategy in the creation of oral formulations. In 2019, the Food and Drug Administration (FDA) approved an oral semaglutide tablet (branded as Rybelsus by NovoNordisk), marking a significant milestone as the first oral GLP-1A.12 The tablet’s absorption predominantly takes place in the stomach due to its coadministration with sodium N-[8-(2-hydroxybenzoyl) amino] caprylate (SNAC), achieving an approximate absorption rate of 1%. The subsequent year saw the approval of the oral octreotide capsule (Mycapssa by Chiasma), representing the first orally delivered somatostatin formulation combined with a transient permeability enhancer.13 While permeation enhancers in oral formulations can elevate permeability across cellular barriers by perturbing the cell membrane, excessive doses might trigger GI side effects, including nausea, diarrhea, and diminished appetite.14
Bile acid derivatives, derived from the human body, demonstrate biocompatibility. Beyond facilitating the absorption of fats and lipids, they act as potent drug carriers, amplifying the uptake of pharmaceuticals.15–17 A variety of injectable medications, including anti-cancer agents, insulin, and heparin, have been paired with such derivatives to develop oral formulations. Such preparations have consistently proven to enter the lymphatic or systemic circulation, showing bolstered oral bioavailability.18 While chemical-based medications integrated with such derivatives can pass through the intestinal epithelium via the apical sodium-dependent bile acid transporter (ASBT) pathway, applying them to macromolecule therapeutics becomes daunting, primarily due to their extensive size, often exceeding 1000 Da.19,20 Previous research has highlighted the role of ASBT in the transcytosis mechanism underlying macromolecule transit. In this process, ASBT induces cell membrane invagination into vesicles, which then bind with ileal bile acid-binding proteins for transport through the organic anion transporter system to the basolateral face.21 Of the later, the absorption of nanoparticles modified with glycocholic acid has been described by endocytosis in relation to both the non-caveolae pathway and the chylomicron pathway.22,23 However, the details on how ASBT activates transporter assembly and the exact transportation method remain obscure.
Sodium taurocholate cotransporting polypeptide (NTCP) is closely associated with ASBT, is a member of the solute carrier family, and functions as a bile acid transporter within the liver.24 Previous studies have demonstrated that drug delivery involving both ASBT and NTCP transporters together improves cellular absorption.25–27 However, recent research has linked hepatitis B and D virus infections in the liver with the presence of NTCP. Such studies suggest that the preS1 domain of these viruses can bind to the open-pore configuration of NTCP to invade hepatocytes.28–30 An comprehensive approaches for NTCP’s internalization has been described in associated with the epidermal growth factor receptor (EGFR).31,32 Conversely, earlier investigations have exclusively ratified the formation of ASBT-vesicles for transcytosis through their affiliation to bile acid derivatives,21,27 but the complete understanding of the ASBT-facilitated internalization process remains incomplete.33,34
In this study, we developed an oral nanoformulation of GLP-1A. In this process, we first investigated the transport of bile acid derivatives via endocytosis simultaneously mediated via ASBT and EGFR. LG was chosen as the oral acylated GLP-1A candidate than semaglutide. Because LG is more amenable to oral formulation due to its physicochemical properties than semaglutide, its oral formulation has not yet been commercialized. We characterized various LG nanoparticle formulations containing bile acid derivatives by examining their particle size distribution (PSD) and zeta potential. We identified appropriate bile acid derivatives, honed the formulations to optimize stability and potency, determined their binding affinities to ASBT, evaluated their cellular transport inhibition, and observed vesicle trafficking to understand their route of transcytosis in relation to ASBT and EGFR. We also conducted in vivo tests in mice to assess intestinal distribution and oral bioavailability, as well as long-term glucose-lowering impacts. Our results provide an encouraging foundation for advancing other oral GLP-1As. Transitioning from injections to oral medicines could potentially improve patient commitment to continuous therapy and curtail societal costs.
Materials and Methods
Materials
LG was sourced from PolyPeptide Laboratories, Inc. (California, USA). An array of negatively charged bile acid derivatives, specifically taurocholate, taurodeoxycholate, taurochenodeoxycholate, deoxycholate (DC), and taurolithocholate (TLC), were procured from Sigma-Aldrich (Massachusetts, USA). Positively charged bile acid derivatives, such as lysine conjugated deoxycholic acid (DCK), were acquired from Leobio Co. (Suwon, Republic of Korea). Various compounds including actinomycin D, chlorpromazine, clofazimine, cyclodextrin, cyclosporin A, gefitinib, pure ethanol, golgicide A, methyl-β-primaquine, and vacuolin-1 were also obtained from Sigma-Aldrich. For synthesis processes, 1-ethyl-3-(3-dimethylamino-propyl) carbodiimide (EDC) and N-hydroxy succinimide (NHS) were procured from Cytiva (Massachusetts, USA). In vitro cellular studies employed the Caco-2 cell line (human colorectal adenocarcinoma epithelial cells), Madin-Darby canine kidney cell line (MDCK, dog kidney epithelial cells), and SK-BR-3 (human breast epithelial cells) sourced from ATCC (Virginia, USA). The ASBT-expressed MDCK cell line, previously transfected with ASBT-DNA,21 was also used in vitro. Essential mediums such as Dulbecco’s modified Eagle’s medium (DMEM), fetal bovine serum (FBS), 1× nonessential amino acids, penicillin–streptomycin, and RPMI-1640 medium were purchased from Gibco (Montana, USA). Hank’s balanced salt solution (HBSS) and phosphate-buffered saline (PBS) were supplied by Corning (New York, USA).
Animals
Male Sprague-Dawley rats (7 weeks old, 200–250 g), male C57BL/6 mice (8 weeks old, 20–25 g), and male C57BLKsJ-db/db mice (7 weeks old, 30–35 g) were acquired from OrientBio Inc. (Seongnam, Republic of Korea). All animals were acclimated under controlled conditions of 23 ± 2°C and humidity 55 ± 10% for at least a week before starting experiments. The in vivo study protocols adhered to the Institutional Animal Care and Use Committee guidelines of Seoul National University (Republic of Korea) and were approved under the numbers SNU-200127-3 and SNU-200803-3-4.
Preparation of LG Nanoformulation
The LG compound (10 mg, 1 mole ratio) was dissolved in 0.1 mL 0.1 M ammonium bicarbonate solution, and the pH was adjusted to 7.0 (LG 100 mg/mL). TLC or DCK was dissolved in anhydrous pure ethanol at a mole ratio corresponding to the LG solution (1:1, 1:2, 1:4, and 1:6; 1 mole ratio/0.1 mL). Then, the LG solution was gradually added to the TLC or DCK solutions with stirring, creating the LG/TLC or LG/DCK formulations. For LG/TLC/DCK nanoparticles (LG/TD), the TLC and DCK solutions were initially mixed; then, the LG solution was added. Following this, precipitates were centrifuged at 10,000 × g for 15 min to eliminate unbound LG, after which they were freeze-dried. For the final oral LG nanoformulation (LG/TD-NF), 20% (v/v) PEG 200 (Sigma-Aldrich) and 0.5% (v/v) caprylocaproyl macrogol-8-glyceride (Labrasol, Gattefossé) were combined with the LG solution and added to the TLC and DCK solution. This was freeze-dried with stabilizing agents including 25 mg mannitol and 5 mg sucrose.
Caco-2 Permeability Assay
When Caco-2 cells reached around 70% confluence, they were placed onto a Transwell® plate with a 0.4 µm pore membrane (Corning) at a density of 1 × 10⁵ cells per well. Fresh medium made up of 10% FBS, 1% (v/v) 1× nonessential amino acids, and 1% (v/v) penicillin–streptomycin (0.5 mL at the apical side, 1.5 mL at the basolateral side) was replaced every 3 days and then maintained for 14–21 days until the formation of a confluent monolayer with the transepithelial electrical resistance (TEER) achieved 650 ± 100 Ω·cm2.35 During drug treatment, the culture medium was replaced with HBSS 1 h before the initial time point (0 h). Samples were collected from the basolateral side at intervals of 1, 2, 3, 4, and 6 h. LG concentration was measured using reverse-phase high-performance liquid chromatography (RP-HPLC) on an Agilent 1300 series instrument (Agilent, California, USA) at 265 nm, using a gradient mobile phase and a Zorbax 300SB-C18 column (150 × 4.6 mm, 5 µm, Agilent) with a 1.0 mL/min flow rate. The permeability coefficient in Caco-2 cells, denoted as Papp, was determined using the formula: Papp = dQ/dt × 1/(A × C0). Here, dQ/dt indicates the amount of LG at the basolateral side over time (mol/s), A represents the Transwell® area (cm2), and C0 denotes the starting LG concentration at the apical side (mol/mL).
In vitro Characterization of LG/TD-NF
The formation of an ionic complexation between LG and bile acid derivatives determines the surface zeta potential of the nanoformulation, which varies according to the charge of bile acid utilized. At a pH of 7.0, LG exhibits a negative charge, whereas TLC and DCK are present in anhydrous ethanol as uncharged monomers. When the two solutions are mixed, the identification of ionic complexation can be ascertained by observing differences in the zeta potential of the nanoformulation. An excessive amount of TLC tends to make the nanoformulation negatively charged, while too much DCK makes it positively charged. Therefore, an appropriate neutral zeta potential indicates the proper ratio of TLC to DCK. Additionally, the particle size distribution (PSD) of the nanoformulation was evaluated to prepare constant and small nanoparticles. The zeta potential and PSD of the three LG/bile acid derivative formulations (LG/TLC, LG/DCK, and LG/TLC/DCK) were analyzed using a Zetasizer Pro instrument (Malvern, Worcestershire, UK) at room temperature, employing various mole ratios. Lyophilized formulation powders were reconstituted in distilled water, then diluted to a concentration of 0.5 mg/mL to avert flocculation. For measurements, samples were placed in DTS1070 (Malvern) cuvettes to measure zeta potential and DTS0012 (Malvern) cuvettes to measure PSD. After 120 s stabilization, the samples were analyzed.
To quantify LG in the nanoformulation, any unbound LG present during the production process was removed. Precipitates from the LG/bile acid derivative mixtures were washed with distilled water and freeze-dried. Then, samples were solubilized in isopropanol (Sigma-Aldrich), and LG amounts were quantified using the RP-HPLC system under the previously mentioned conditions. To optimize drug content, various concentrations of labrasol (0.1%, 0.25%, 0.5%, and 1.0% [v/v]) were added to the LG solution, and drug content was evaluated using the same RP-HPLC method.
Field-emission scanning electron microscopy (FE-SEM, SUPRA 55VP, Carl Zeiss, Germany) and 2D diffusion-ordered 1H nuclear magnetic resonance spectroscopy (DOSY-NMR) were deployed to validate nanoparticles within the LG/TD-NF. Morphologic and size characteristics of the LG, LG formulations without bile acid derivatives (LG-F), LG-bile acid derivatives (LG/TD), and LG/TD-NF were assessed via FE-SEM. For DOSY-NMR assessment, LG and LG/TD-NF were prepared at 1 mg/mL in PBS (pH 6.8) containing deuterium oxide (D2O) and analyzed via 850 MHz NMR (Avance III HD, Bruker, USA). Data were processed using Mnova 14.3.3 software (Mestrelab Research, Spain).
The in vitro cytotoxicity of our nanoformulation, LG/TD-NF, was assessed in the Caco-2 cell line using the WST-1 assay (Roche, Switzerland). Caco-2 cells were seeded into a 96-well plate at a density of 5 × 10⁴ cells per well and incubated for 24 h under controlled conditions at 37 °C with 5% CO2. Free LG, nanoformulation LG/TD-NF, or all excipients except LG in LG nanoformulation (LG/TD-NF without LG) was prepared with DMEM (containing 10% FBS and 1% penicillin-streptomycin) at equivalent to LG concentrations ranging from 0 to 100 µM, which was then replaced to each well. After 24 h of treatment, 10 µL of cell proliferation reagent WST-1 was added to each well, followed by a further incubation for 4 h at 37 °C with 5% CO2. The absorbance of the samples was measured at 450 nm, with a background control for reference. The cytotoxicity was calculated compared to the untreated control (0 µM).
Stability Test in Simulated Gastric Fluid
The stability of LG/TD-NF in simulated gastric fluid (pH 1.2 with pepsin) was examined. Simulated gastric fluid was produced by dissolving 200 mg sodium chloride and 64 mg pepsin from porcine stomach mucosa (Sigma-Aldrich) in 100 mL distilled water, adding 0.7 mL hydrochloric acid and adjusting the pH to 1.2. The LG compound (1 mg) was dissolved in 0.1 mL 0.1 M ammonium bicarbonate solution (10 mg/mL concentration) and then incubated with 0.9 mL simulated gastric fluid at 37°C. Samples of 100 μL were collected at 0, 5, 15, 30, 60, and 120 min intervals. To stop the enzymatic reaction, 43 μL 0.2 M NaOH was added. The LG concentration was measured on the RP-HPLC system. The stability of formulations against enzymes was compared by testing the stability of several polyethylene glycols (PEG 200, PEG 400, PEG 1000, and PEG 4000; Sigma-Aldrich) and simulated gastric fluid with varying PEG concentrations (0%, 20%, and 40%).
Circular dichroism (CD) spectra of LG formulations were recorded between 200 nm and 280 nm at 20°C using a Chirascan Plus (Applied Photophysics Ltd., North Carolina, USA) with a 1 mm cuvette. To observe the spectral changes according to the ratios of TLC (1:0 to 1:8) and DCK (1:0 to 1:8), various LG formulations were dissolved in PBS (pH 6.8) at 0.5 mg/mL using the previously described methods. The stability of LG/TD-NF in simulated gastric fluid (pH 1.2) was assessed under the same conditions, along with LG, LG-F, and LG/TD.
Binding Affinity to ASBT
The binding affinities of LG, bile acid derivatives (TLC and DCK), LG-F, LG/TD, and LG/TD-NF to ASBT were assessed using surface plasmon resonance on a BIAcore T100 instrument (GE Healthcare, Illinois, USA). The recombinant human ASBT transporter (SLC10A2) was prepared at a concentration of 10 µg/mL for pH scouting. To identify the optimal pH, acetate buffers with pH levels of 4.5, 5.0, 5.5, and 6.0 were tested for 120 s at a flow rate of 10 µg/min. To immobilize ASBT on the Series S sensor chip CM5 (GE Healthcare), a combination of amine coupling agents was utilized: 0.4 M EDC in deionized water, 0.1 M NHS in deionized water, and 1 M ethanolamine HCl at pH 8.5. The target response unit was determined using the equation: Rmax = MWanalyte/MWligand × RL × S,36 where Rmax is the theoretical maximum binding capacity of the analyte at saturation, MWanalyte is the average molecular weight of bile acid derivatives, MWligand is the molecular weight of ASBT, RL represents the intended quantity of immobilized ligand ASBT, and S is the stoichiometry of the interaction. Each sample was prepared in HEPES buffer containing 150 mM NaCl and analyzed at a flow rate of 20 mL/min to study binding associations and dissociation properties. The CM5 chip was refreshed using 50 mM NaOH. The equilibrium dissociation constant (Kd = koff/kon) was derived from the association rate (kon) and dissociation rate (koff).36
Cellular Uptake in MDCK and ASBT-Expressing MDCK Cells
For visualization of cellular uptake via immunofluorescence imaging, FITC-labeled LG was synthesized. A solution of LG (50 mg, 1 eq.) was dissolved in 4 mL 0.1 M sodium bicarbonate solution (pH 8.0). Next, 0.5 mL NHS-5,6-FAM solution in amine-free DMF (100 mg/mL, 8 eq.) was added and allowed to react for 4 h at room temperature. The resultant mixture was washed with PBS and purified on a PD-10 column (Cytiva, Marlborough, USA) before undergoing lyophilization for subsequent experiments.
For immunofluorescence staining, MDCK and ASBT-expressing MDCK cells were seeded onto a 35 mm confocal dish at a density of 5 × 10⁴ cells/well. These cells were incubated at 37°C in a 5% CO2 atmosphere for 48 h. Upon reaching confluence, the cells were exposed to 100 nM FITC-labeled LG nanoformulation in culture media for an 1 h. Post incubation, the cells were washed with PBS and fixed with a 4% formalin solution for 20 min at room temperature. This was followed by permeabilization and blocking using a buffer composed of 10% FBS, 0.3% Triton X, and 0.3% goat serum in PBS for 40 min. After another wash with PBS, the samples were treated overnight with SLC10A2 rabbit polyclonal antibody (Bioss, diluted 1:100). The next day, following a PBS wash, the cells were incubated with Alexa-594 anti-rabbit IgG antibody (BioLegend, diluted 1:50) for 90 min at room temperature. After a final PBS wash, the cells were mounted with DuolinkTM in situ mounting medium (Sigma-Aldrich) and visualized via confocal laser scanning microscopy (TCS SP8, Leica).
Cellular Absorption Mechanism Assessment
To investigate the absorption mechanism, various pathway inhibitors were prepared in HBSS at specific concentrations: actinomycin D (ASBT inhibitor, 3.2 µM), chlorpromazine (clathrin-dependent inhibitor, 32 µM), cyclosporin A (P-gp inhibitor, 10 mM), gefitinib (EGFR inhibitor, 10 µM), methyl-β-cyclodextrin (clathrin-independent inhibitor, 10 mM), clofazimine (organic solute transporters [OTSs] inhibitor, 10 µM), primaquine (endosome-mediated inhibitor, 300 mM), golgicide A (Golgi-mediated inhibitor, 50 µM), and vacuolin-1 (lysosome-mediated inhibitor, 1 µM). These inhibitors were chosen due to their documented effects on endocytic and exocytic pathways.15,38 Caco-2 cells were plated on a 12 mm Transwell® plate with a 0.4 µm pore membrane at 1 × 10⁵ cells/well density and cultured until reaching a TEER value between 250 and 300 Ω·cm2. Then, 1 h before drug treatment, the HBSS was substituted with fresh medium. The HBSS on the apical side of the plate was removed after 30 min, followed by a 30 min incubation with each inhibitor. The LG/TD-NF was then applied to the apical side at 0 h, with a sample taken from the basolateral side after 2 h to measure the LG concentration using the previously described RP-HPLC system.
The role of EGFR in endocytosis was evaluated by comparing cellular uptake of FITC-labeled LG/TD-NF with EGFR inhibitors in SK-BR3 cells. These cells were seeded at 5 × 10⁴ cells/well in 35 mm confocal dishes and cultured at 37°C. On the day of the experiment, FITC-labeled LG/TD-NF was prepared in DMEM at 1 mM. In addition, gefitinib (an EGFR inhibitor) was dissolved in HBSS at 10 µM. After rinsing with PBS, cells were treated with gefitinib for 30 min, followed by a 30 min incubation with FITC-labeled LG/TD-NF at 37°C. Afterward, cells underwent five PBS washes, a 20 min fixation, and a 60 min permeabilization and blocking step. The cells were then treated with either anti-ASBT antibody (SLC10A2, Bioss, 1:100 in 1% bovine serum albumin [BSA]) or Alexa Fluor™ 594 anti-EGFR antibody (Cell Signaling Technology, 1:200 in 1% BSA) for 2 h at room temperature. DyLight® 593 Donkey Anti-Rabbit IgG (Abcam, 1:200 diluted with blocking buffer) was used for the anti-ASBT antibody. After a 180 min incubation at room temperature, the cells were washed with PBS, mounted with DuolinkTM in situ mounting solution, and visualized via confocal laser scanning microscopy (TCS SP8, Leica).
Subsequently, cellular trafficking of FITC-labeled LG/TD-NF was observed at specific intervals of 5, 15, 60, and 90 min. SK-BR3 cells were treated with Alexa FluorTM 555 anti-clathrin antibody (Invitrogen, 1:200 in 1% BSA) and wheat germ agglutinin Texas-Red™ conjugate (Invitrogen, 1:200 in 1% BSA) for 3 h at room temperature. Post-treatment, the samples were mounted using Duolink™ in situ mounting solution and analyzed via confocal laser scanning microscopy (TCS SP8, Leica).
In vivo Oral Absorption Assessment
Sprague–Dawley rats were fasted for at least 8 h before drug administration. To neutralize stomach pH, they were given 200 μL 5% (w/v) sodium bicarbonate antacid (Sigma-Aldrich) orally. LG (0.5 mg/kg, subcutaneous) and oral doses of LG (10 mg/kg), LG-F (10 mg/kg), and LG/TD-NF (10 mg/kg) were administered in 200 µL volumes. Blood samples were taken from the jugular vein at set time intervals (1, 2, 4, 6, 8, 10, and 24 h). The plasma was separated from these samples via centrifugation at 5000 × g for 10 min and stored at –80°C until analysis. LG plasma concentrations were determined using the Liraglutide ELISA kit from Cloud-Clone Corp. (Texas, USA). Non-compartmental analysis provided pharmacokinetic parameters such as time of maximum concentration (Tmax), maximum concentration (Cmax), half-life (t1/2), area under the curve (AUC), and bioavailability.
To examine the intestinal distribution of LG/TD-NF, both in vivo imaging system and immunofluorescence staining were employed 0.5, 1, 2, and 4 h after a 10 mg/kg FITC-labeled LG/TD-NF oral dose in C57BL/6 mice. After the administration of the drug, the intestines from the stomach to the ileum were excised at the designated time, and the fluorescence intensity of FITC-labeled LG was evaluated using the IVIS® spectrum (PerkinElmer). The ileum villi were stabilized using a 4% formalin solution, and both cross and longitudinal sections were prepared for immunofluorescence staining. These tissues underwent rehydration through ethanol solutions of decreasing concentrations (100%, 95%, 70%, and 50%) before being placed in distilled water. Antigen retrieval was then performed using heated citrate buffer for 1 h. This was followed by a 30 min room temperature incubation with blocking buffer and subsequent DAPI staining. The prepared villi tissues were observed via confocal laser scanning microscopy (LSM710, Carl Zeiss).
IPGTT and Glucose-Lowering Effect on db/db Model
To assess the glucose-lowering effects of the oral LG/TD-NF, C57BLKsJ-db/db male mice (7 weeks old) underwent an intraperitoneal glucose tolerance test (IPGTT). These mice were fasted for at least 8 h. Post-fasting blood glucose measurements, the mice were randomly allocated to several groups: a control group (saline, oral), an LG group (0.1 mg/kg, subcutaneous), and an LG/TD-NF group (10 mg/kg, oral). Each medication was given 30 min before the glucose injection (2 g/kg, intraperitoneal). Blood glucose levels were subsequently measured from the tail vein at set intervals (0, 30, 60, 90, and 120 min).
For the glucose-lowering effect assessment, C57BLKsJ-db/db male mice (7 weeks old) were maintained in a controlled setting until their blood glucose levels reached 500 mg/dL under standard feeding, signaling the effective onset of diabetes. Then, they were randomly divided into the following groups: a control group (saline, oral), LG (0.1 mg/kg, subcutaneous), and LG/TD-NF (10 mg/kg, oral). Measurements of food intake and body weight were done in the morning, while glucose and HbA1c levels were checked before administering the drugs.
For immunohistochemistry, after euthanizing the mice, their pancreases were extracted and fixed in a 4% formaldehyde solution. The expression of insulin and glucagon was then determined through immunofluorescence staining using the Vectra system (PerkinElmer, Massachusetts, USA).
Statistical Analysis
Statistical analyses, graphs, and visualizations were performed using Prism 9.2.0 (GraphPad, California, USA). The WinNolin 5.0.1 software (Certara, New Jersey, USA) was employed to compute pharmacokinetic parameters via non-compartmental analysis. All data are expressed as mean ± standard deviation. Differences between groups were assessed using t-tests and one-way ANOVA, with post-hoc evaluation carried out using the Tukey–Kramer test. Significance levels were set at P-values of <0.05, <0.01, and <0.001.
Results
Preparation and Characterization of LG/Bile Acid Derivatives Nanoparticles
Using a nanoprecipitation method with ethanol as the solvent, we created LG nanoparticles by merging LG with different bile acid derivatives. Using ethanol, the hydrophobic bile acid portion of the compounds was able to expose to the surface of the nanoparticles (Figure 1A). Importantly, the characteristics of the LG nanoparticles were influenced by the specific bile acid derivatives used, each having unique charged groups: negative carboxylate and sulfonate, positive amine, and various hydroxyls (Figure 1B).
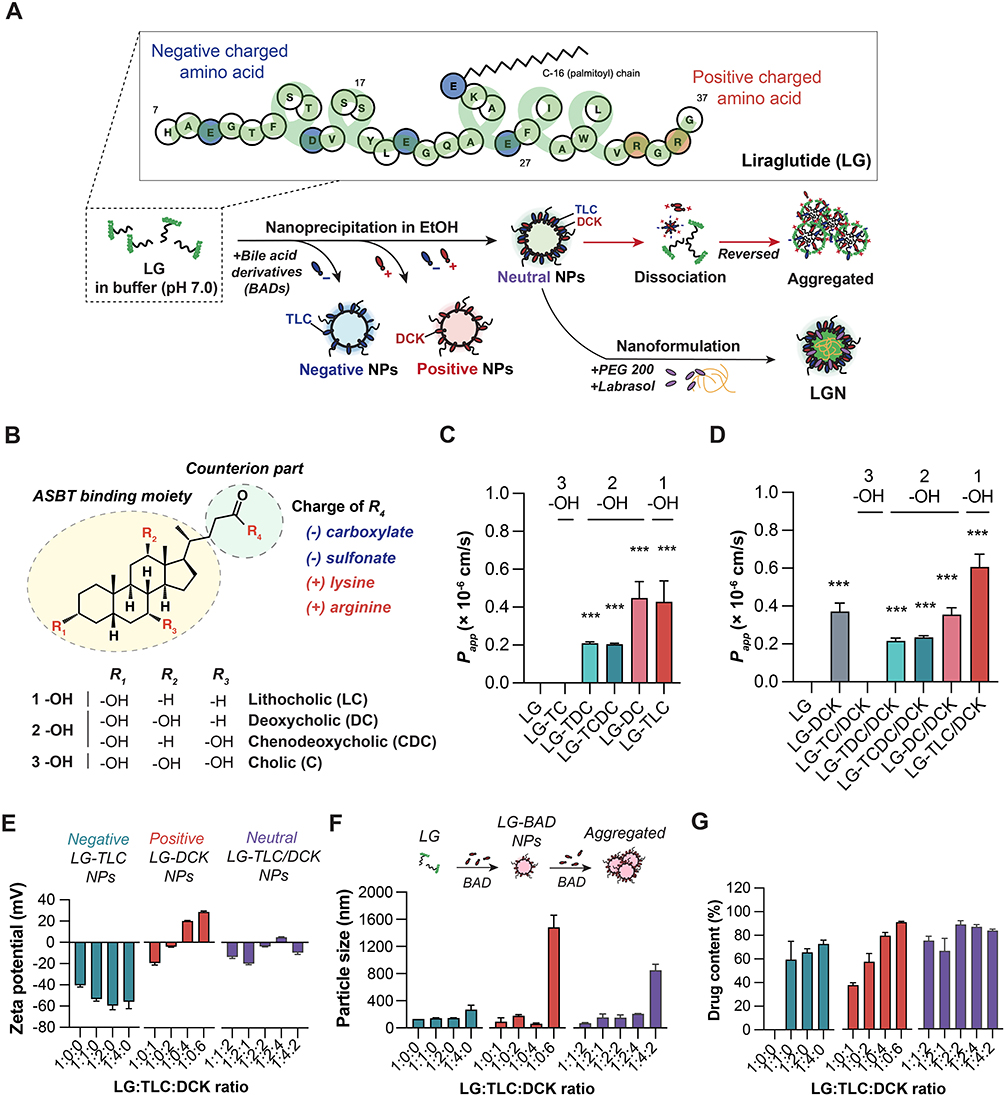 |
Figure 1 Schematic of LG/TD-NF and characteristics of LG nanoparticles with different bile acid derivatives. (A) Preparation of the LG/TD-NF. (B) Structure-specific moiety of bile acid derivatives as a counterion of LG for ASBT binding. Caco-2 permeability of LG nanoparticles with (C) negatively charged bile acid derivatives (TC, TDC, TCDC, DC, TLC) and (D) the positively charged DCK. ***P < 0.001 compared to the LG group. Characteristics of LG nanoparticles based on varying ratios of each TLC and DCK: (E) zeta potential, (F) particle size, and (G) drug content. Abbreviations: LG, liraglutide; ASBT, apical sodium-dependent bile acid transporter; TC, taurocholate; TDC, taurodeoxycholate; TCDC, taurochenodeoxycholate; DC, deoxycholate; TLC, taurolithocholate; DCK, lysine conjugated deoxycholate. Notes: Data are presented as mean ± standard deviation; n = 4 for each group. |
Assessments of the permeabilities of several LG nanoparticles were conducted using the Caco-2 cell line (Figure 1C and D). Free LG, absent any bile acid derivatives, remained undetected at the basolateral side after 2 h treatment. In contrast, LG/TLC and LG/DC nanoparticles showed permeabilities of 0.43 ± 0.11 (× 10−6 cm/s) and 0.45 ± 0.09 (× 10−6 cm/s), respectively. The introduction of positively charged DCK to LG formulations boosted permeability by 141.7% relative to LG/TLC nanoparticles; LG/DC/DCK nanoparticles were no different compared to LG/DC nanoparticles.
Additional nanoparticle refinements used zeta potential, particle size, CD spectra, and drug content metrics. The zeta potentials revealed a decrease to –59.5 ± 3.8 mV (1:2) in LG/TLC nanoparticles but an increase to 20.0 ± 0.4 mV (1:4) LG/DCK nanoparticles with increasing ratio of LG to bile acid derivatives (Figure 1E). Notably, at ratios of 1:2:2 and 1:2:4, the LG/TLC/DCK nanoparticles exhibited a charge close to neutral, registering at –4.9 ± 0.4 mV. Excessive bile acid derivatives precipitated a sharp rise in particle size of LG nanoparticles, indicating they prompt self-aggregation (Figure 1F). CD spectra confirmed that LG nanoparticles maintained ⍺-helix structural stability even with bile acid derivatives (Figure S1). Drug content in LG nanoparticles decreased as the ratio of LG to bile acid derivatives diminished (Figure 1G). However, most LG/TLC/DCK nanoparticles displayed increased drug content at ratios of 1:2:2, 1:2:4, and 1:4:2. Given the benefits to oral absorption, the LG/TLC/DCK nanoparticles (1:2:4) formulation were chosen for subsequent study, because of its small size, neutral charge, and efficient preparation.
LG/TD-NF Development
The LG/TD-NF preparation was assessed in terms of preparation efficacy, particle size, and stability. When labrasol was employed in the formulation, drug levels were higher, increasing from 87.2 ± 3.9% to 97.9 ± 1.4% compared to the labrasol-free formulation (Figure S2). Notably, 0.5% labrasol significantly augmented drug levels while also resulting in a particle size that was as minimal as 64.2 ± 8.4 nm. The in vitro cytotoxicity of LG/TD-NF and LG/TD-NF without LG was evaluated in Caco-2 cells 24 h after drug treatment. At drug concentrations ranging from 0.01 to 100 µM, which include the concentrations used in the permeability assay and cellular trafficking, no cytotoxicity of LG/TD-NF was observed (Figure S3). In simulated gastric fluid, LG showed rapid degradation when exposed to pepsin (Figure S4). However, in the absence of pepsin, LG degradation was not observed. Several nanoformulations containing PEG were tested for stability in simulated gastric fluid (Figure S4). Short-chain PEGs, specifically PEG 200 and PEG 400, in conjunction with LG, retained stabilities of 75.7 ± 8.5% and 63.0 ± 1.5% over 120 min, respectively, while LG in formulations containing higher-molecular-weight PEGs such as PEG 1000 and PEG 4000 degraded entirely within 60 min. Comparing various concentrations of PEG 200 in LG formulations, using a minimum of 20% PEG 200 was effective in preventing this degradation. Final LG nanoformulation consisting of 0.5% labrasol and 20% PEG 200 was selected for LG/TD-NF.
FE-SEM, PSD, and DOSY-NMR were used to evaluate the particle characteristics of the LG/TD-NF. The spherical nanoparticle of LG/TD-NF was shown in FE-SEM images to be smaller than that of LG/TD, but free LG and LG-F showed no particles (Figure 2A). PSD also showed that LG/TD-NF had small particle size distribution below 100 nm, whereas LG-F had a broader size distribution (Figure 2B). DOSY-NMR result supported that low diffusion rate of LG/TD-NF after nanoformulation was notably by smaller nanoparticle than that of LG (Figure 2C).
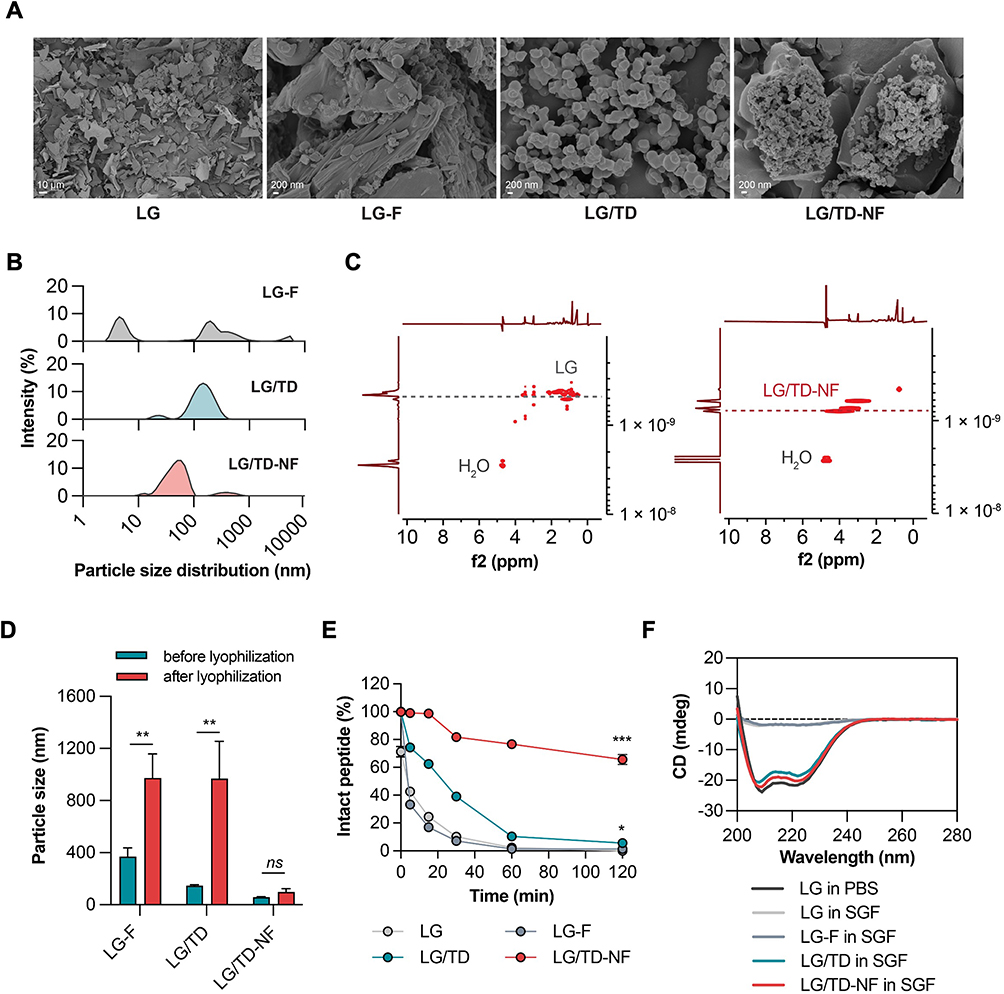 |
Figure 2 Characterizations and stability of LG/TD-NF. (A) FE-SEM image of free LG, LG-F, LG/TD, and LG/TD-NF. (B) PSD and (C) DOSY-NMR after nanoformulation. Stability of LG/TD-NF compared by (D) particle size changes after lyophilization (**P < 0.01 compared to before lyophilization), (E) drug content in simulated gastric fluid with pepsin (*P < 0.05, ***P < 0.001 compared to LG), and (F) CD spectra. Abbreviations: LG, liraglutide; FE-SEM, field-emission scanning electron microscopy; DOSY-NMR, diffusion-ordered nuclear magnetic resonance spectroscopy; CD, circular dichroism. Notes: Data are presented as mean ± standard deviation; n = 4 for each group. |
Comparatively, the stability of LG/TD-NF was assessed by considering the lyophilization process and the impact of pepsin enzyme in simulated gastric fluid. After lyophilization, the particle sizes of LG-F and LG/TD increased to 974.7 ± 183.2 nm and 968.7 ± 285.8 nm, respectively (Figure 2D). However, LG/TD-NF remained consistent at 97.3 ± 25.8 nm. Stability tests in simulated gastric fluid containing pepsin showed that most LG-F was depleted within 60 min (Figure 2E). LG/TD had 62.4 ± 0.7% remaining at 15 min but only 5.7 ± 1.9% at 120 min. In contrast, LG/TD-NF was retained at 65.7 ± 3.6% of the starting concentration after 120 min in simulated gastric fluid with pepsin. CD analysis revealed that both LG/TD and LG/TD-NF retained stable structures in simulated gastric fluid, while those of LG and LG-F had changed (Figure 2F). Therefore, leveraging LG/TD-NF bolstered the stability of LG/TD by reducing particle size and enhancing resistance to pepsin in simulated gastric fluid.
ASBT Binding of LG/TD-NF
Surface plasmon resonance was employed to discern the binding efficacy of LG/TD-NF to ASBT compared to free LG, LG-F, and LG/TD (Figure 3A). LG/TD-NF exhibited a high binding affinity to ASBT with an association/dissociation rate (Kd) of 0.436 nM, nearly akin to the 0.462 nM of LG/TD. Furthermore, the Kd values for both LG/TD and LG/TD-NF surpassed those of free LG (2.08 µM) and LG-F (0.333 µM) (Figures 3A and S5). Cellular uptake analysis was undertaken, utilizing confocal laser scanning microscopy to assess MDCK cells and ASBT-expressing MDCK cells (Figure 3B). For immunofluorescence tracking, an FITC-labeled LG compound was synthesized. There was pronounced colocalization of FITC-labeled LG with ASBT protein in MDCK cells expressing ASBT. Hence, data from both surface plasmon resonance and immunofluorescence highlighted a significant interaction between LG/TD-NF and ASBT compared to free LG. In addition, Caco-2 permeability was 8.6 ± 1.6 (× 10−6 cm/s) and 10.9 ± 2.1 (× 10−6 cm/s) for LG/TD and LG/TD-NF, respectively (Figure 3C). These outcomes signified the enhancement in LG’s cellular permeability due to the presence of bile acid derivatives.
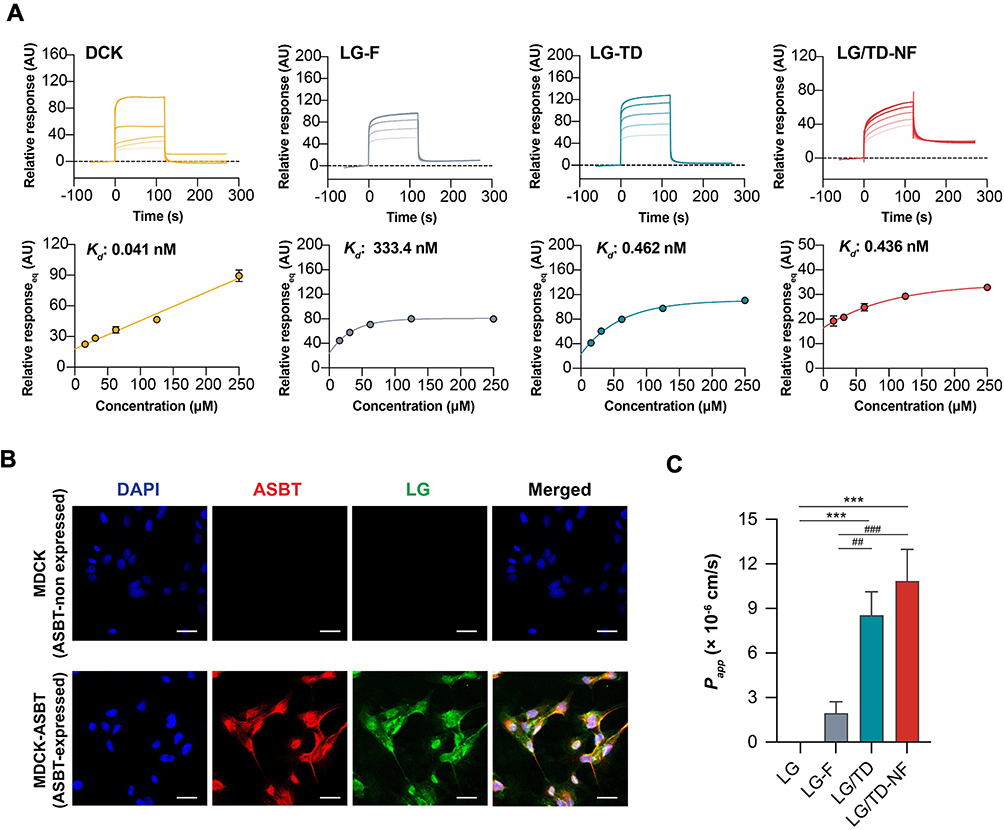 |
Figure 3 ASBT binding of the LG/TD-NF for cellular permeability. (A) Binding affinity (Kd) of DCK, LG-F, LG/TD, and LG/TD-NF to an ASBT-immobilized CM5 sensor chip by SPR, with sample concentrations ranging from 15.6 µM to 250 µM. (B) Cellular absorption of LG/TD-NF by CLSM (scale bar = 20 µm) on MDCK (ASBT non-expressed) and MDCK-ASBT (ASBT-expressed) cells and (C) Caco-2 permeability (Papp). ***P < 0.001 compared to LG, ##P < 0.05, ###P < 0.001 compared to LG-F. Abbreviations: ASBT, apical sodium-dependent bile acid transporter; DCK, lysine conjugated deoxycholate; SPR, surface plasmon resonance; CLSM, confocal laser scanning microscopy; MDCK, Madin-Darby canine kidney. Notes: Data are presented as mean ± standard deviation; n = 3 for each group. |
Cellular Trafficking of LG/TD-NF Through Endocytosis and Exocytosis Inhibitors
To deduce the endocytic mechanism underlying LG/TD-NF, the absorption inhibition rates were gauged after treatment with various endocytosis pathway inhibitors. Absorption decreased by 42.7 ± 3.5% with the ASBT inhibitor, 43.7 ± 3.1% with the EGFR inhibitor, and 53.3 ± 6.2% with the clathrin-dependent inhibitor (Figure 4A). Interestingly, the process was unaffected by both the P-gp inhibitor and clathrin-independent inhibitor. The internalization pattern of LG/TD-NF relative to ASBT and EGFR was assessed via confocal laser scanning microscopy using the SK-BR-3 cell line, which revealed the internalization of LG/TD-NF in association with ASBT and EGFR (Figure 4B and C). FITC-labeled LG/TD-NF was evident in the cytosol and membrane alongside ASBT and EGFR. Yet, when LG/TD-NF underwent treatment with gefitinib, colocalization was observed solely at the membrane with ASBT and EGFR. This suggests the significant role EGFR internalization plays in ASBT-mediated endocytosis, while EGFR inhibition by gefitinib leads to reduced ASBT internalization. Although the initial interaction between ASBT and LG/TD-NF showed notable affinity at the cellular membrane, the transport of LG/TD-NF via ASBT was obstructed due to its considerable size. Therefore, the hypothesis stands that the interaction between the bile acid components of LG/TD-NF and EGFR, which is abundant on the lipid raft corresponding to ASBT, results in EGFR phosphorylation and clathrin recruitment for ASBT/EGFR vesicle internalization (Figure 4D).
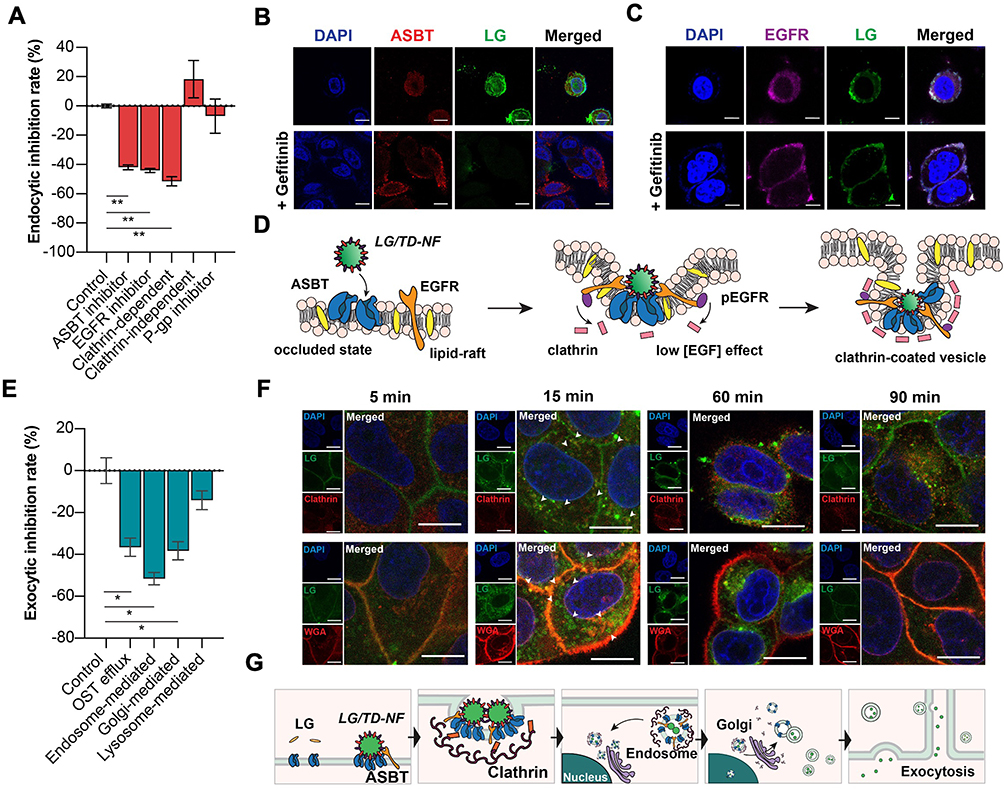 |
Figure 4 Cellular endocytic and exocytic mechanisms of trafficking LG/TD-NF. (A) Inhibition of LG/TD-NF endocytosis in Caco-2 cells using endocytic pathway inhibitors. (B and C) Inhibition of internalization of FITC-labeled LG (green) in FITC-labeled LG/TD-NF with ASBT (red) and EGFR (purple) with or without 10 µM gefitinib in SK-BR-3 cells by CLSM (scale bar = 20 µm). (D) Schematic of ASBT-mediated endocytosis of LG/TD-NF in cooperation with EGFR and clathrin. (E) Inhibition of LG/TD-NF exocytosis in Caco-2 cells with exocytosis pathway inhibitors. (F) Cellular localization in Caco-2 cells with anti-clathrin (red, top) and anti-WGA (red, bottom) at 5, 15, 60, and 90 min after treatment with FITC-labeled LG/TD-NF (green) by CLSM. (G) Schematic illustration of cellular trafficking of LG/TD-NF through ASBT-mediated transcytosis. Abbreviations: FITC, fluorescein isothiocyanate; LG, liraglutide; ASBT, apical sodium-dependent bile acid transporter; EGFR, epidermal growth factor receptor; CLSM, confocal laser scanning microscopy; OST, organic solute transporters; WGA, wheat germ agglutinin. Notes: Data are represented as mean ± standard deviation; n = 4 for each group. *P < 0.05, **P < 0.01 compared to the control group. |
Exocytic Pathway Mechanism of LG/TD-NF
To evaluate the cellular exocytic mechanism of LG/TD-NF, several exocytic pathway inhibitors were employed. The lysosome-related pathway mediates the degradation of internalized peptides, inhibiting their escape from the cell membrane. However, in this study, a lysosome-related inhibitor curtailed the transport of LG/TD-NF to the basolateral side of the membrane by about 14.1 ± 7.8% (Figure 4E). In addition, endosome-related inhibitor significantly diminished the absorption of LG/TD-NF by 52.2 ± 12.9% and Golgi apparatus-related inhibitor and OST-related inhibitor reduced absorption by 37.6 ± 5.6% and 34.9 ± 20.8%, respectively. Utilizing immunostaining, the transcytosis process of LG/TD-NF was observed over time (Figure 4F and G). Notably, 5 min after treatment, FITC-labeled LG within the LG/TD-NF was closely associated with the cellular membrane. By the 15 min mark, it synergized with clathrins to promote ASBT vesicle internalization into the cytosol. After 60 min, these vesicles were transported to the Golgi apparatus near the nucleus, and by 90 min, they were represented in the membrane.
Improved in vivo Oral Bioavailability and Intestinal Distribution
In vivo plasma exposure of LG/TD-NF was investigated in rats, considering the different formulations. Free LG (10 mg/kg, per oral) had an oral bioavailability of only 0.08 ± 0.03%. Meanwhile, that of LG-F (10 mg/kg, per oral) showed a slight increase to 0.84 ± 0.39% (Table 1). LG/TD-NF (10 mg/kg, per oral) had the highest area under the concentration–time curve from zero to infinity (AUClast) at 10.74 ± 6.06 µg·h/mL and highest plasma Cmax at 1.57 ± 0.83 µg·h/mL, with an oral bioavailability of 3.62 ± 2.04% (Figure 5 and Table 1). When administered orally, it was quickly absorbed within 4 h, in contrast with a 10 h absorption period for the subcutaneous route. Moreover, the Tmax for LG/TD-NF was delayed by 4 h, differing from the 2 h Tmax of LG-F. These observations point to the ability of the nanoformulation to prolong the absorption duration of LG.
 |
Table 1 Pharmacokinetic Parameters of Oral LG/TD-NF |
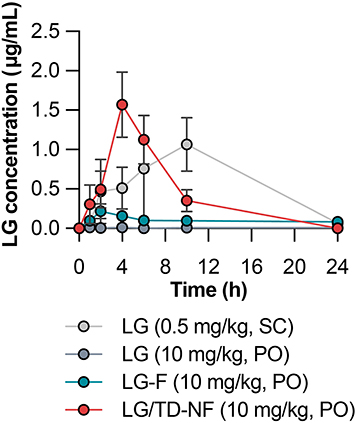 |
Figure 5 Pharmacokinetic profiles of LG concentration over time following the administration of subcutaneous LG (0.5 mg/kg, SC), free LG (10 mg/kg, PO), LG-F (10 mg/kg, PO), and oral nanoformulation LG/TD-NF (10 mg/kg, PO). Abbreviations: LG, liraglutide; SC, subcutaneous; PO, per oral. Notes: Data are represented as mean ± standard deviation; n = 4 for each group. |
Next, we analyzed the in vivo intestinal absorption and distribution of oral LG/TD-NF. C57BL/6 mice were orally administered FITC-labeled LG/TD-NF or unformulated FITC-labeled LG for assessment. After administration, FITC-labeled LG retention was examined at intervals of 0.5, 1, 2, and 4 h, visualized in both longitudinal and transverse sections of the ileum’s villi via confocal laser scanning microscopy (LSM710, Carl Zeiss). Unformulated FITC-labeled LG showed a faint signal only in the epithelial mucous layer at the 0.5 and 1 h marks. Conversely, FITC-labeled LG/TD-NF displayed a strong sustained intensity in the intestine for 2 h (Figure 6A and B), observed both within the villi and beyond the mucous layer.
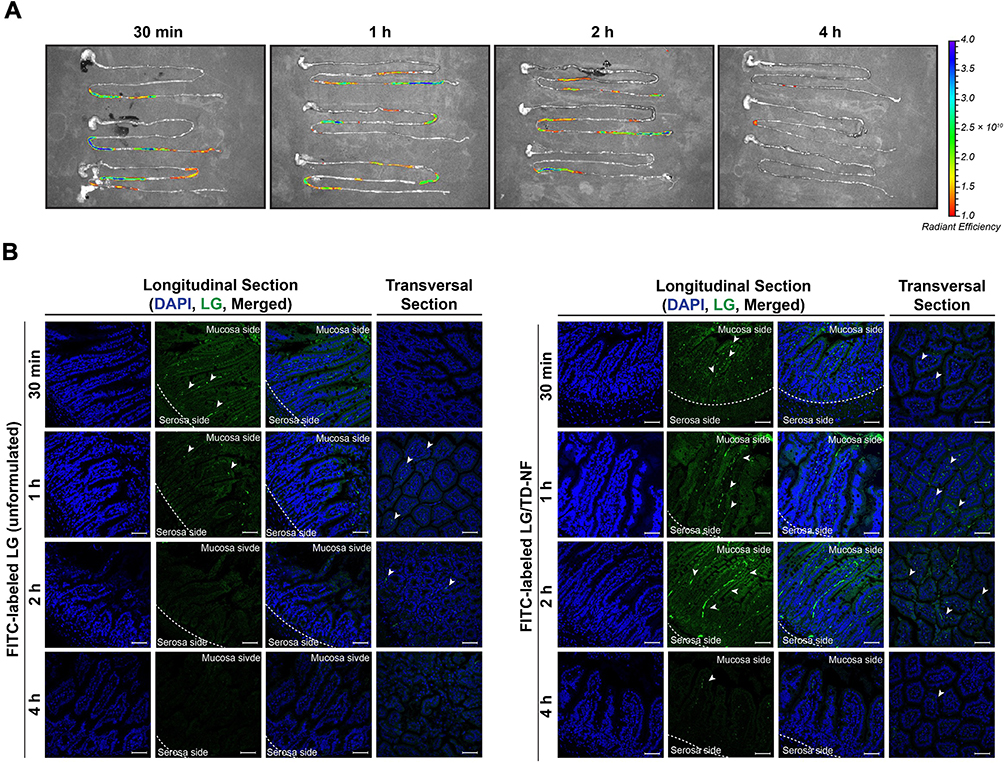 |
Figure 6 Distribution of FITC-labeled LG in the GI tract and ileum of mice over time. (A) IVIS spectrum of FITC-labeled LG/TD-NF in the GI tract and (B) representative confocal microscopy images (scale bar = 50 µm) with longitudinal and transversal sections of the ileum at 0.5, 1, 2, and 4 h after administration of FITC-labeled LG without formulation and FITC-labeled LG/TD-NF (10 mg/kg). White arrow indicates the absorbed FITC-labeled LG. Abbreviations: FITC, fluorescein isothiocyanate; GI, gastrointestinal; IVIS, in vivo imaging system; LG, liraglutide. Notes: n = 3 for each group. |
Glucose-Lowering Effect of LG/TD-NF in the db/db Model
The therapeutic impact of oral LG/TD-NF was assessed using the C57BLKsJ-db/db mouse model. For a quick assessment of glucose sensitivity, IPGTT was conducted. Prior to glucose administration, both oral LG/TD-NF (10 mg/kg) and subcutaneous LG (0.1 mg/kg) were given to mice, with a 30 min interval. A control group was given saline for comparison. The control group had the highest blood glucose level 30 min after glucose injection. In contrast, the LG/TD-NF group exhibited glucose levels comparable to the subcutaneous LG group within this timeframe (Figure 7A). Moreover, the long-term glucose-lowering performance of LG/TD-NF over 28 days was tracked using blood glucose and HbA1c analysis. Daily parameters such as food intake and body weight were recorded, along with glucose and HbA1c data, before administering either subcutaneous LG (0.1 mg/kg) or oral LG/TD-NF (10 mg/kg) (Figure 7B). The fasting glucose levels of the control group consistently exceeded 500 mg/dL throughout the 28 days. However, glucose levels in the oral LG/TD-NF and subcutaneous LG groups decrease by 34.6 ± 34.2% and 32.9 ± 23.5% from their starting values, respectively, by day 28 (Figure 7C). The measurement of HbA1c is used in the diagnosis of diabetes, and a level of 6.5% or more is considered a criterion for diabetes.39 HbA1c levels at the 28-day mark remained <6.5% in all treatment groups, signifying normal in the context of diabetes management (Figure 7D). The LG/TD-NF group showed a significant decrease in HbA1c by 4.1 ± 0.4%, while the levels in controls surged to 11.4 ± 0.5% by the experiment’s conclusion. Subcutaneous LG also had notable glucose-lowering effects, reducing HbA1c by 4.7 ± 0.5%. Importantly, oral administration resulted in lower body weight and food intake compared to the subcutaneous route (Figure 7E and F). The accumulated food intakes were assessed based on individual food intakes. As a result, there was a clear difference between the groups in the absolute consumption of accumulated food over time, and on the last day, the average accumulated food intake was 106 ± 15.5 g for the control group, 90.6 ± 12.0 g for LG (0.1 mg/kg, SC), and 81.5 ± 16.3 g for LG/TD-NF (10 mg/kg, PO). Thus, compared to the control group, there was a 14.6% decrease in food intake for LG (SC) and a 23.2% decrease for LG/TD-NF (PO), leading to the conclusion that orally administered LG nanoformulation induces a reduction in food intake.
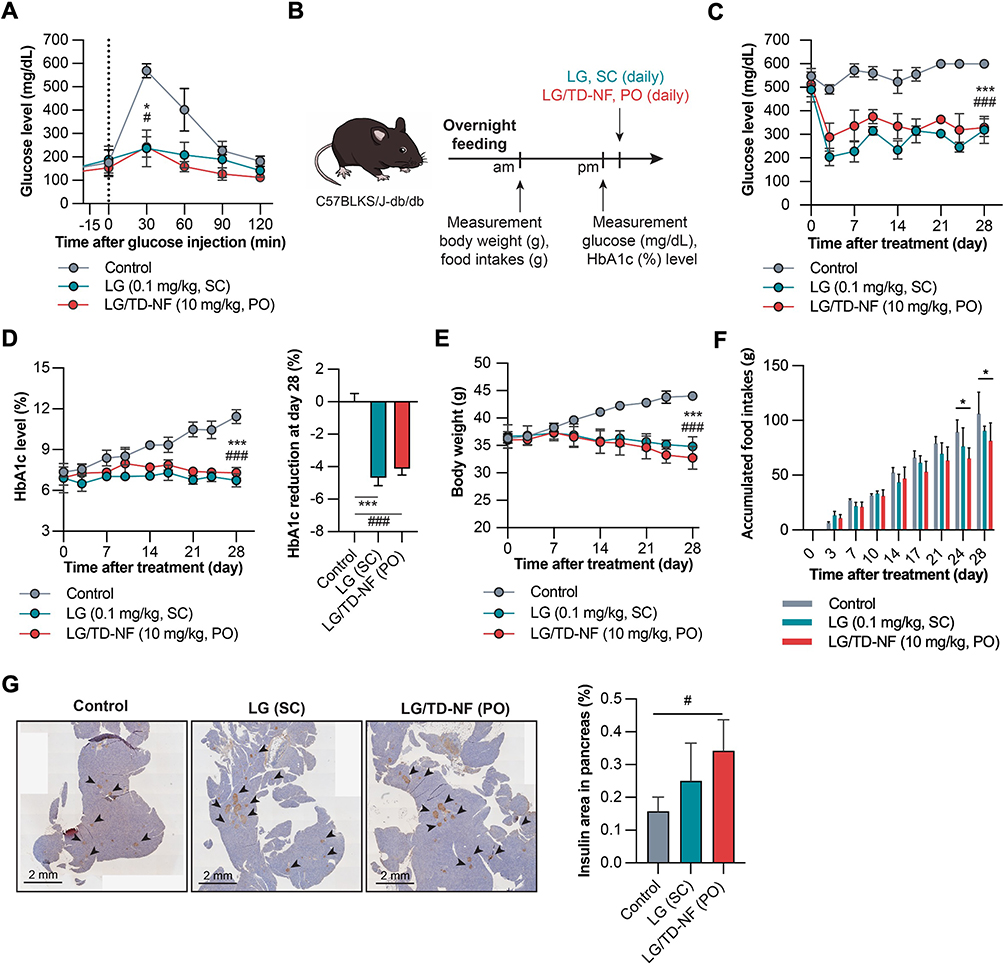 |
Figure 7 In vivo glucose-lowering effects in C57BLKS/J-db/db mice. (A) IPGTT for glucose sensitivity of oral LG/TD-NF (10 mg/kg) compared to subcutaneous LG (0.1 mg/kg). (B) Treatment and monitoring schedule over 28 days. Changes in the levels of (C) glucose, (D) HbA1c, (E) body weight, and (F) Individual accumulated food intake over 28 days with control (saline, PO), subcutaneous LG (0.1 mg/kg, SC), and oral LG/TD-NF (10 mg/kg, PO). (G) Immunofluorescence staining of insulin (black arrow) in the pancreas and quantification of the area on the last day. Abbreviations: IPGTT, intraperitoneal glucose tolerance test; LG, liraglutide; PO, per oral; SC, subcutaneous. Notes: Data are presented as mean ± standard deviation (n = 4); *P < 0.05, ***P < 0.001 LG compared to the control group, #P < 0.05, ###P < 0.001 LG/TD-NF compared to the control group. |
Immunohistochemical staining of pancreatic sections was conducted to study the effects on pancreatic α and β cells (Figures 7G and S6). Oral LG/TD-NF led to more widespread insulin distribution in the pancreas than subcutaneous LG. Thus, oral LG/TD-NF led to reductions in glucose, HbA1c levels, and body weight, which may be attributable to increased β-cell proliferation in the pancreas.
Endocytosis of LG/TD-NF Mediated by ASBT and EGFR
A novel nanoformulation using bile acid derivatives was developed for oral administration with the goal of augmenting cellular absorption of LG through inherent cellular transport mechanisms. To achieve this, the bile acid moiety was oriented on the external surface of the nanoparticles using the nano-precipitation method, promoting interaction with ASBT (Figure 8). Although nanoparticles ensured considerable contact with the ASBT on epithelial cells, the LG/TD formulation was notably unstable incorporating labrasol and PEG 200 in the nanoformulation enhanced the stability of LG/TD-NF, thereby increasing their binding affinity with ASBT. Subsequently, LG/TD-NF exhibited strong binding to ASBT, promoting effective ASBT-mediated transcytosis. Both the inclusion of EGFR and subsequent endosomal escape played roles in this mechanism. As a result, a heightened absorption of LG into the systemic circulation was noted.
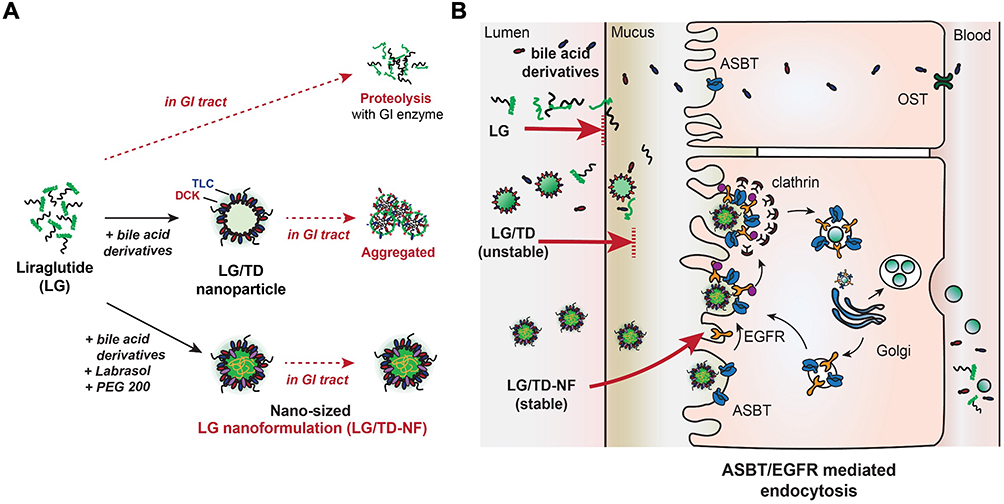 |
Figure 8 Schematic of oral LG/TD-NF and the mechanism of cellular transcytosis. (A) Design of the oral LG/TD-NF with bile acid derivatives to facilitate ASBT-mediated endocytosis in collaboration with EGFR, and to increase stability in the GI tract. (B) ASBT-mediated endocytosis of the oral LG/TD-NF in cooperation with EGFR. Abbreviations: LG, liraglutide; ASBT, apical sodium-dependent bile acid transporter; EGFR, epidermal growth factor receptor. |
Discussion
We engineered a novel nanoformulation to address the challenges inherent to oral peptide administration. It is crucial for LG/TD-NF to have a bile acid moiety situated at its outer surface to interact with ASBT. The traditional preparation method, which employs distilled water to augment charge density, led to the formation of irregular, nonfunctional nanoparticle aggregates characterized by a hydrophobic bile acid-core. To overcome this, we adopted the nanoprecipitation approach using two solutions: an ethanol solution for bile acid dissolution and prevention of the fatty acid of LG from forming a lipid core and a buffer solution to ensure that the peptide was fully dissolved. Observations from permeability tests using Caco-2 cells revealed that bile acid derivatives with few hydroxyl groups and strong charges (eg, TLC) had superior permeability (Figure 1). Considering the significance of charge and particle size for nanoparticle penetration through intestinal epithelial cells, neutrally charged nano-sized LG/TD was chosen, based on zeta potential and PSD findings. The present challenge in oral peptide formulation is to devise a method to introduce oral peptides to systemic circulation while preserving their pharmacological integrity, given the susceptibility of peptides to degradation by GI enzymes such as pepsin, serine protease, and trypsin.40 Peptide formulations, when paired with functional excipients, shield peptides from proteolytic enzymes in mucus, aiding their penetration of the intestinal mucous layer.41–43 Specifically, PEG can stabilize particles by decreasing their propensity to bind to proteolytic enzymes in the mucus, enhancing the chances of NPs reaching the epithelial surface.44 Notably, hydrophilic PEG variants such as PEG 200 and PEG 400 resist enzyme binding, potentially boosting mucosal penetration of LG/TD-NF, which then more effectively access the epithelial surface. A distinct challenge for LG nanoformulation development is the instability of bile acid derivatives, which revert to a hydrophobic bile core and aggregate in aqueous environments. However, labrasol proved efficacious for crafting more stable LG nanoformulation, leading to the formation of dense nano-sized LG/TD-NF nanoparticle. Data from FE-SEM, PSD, and DOSY-NMR analyses underscored that LG/TD-NF more successfully formed a nano-sized, dense particle compared to LG-F or LG/TD, which translated to enhanced stability (Figure 2).
Historically, ASBT has been perceived as a promising target transporter for orally inactive compounds, including macromolecules. From an absorption mechanism perspective, small molecules paired with bile acids can seamlessly pass through the epithelium via ASBT pathway. Unfortunately, this is not the case for macromolecules. The ASBT-mediated transcytosis mechanism includes vesicle formation and internalization,21,45 but the intricacies of the process remain unclear. Our research elucidates the mechanism. We found that both LG/TD and LG/TD-NF had enhanced ASBT-binding affinities and association/dissociation rates attributable to the interaction between bile acid moieties at the surface and ASBT, in stark contrast to the minimal interactions between LG and LG-F (due to their pronounced hydrophilic properties and significant molecular weights; Figures 3 and S5). Further evidence from other analyses confirmed that the elevated cellular uptakes and permeability stemmed from ASBT binding.
ASBT is a primary bile acid transporter within the solute carrier family. While it can transport bile acids and their derivatives in an energy-independent manner, there have been few reports of the internalization of the transporters themselves. In a related discovery, another bile acid transporter, NTCP, also a member of the SLC family, was found to undergo internalization in conjunction with EGFR and clathrin.31,32 EGFR, a type of G-protein coupled receptor, can be internalized or signaled by bile acids.33,34 Its internalization process is determined by EGF concentrations and can either follow a clathrin-mediated endosomal pathway or a lysosomal route.46–48 Taking these mechanisms into account suggests a potential new internalization route for the LG nanoformulation. Bile acids, although not as potent as high EGF concentrations, can induce clathrin-mediated endocytosis in the presence of low EGF concentrations.49 Experiments using endocytic pathway inhibitors showed that the absorption of the LG/TD-NF was heavily influenced by interactions with ASBT, EGFR, and clathrin (Figure 4). Furthermore, the EGFR inhibitor gefitinib blocked the cellular uptake of the LG/TD-NF via both the EGFR and ASBT pathways, highlighting the interconnectedness of the ASBT-mediated endocytosis process and EGFR.
Within the broader framework of cellular endocytic mechanisms, this nanoformulation increased the binding affinity of LG to ASBT at the epithelial surface. It also amplified vesicular internalization by ASBT when in association with EGFR. This combined effect led to enhanced cellular absorption of LG. EGFR is involved in the clathrin-dependent endocytic pathway and is also linked with the endosomal-mediated and Golgi-associated exocytotic pathways.50 The internalized EGFR vesicle typically uses the endosomal escape mechanism to recycle EGFR without subjecting it to lysosomal degradation.51 In exocytosis analyses, both endosome- and Golgi-mediated inhibitors restricted the release of the LG vesicle across the cell membrane (Figure 4). This suggests that the LG/TD-NF, once internalized via ASBT/EGFR endocytosis, predominantly follows the early endosome and trans-Golgi network pathway instead of the lysosomal route. Confocal microscopy demonstrated that ASBT/EGFR vesicles began internalizing between 5 and 15 min, dispersing across the cytosol at 15 min and congregating near the nucleus by the 60 min mark. FITC-labeled LG/TD-NF in the cytosol reappeared at the membrane around 90 min. This indicates that the internalized FITC-labeled LG/TD-NF bypassed the lysosomal degradation pathway, courtesy of ASBT/EGFR, facilitating endosomal escape and subsequent transcytosis. In subsequent investigations, the LG/TD-NF showed improved Caco-2 permeability in vitro and enhanced absorption in vivo (Figure 5), establishing a link between in vitro permeability and in vivo absorption rates. Along with enhanced bioavailability, the slower absorption of LG/TD-NF in the ileum bolstered oral absorption (Figure 6). As depicted in Figure 2, LG without a nanoformulation is susceptible to rapid degradation by pepsin in gastric fluid, highlighting a significant instability before the drug can be absorbed at the cellular level in vivo. This instability has the potential to significantly affect the consistency of the drug’s oral absorption profile. Consequently, adjusting the stomach pH to a neutral level is essential to reduce these risks and stabilize the absorption profile of LG/TD-NF. In a clinical setting, the administration of enteric-coated formulations is likely to result in a delay in Tmax. Ongoing research into enteric drug delivery systems is aimed at circumventing the acidic gastric environment, which is likely to enhance the effectiveness of the drug’s absorption profile.
The IPGTT test was used to assess glucose sensitivity of the oral LG/TD-NF in a diabetic (C57BLKsJ-db/db) model. The results for oral LG/TD-NF (10 mg/kg) paralleled those of subcutaneous LG (0.1 mg/kg) following a singular administration (Figure 7). Given that noninvasive routes such as oral administration necessitate recurrent dosing to attain a steady-state concentration, a pronounced glucose-lowering effect was anticipated over extended oral formulation use. The oral LG/TD-NF consistently reduced blood glucose levels, with accumulated glucose-lowering impacts maintaining HbA1c levels comparable to the subcutaneous LG. Over the long term, the glucose-lowering efficacy of the oral LG/TD-NF might surpass that of subcutaneous LG by bolstering patient compliance and mitigating invasive risks. In addition, the GLP-1A facilitated insulin release from pancreatic β cells into the systemic circulation.52 As oral LG/TD-NF led to higher insulin levels in β cells than did subcutaneous LG by day 28. The superior glucose-lowering effect of this oral LG/TD-NF is considered to be due to the bile acids used in the nanoformulation stimulating GLP-1 in the GI tract and modulating plasma glucose levels.37,53–55 An oral GLP-1A, combined with this nanoformulation, might induce indirect glycemic effects, possibly triggering the secretion of gut hormones, including GLP-1 and glucose-dependent insulinotropic polypeptide (GIP), among others. Consequently, this suggests that our nanoformulation serves not merely as a vehicle for drug delivery but also has an impact on pancreatic beta-cell proliferation and potentially enhances GIP hormone activity. These findings underscore the potential benefits of our oral GLP-1 nanoformulation. Meanwhile, in this study, oral LG/TD-NF over a period of 28 days demonstrated significant glucose-lowering efficacy and safety without fatality. It is deemed necessary to conduct a study over a longer term than 28 days. These disease mice, which is model of leptin deficiency, displays a much more rapid progression of diabetes compared to humans. Consequently, the context of the disease at the time of drug administration would greatly affect the efficacy of the GLP-1A. However, since the protocols for long-term research on GLP-1A in db/db mice are not yet well established, there appears to be a need for additional time to validate methods. Our study thus centered on exploring the potential for oral delivery of peptide therapeutics, focusing on enhancing oral bioavailability and unraveling the mechanisms behind their absorption. Therefore, the glucose-lowering effect in db/db mice was measured over a period of 28 days. Subsequent research will focus on a more extensive exploration of potential benefits, encompassing the analysis of drug efficacy, insulin sensitivity, gastric emptying rates, and lipid metabolism. Moreover, evaluations of the safety profile are planned following 8 and 12 weeks of variably dosed daily oral GLP-1A therapy.
Studies that have employed pathway inhibitors have demonstrated that the ASBT-mediated absorption process is closely associated with EGFR and clathrin, both of which are crucial for vesicle formation. Although it is uncommon for transporters to induce endocytosis autonomously, there have been reports where ASBT was involved in endocytosis with vesicles. However, the exact behavior of ASBT at the cellular level remains to be fully clarified. Surface plasmon resonance findings concerning the LG/TD-NF revealed a notable enhancement in binding affinity to ASBT when incorporated into the nanoformulation. Confocal laser scanning microscopy results indicated that the LG/TD-NF undergoes internalization via an association with EGFR. During this procedure, clathrins assemble, leading to the creation of vesicles combined with ASBT/EGFR. The endosomal escape of this transporter is facilitated via pathways involving the Golgi and endoplasmic reticulum in proximity to the nucleus. This demonstrates how EGFR collaborates with the ASBT-mediated transcytosis process. The inclusion of labrasol and PEG 200 in the nanoformulation enhanced the retention of LG/TD-NF within the epithelium and bolstered its stability in simulated gastric fluid. As a result, the LG/TD-NF amplified oral bioavailability and exhibited consistent glucose sensitivity and glucose-lowering impacts on db/db mice, paralleling the outcomes of subcutaneous LG. Furthermore, by clarifying the absorption mechanism, this study shows that the oral nanoformulation strategy using these bile acids could be applicable to additional acylated GLP-1 agonists, such as semaglutide.
Conclusion
A stable oral nanoformulation of LG was successfully developed using bile acid derivatives, and its endocytosis mechanism was elucidated. Both ASBT and EGFR are involved, leading to enhanced oral bioavailability and a glucose-lowering effect comparable to subcutaneous LG. Despite the inherent physiological challenges within the GI tract for peptides, this novel oral nanoformulation efficiently transported LG into the systemic circulation without the need for chemical modifications, thus offering cost and time savings from a biopharmaceutical perspective. This oral LG/TD-NF represents a promising therapeutic approach for diabetes, emphasizing medication adherence, enhanced patient quality of life, and minimized injection-associated risks. It potentially extends the realm of oral GLP-1A development and the broader scope of oral biologic therapeutics as alternatives to injections.
Acknowledgments
This research received support from the Korea Drug Development Fund (HN21C0264) sponsored by the Ministry of Science and ICT (MSIT), Ministry of Trade, Industry, and Energy, and Ministry of Health and Welfare. This work was also supported by the National Research Foundation of Korea (NRF) grant funded by the Korea government (MSIT) (grant nos. 2020R1A2C2015026, 2022R1A5A8033794) and the BK21 FOUR Program of the NRF, sponsored by the Ministry of Education.
Disclosure
The authors declare that there are no conflicts of interest associated with this work.
References
1. Kahn SE, Cooper ME, Del Prato S. Pathophysiology and treatment of type 2 diabetes: perspectives on the past, present, and future. Lancet. 2014;383(9922):1068–1083. doi:10.1016/S0140-6736(13)62154-6
2. Knudsen LB. Glucagon-like peptide-1: the basis of a new class of treatment for type 2 diabetes. J Med Chem. 2004;47(17):4128–4134. doi:10.1021/jm030630m
3. Balena R, Hensley IE, Miller S, Barnett AH. Combination therapy with GLP-1 receptor agonists and basal insulin: a systematic review of the literature. Diabetes Obes Metab. 2013;15(6):485–502. doi:10.1111/dom.12025
4. Muttenthaler M, King GF, Adams DJ, Alewood PF. Trends in peptide drug discovery. Nat Rev Drug Discov. 2021;20(4):309–325. doi:10.1038/s41573-020-00135-8
5. Jacobsen LV, Flint A, Olsen AK, Ingwersen SH. Liraglutide in type 2 diabetes mellitus: clinical pharmacokinetics and pharmacodynamics. Clin Pharmacokinet. 2016;55(6):657–672. doi:10.1007/s40262-015-0343-6
6. Evers A, Haack T, Lorenz M, et al. Design of novel exendin-based dual glucagon-like peptide 1 (GLP-1)/glucagon receptor agonists. J Med Chem. 2017;60(10):4293–4303. doi:10.1021/acs.jmedchem.7b00174
7. Dalsgaard NB, Vilsbøll T, Knop FK. Effects of glucagon-like peptide-1 receptor agonists on cardiovascular risk factors: a narrative review of head-to-head comparisons. Diabetes Obes Metab. 2018;20(3):508–519. doi:10.1111/dom.13128
8. Boye K, Ross M, Mody R, Konig M, Gelhorn H. Patients’ preferences for once-daily oral versus once-weekly injectable diabetes medications: the REVISE study. Diabetes Obes Metab. 2021;23(2):508–519. doi:10.1111/dom.14244
9. Igarashi A, Bekker Hansen B, Langer J, et al. Preference for oral and injectable GLP-1 RA therapy profiles in Japanese patients with type 2 diabetes: a discrete choice experiment. Adv Ther. 2021;38(1):721–738. doi:10.1007/s12325-020-01561-1
10. Noh G, Keum T, Bashyal S, et al. Recent progress in hydrophobic ion-pairing and lipid-based drug delivery systems for enhanced oral delivery of biopharmaceuticals. J Pharm Investig. 2022;52(1):75–93. doi:10.1007/s40005-021-00549-5
11. Brown TD, Whitehead KA, Mitragotri S. Materials for oral delivery of proteins and peptides. Nat Rev Mater. 2020;5(2):127–148. doi:10.1038/s41578-019-0156-6
12. Buckley ST, Bækdal TA, Vegge A, et al. Transcellular stomach absorption of a derivatized glucagon-like peptide-1 receptor agonist. Sci Transl Med. 2018;10(467):eaar7047. doi:10.1126/scitranslmed.aar7047
13. Biermasz NR. New medical therapies on the horizon: oral octreotide. Pituitary. 2017;20(1):149–153. doi:10.1007/s11102-016-0785-3
14. Granhall C, Donsmark M, Blicher TM, et al. Safety and pharmacokinetics of single and multiple ascending doses of the novel oral human GLP-1 analogue, oral semaglutide, in healthy subjects and subjects with type 2 diabetes. Clin Pharmacokinet. 2019;58(6):781–791. doi:10.1007/s40262-018-0728-4
15. Pangeni R, Subedi L, Jha SK, et al. Improvements in the oral absorption and anticancer efficacy of an oxaliplatin-loaded solid formulation: pharmacokinetic properties in rats and nonhuman primates and the effects of oral metronomic dosing on colorectal cancer. Int J Nanomed. 2020;15:7719–7743. doi:10.2147/IJN.S267424
16. Jha SK, Chung JY, Pangeni R, et al. Enhanced antitumor efficacy of bile acid-lipid complex-anchored docetaxel nanoemulsion via oral metronomic scheduling. J Control Release. 2020;328:368–394. doi:10.1016/j.jconrel.2020.08.067
17. Thapa RK, Kim JO. Nanomedicine-based commercial formulations: current developments and future prospects. J Pharm Investig. 2023;53(1):19–33. doi:10.1007/s40005-022-00607-6
18. Kim KS, Suzuki K, Cho H, Youn YS, Bae YH. Oral nanoparticles exhibit specific high-efficiency intestinal uptake and lymphatic transport. ACS Nano. 2018;12(9):8893–8900. doi:10.1021/acsnano.8b04315
19. Kim D, Jin L, Park EJ, et al. Peptide permeation enhancers for improving oral bioavailability of macromolecules. J Pharm Investig. 2023;53(1):59–72. doi:10.1007/s40005-022-00609-4
20. Drucker DJ. Advances in oral peptide therapeutics. Nat Rev Drug Discov. 2020;19(4):277–289. doi:10.1038/s41573-019-0053-0
21. Al-Hilal TA, Chung SW, Alam F, et al. Functional transformations of bile acid transporters induced by high-affinity macromolecules. Sci Rep. 2014;4:4163. doi:10.1038/srep04163
22. Deng F, Kim KS, Moon J, Bae YH. Bile acid conjugation on solid nanoparticles enhances asbt-mediated endocytosis and chylomicron pathway but weakens the transcytosis by inducing transport flow in a cellular negative feedback loop. Adv Sci. 2022;9(21):e2201414. doi:10.1002/advs.202201414
23. Deng F, Han Bae Y. Lipid raft-mediated and upregulated coordination pathways assist transport of glycocholic acid-modified nanoparticle in a human breast cancer cell line of SK-BR-3. Int J Pharm. 2022;617:121589. doi:10.1016/j.ijpharm.2022.121589
24. Grosser G, Müller SF, Kirstgen M, Döring B, Geyer J. Substrate specificities and inhibition pattern of the solute carrier family 10 members NTCP, ASBT and SOAT. Front Mol Biosci. 2021;8:689757. doi:10.3389/fmolb.2021.689757
25. Kullak-Ublick GA, Glasa J, Böker C, et al. Chlorambucil-taurocholate is transported by bile acid carriers expressed in human hepatocellular carcinomas. Gastroenterology. 1997;113(4):1295–1305. doi:10.1053/gast.1997.v113.pm9322525
26. Slijepcevic D, van de Graaf SF. Bile acid uptake transporters as targets for therapy. Dig Dis. 2017;35(3):251–258. doi:10.1159/000450983
27. Park J, Choi JU, Kim K, Byun Y. Bile acid transporter mediated endocytosis of oral bile acid conjugated nanocomplex. Biomaterials. 2017;147:145–154. doi:10.1016/j.biomaterials.2017.09.022
28. Ni Y, Lempp FA, Mehrle S, et al. Hepatitis B and D viruses exploit sodium taurocholate co-transporting polypeptide for species-specific entry into hepatocytes. Gastroenterology. 2014;146(4):1070–1083. doi:10.1053/j.gastro.2013.12.024
29. Goutam K, Ielasi FS, Pardon E, Steyaert J, Reyes N. Structural basis of sodium-dependent bile salt uptake into the liver. Nature. 2022;606(7916):1015–1020. doi:10.1038/s41586-022-04723-z
30. Park JH, Iwamoto M, Yun JH, et al. Structural insights into the HBV receptor and bile acid transporter NTCP. Nature. 2022;606(7916):1027–1031. doi:10.1038/s41586-022-04857-0
31. Iwamoto M, Saso W, Sugiyama R, et al. Epidermal growth factor receptor is a host-entry cofactor triggering hepatitis B virus internalization. Proc Natl Acad Sci U S A. 2019;116(17):8487–8492. doi:10.1073/pnas.1811064116
32. Iwamoto M, Saso W, Nishioka K, et al. The machinery for endocytosis of epidermal growth factor receptor coordinates the transport of incoming hepatitis B virus to the endosomal network. J Biol Chem. 2020;295(3):800–807. doi:10.1016/S0021-9258(17)49936-4
33. Svegliati-Baroni G, Ridolfi F, Hannivoort R, et al. Bile acids induce hepatic stellate cell proliferation via activation of the epidermal growth factor receptor. Gastroenterology. 2005;128(4):1042–1055. doi:10.1053/j.gastro.2005.01.007
34. Dossa AY, Escobar O, Golden J, Frey MR, Ford HR, Gayer CP. Bile acids regulate intestinal cell proliferation by modulating EGFR and FXR signaling. Am J Physiol Gastrointest Liver Physiol. 2016;310(2):G81–G92. doi:10.1152/ajpgi.00065.2015
35. Beduneau A, Tempesta C, Fimbel S, et al. A tunable Caco-2/HT29-MTX co-culture model mimicking variable permeabilities of the human intestine obtained by an original seeding procedure. Eur J Pharm Biopharm. 2014;87(2):290–298. doi:10.1016/j.ejpb.2014.03.017
36. Patching SG. Surface plasmon resonance spectroscopy for characterisation of membrane protein-ligand interactions and its potential for drug discovery. Biochim Biophys Acta. 2014;1838(1 Pt A):43–55. doi:10.1016/j.bbamem.2013.04.028
37. Kuhre RE, Wewer Albrechtsen NJ, Larsen O, et al. Bile acids are important direct and indirect regulators of the secretion of appetite- and metabolism-regulating hormones from the gut and pancreas. Mol Metab. 2018;11:84–95. doi:10.1016/j.molmet.2018.03.007
38. Jiang LQ, Wang TY, Wang Y, Wang ZY, Bai YT. Co-disposition of chitosan nanoparticles by multi types of hepatic cells and their subsequent biological elimination: the mechanism and kinetic studies at the cellular and animal levels. Int J Nanomed. 2019;14:6035–6060. doi:10.2147/IJN.S208496
39. Colagiuri S, Lee CM, Wong TY, et al. Glycemic thresholds for diabetes-specific retinopathy: implications for diagnostic criteria for diabetes. Diabetes Care. 2011;34(1):145–150. doi:10.2337/dc10-1206
40. Goldberg M, Gomez-Orellana I. Challenges for the oral delivery of macromolecules. Nat Rev Drug Discov. 2003;2(4):289–295. doi:10.1038/nrd1067
41. Zhang X, Cheng H, Dong W, et al. Design and intestinal mucus penetration mechanism of core-shell nanocomplex. J Cont Release. 2018;272:29–38. doi:10.1016/j.jconrel.2017.12.034
42. Liao R, Pon J, Chungyoun M, Nance E. Enzymatic protection and biocompatibility screening of enzyme-loaded polymeric nanoparticles for neurotherapeutic applications. Biomaterials. 2020;257:120238. doi:10.1016/j.biomaterials.2020.120238
43. Fan W, Wei Q, Xiang J, et al. Mucus penetrating and cell-binding polyzwitterionic micelles as potent oral nanomedicine for cancer drug delivery. Adv Mater. 2022;34(16):e2109189. doi:10.1002/adma.202109189
44. Xu Q, Ensign LM, Boylan NJ, et al. Impact of surface polyethylene glycol (PEG) density on biodegradable nanoparticle transport in mucus ex vivo and distribution in vivo. ACS Nano. 2015;9(9):9217–9227. doi:10.1021/acsnano.5b03876
45. Deng F, Bae YH. Bile acid transporter-mediated oral drug delivery. J Cont Release. 2020;327:100–116. doi:10.1016/j.jconrel.2020.07.034
46. Wang YN, Yamaguchi H, Hsu JM, Hung MC. Nuclear trafficking of the epidermal growth factor receptor family membrane proteins. Oncogene. 2010;29(28):3997–4006. doi:10.1038/onc.2010.157
47. Tanaka T, Zhou Y, Ozawa T, et al. Ligand-activated epidermal growth factor receptor (EGFR) signaling governs endocytic trafficking of unliganded receptor monomers by non-canonical phosphorylation. J Biol Chem. 2018;293(7):2288–2301. doi:10.1074/jbc.M117.811299
48. Chen SW, Himeno M, Koui Y, et al. Modulation of hepatitis B virus infection by epidermal growth factor secreted from liver sinusoidal endothelial cells. Sci Rep. 2020;10(1):14349. doi:10.1038/s41598-020-71453-5
49. Aguilar RC, Wendland B. Endocytosis of membrane receptors: two pathways are better than one. Proc Natl Acad Sci U S A. 2005;102(8):2679–2680. doi:10.1073/pnas.0500213102
50. Ye QH, Zhu WW, Zhang JB, et al. GOLM1 modulates EGFR/RTK cell-surface recycling to drive hepatocellular carcinoma metastasis. Cancer Cell. 2016;30(3):444–458. doi:10.1016/j.ccell.2016.07.017
51. Chi S, Cao H, Wang Y, McNiven MA. Recycling of the epidermal growth factor receptor is mediated by a novel form of the clathrin adaptor protein Eps15. J Biol Chem. 2011;286(40):35196–35208. doi:10.1074/jbc.M111.247577
52. Meloni AR, DeYoung MB, Lowe C, Parkes DG. GLP-1 receptor activated insulin secretion from pancreatic β-cells: mechanism and glucose dependence. Diabetes Obes Metab. 2013;15(1):15–27. doi:10.1111/j.1463-1326.2012.01663.x
53. Wu T, Bound MJ, Standfield SD, Jones KL, Horowitz M, Rayner CK. Effects of taurocholic acid on glycemic, glucagon-like peptide-1, and insulin responses to small intestinal glucose infusion in healthy humans. J Clin Endocrinol Metab Apr. 2013;98(4):E718–22. doi:10.1210/jc.2012-3961
54. Wu T, Bound MJ, Standfield SD, et al. Effects of rectal administration of taurocholic acid on glucagon-like peptide-1 and peptide YY secretion in healthy humans. Diabetes Obes Metab. 2013;15(5):474–477. doi:10.1111/dom.12043
55. Katsuma S, Hirasawa A, Tsujimoto G. Bile acids promote glucagon-like peptide-1 secretion through TGR5 in a murine enteroendocrine cell line STC-1. Biochem Biophys Res Commun. 2005;329(1):386–390. doi:10.1016/j.bbrc.2005.01.139
 © 2024 The Author(s). This work is published and licensed by Dove Medical Press Limited. The full terms of this license are available at https://www.dovepress.com/terms.php and incorporate the Creative Commons Attribution - Non Commercial (unported, v3.0) License.
By accessing the work you hereby accept the Terms. Non-commercial uses of the work are permitted without any further permission from Dove Medical Press Limited, provided the work is properly attributed. For permission for commercial use of this work, please see paragraphs 4.2 and 5 of our Terms.
© 2024 The Author(s). This work is published and licensed by Dove Medical Press Limited. The full terms of this license are available at https://www.dovepress.com/terms.php and incorporate the Creative Commons Attribution - Non Commercial (unported, v3.0) License.
By accessing the work you hereby accept the Terms. Non-commercial uses of the work are permitted without any further permission from Dove Medical Press Limited, provided the work is properly attributed. For permission for commercial use of this work, please see paragraphs 4.2 and 5 of our Terms.