")
Back to Journals » Nature and Science of Sleep » Volume 15
Association Between Family Context and Sleep Trajectory in Middle-Aged and Elderly Chinese Adults
Authors Ma X, Zhang Z, Jin M, Hao Y, Cheng H, Yan N
Received 14 June 2023
Accepted for publication 29 October 2023
Published 7 November 2023 Volume 2023:15 Pages 915—924
DOI https://doi.org/10.2147/NSS.S422263
Checked for plagiarism Yes
Review by Single anonymous peer review
Peer reviewer comments 3
Editor who approved publication: Prof. Dr. Ahmed BaHammam
Xueping Ma, Zhengjun Zhang, Meihua Jin, Yu Hao, Hua Cheng, Ning Yan
Heart Centre & Department of Cardiovascular Diseases, General Hospital of Ningxia Medical University, Yinchuan, 750004, People’s Republic of China
Correspondence: Hua Cheng; Ning Yan, Heart Centre & Department of Cardiovascular Diseases, General Hospital of Ningxia Medical University, Yinchuan, Ningxia, 750004, People’s Republic of China, Tel +86 15008617234 ; +86 15719591301, Email [email protected]; [email protected]
Objective: The study aims to reveal the association between family context and sleep trajectories in middle-aged and elderly Chinese adults.
Methods: Subjects (n=7777) aged between 40 and 65 years were selected from the China Family Panel Studies (CFPS). Latent class analysis and the multi-trajectory method were used to identify the family context and sleep trajectories from 2010 to 2018. Multinomial (polytomous) logistic regression was performed to explore the relationship between family context and sleep trajectories.
Results: Five family context classes were identified according to family demographic characteristics. Simultaneously, four sleep trajectories were determined based on three sleep-related indexes. Subjects from family that had only sons or multiple-child are liable to shorten or prolong sleep duration and increase midday nap ratios compare with subjects who from family that had one or more daughters, and in future public health prevention and control, more attention could be paid to such families.
Conclusion: The study found that family context is associated with sleep trajectories among middle and old Chinese adults. Subjects from families with only girls seemed to have more stable sleep trajectories, while those with one or more boys’ families had unstable sleep trajectories. Further interventions would be carried out for sleep disorders, it is necessary to pay more attention to the family context, especially the number and gender of children.
Keywords: family context, sleep trajectory, China Family Panel Studies, CFPS, sleep disorders
Introduction
The relationship between sleep issues and health is an increasing cause for global concern. It is linked to higher morbidity and mortality rates,1 compromised quality of life, and increased social and economic burdens.2 Sleep disorders affect up to one-third of the United States population.3 Meanwhile, the figures from World Health Organization also indicated that more than one-third of the world’s population is sleep-deprived.4 In China, at least 300 million adults experience insomnia and sleep disorders,5 which would be a sustainable lift-up.
Sleep quality associated with family context has been reported in previous studies.6–8 With rapid socio-economic development of China, apparent changes have occurred in family structure. Socio-economic status has become increasingly heterogeneous following the country’s reform; household economic level and family health may be closely related.9 In China, middle-aged and elderly have experienced tremendous social changes over the past decades, which might play a mediating effect on their lifestyle and bring about health challenges.10 Since 2000, children’s education has become the major socio-economic burden faced by Chinese families, and an association between the number of children and their gender with parents’ sleep quality was observed.11 Thus, the burden of education might relate to health conditions,12,13 which could modify the quality of parental sleep or sleep trajectories.
Sleep is a dynamic process throughout an individual’s lifespan,14 the changes in sleep characteristics were associated with a higher risk of adverse outcomes,15 which showed using the trajectory of sleep characteristics to predict health risk was an advantageous alternative. Most studies about the relationship between family context and sleep issues focus on children and adolescents,16 however, the literature gap still exists about the evidence on the middle and elderly. The present study aims to clarify the association between family context and sleep trajectory in middle-aged and elderly Chinese adults using the China Family Panel Survey (CFPS) longitudinal data.
Methods
Data Source
Subjects were selected from the CFPS, a nationally representative, annual longitudinal survey of Chinese communities, families, and individuals launched in 2010 by the Institute of Social Science Survey (ISSS) at Peking University, China.17 The CFPS sample covers 25 provinces, municipalities, and autonomous regions, the baseline survey was conducted in 2010 and covered 14,960 households, 33,600 adults, and 8990 children,18 and covering personal information such as work status, education level, cognitive ability, personality characteristics, and entrepreneurship. For our purposes, we considered data released from five consecutive survey waves: 2010, 2012, 2014, 2016, and 2018.
Study Population
Subjects in the present study needed to satisfy the following criteria: 1) participated in five consecutive survey waves; 2) age in the first survey year (2010) was between 40 and 65 years, due to they had relatively stable working and living environment than younger; and 3) with no medical diagnosis of chronic disease. In total, 7777 subjects were extracted for the current study. The Biomedical Ethics Committee of Peking University (approval number IRB00001052-14,010) and Ningxia Medical University General Hospital Scientific Research Ethics Committee (approval number 2023–18) approved this study, and all survey participants provided informed consent. Research procedures involving human participants conformed with the 1964 Helsinki declaration and its later amendments.
Latent Class Definition of Family Context
The family context was measured by the number of siblings of subjects to give an indication of the participants’ childhood experience that might have contributed to their mental health in adulthood;19 whether their parents are alive, which might be related to parental support in current Chinese context, especially in terms of reducing the participants’ own parenting stress;20 education level of the subjects’ parents, education level of spouse, and education level of participants themselves, all of which are related to socio-economic level; number of children was used to depict family financial stress, with separate counts of boys and girls to reflect the Chinese traditional preference.21 The number of sons could be directly associated with future financial stress. We also redefined the number of boys, girls, and total children using category variables where 0 represents none, 1 indicates only one child and 2 and 3 mean two and more than two children, respectively. Parents’ educational level of subjects was collapsed into illiterate/semi-literate, primary school, junior high school, and above. Education levels of subjects and their spouses were categorized into primary school and below, junior high school, high school, and above. The number of siblings was grouped into four levels: 0, 1, 2, and 3, indicating none, only one, two, and more than two siblings, respectively.
Latent class analysis (LCA) was performed to group family context based on the 2010 survey. The theory and application of LCA can be found in previous publications.22–24 Akaike information criteria (AIC), Bayesian information criterion (BIC), adjusted Bayesian information criterion (aBIC), and entropy were considered to determine the optimal classes. Smaller values for BIC, adjusted BIC and AIC indicated a better model fit,25 and Entropy ≥ 0.8 indicates classes are sufficiently separated.26 By fitting from one class, we can obtain the best model.
Sleep Trajectories Identified During the Following Years
The traj command in Stata 15.0 was used to describe sleep trajectories in the following period, which was assessed by sleep duration calculated as the time interval between bedtime and wake-up time; sleep onset time was categorized according to responses to the question: “What time do you usually go to bed?” with four possible options: before 20h00, from 20h00 to 22h00, between 22h00 to 00h00, or later than 00h00; nap habits were measured by the question: “Do you have a midday napping habit?” and response options of “yes” and “no”. Sleep duration was omitted from the 2012 survey due to the design of the questionnaire. Data of sleep duration in the final analysis were used as post-normalization data. The optimal model was determined using BIC and average posterior probability for each group.27
Covariates
Demographic information, socio-economic status, health conditions, and lifestyle factors like residence (0=rural, 1=urban), sex (0=female, 1=male), age, ethnic group (1=Han, 2=Others), marital status (1=married with a spouse, 2=others). Income level in local currency, social status, life satisfaction, and degree of confidence in the future were measured using a five-point Likert scale. Body Mass Index (BMI) was calculated using weight (kg)/height (m2). Self-reported health occurred by asking participants to rate their health (1=excellent, 2=good, 3=fair, 4=unhealthy, 5=very unhealthy). And respond to a yes/no question: “Have you been unwell in the last two weeks?” to measure unwell status. Physical exercise in the last week, current smoking status, and alcohol use were measured by single questions requiring a yes/no response.
Statistical Analysis Strategies
StataMP 15.0 software was employed to analyze the final data. All quantitative variables are expressed as means±standard deviations (SD), and comparisons between family context groups were performed using one-way analysis of variance. Qualitative variables are displayed as frequency and percentage, and Chi-square tests were used to compare the proportion of variables among family context groups. Multinomial (polytomous) logistic regression was used to describe the relationships between family context and sleep trajectories. Unadjusted and adjusted (all covariates were controlled) relative-risk ratios (rrr) are reported.
Results
The results in Table S1 and Figure S1 show that a five-class model was optimal for family context. Figure 1 depicts the five classes of family context, with determined factors of the number of children and their gender. We renamed the family context classes as follows: 1-C: only two boys in a family; 2-C: only two girls in a family; 3-C: only one boy in a family; 4-C: only one girl in a family; 5-C: Large family.
 |
Figure 1 Results of Latent Class Analysis of family context from 2010 CFPS survey. Notes: siblings: number of siblings of participants; alive_f: father was alive at the time of the survey (2010); alive_m: mother was alive at the time of the survey (2010); feduc: educational level of father; meduc: educational level of mother; sedu: educational level of spouse; edu: educational level of respondent; boy: number of boys in a family; girl: number of girls in a family; chi: number of children in a family; 1-C (black square): only two boys in a family; 2-C (red round): only two girls in a family; 3-C (blue triangle): only one boy in a family; 4-C (green triangle): only one girl in a family; 5-C (purple diamond): Large Family. |
A four-trajectories model was selected, the average posterior probabilities and sleep trajectories are shown in Table 1 and Figure 2. The first group showed stable characteristics of three sleep items from 2010 to 2018: shorter sleep duration, regular sleep onset time between 20h00 and 00h00, and a consistently lower nap rate. We defined the first group (8.2%) as the stable-with-lower sleep characteristic group (G1). The second group (36.9%) showed moderate sleep duration that decreased slightly in the follow-up year. This group had a stable sleep onset time-similar to G1-and a moderately increasing midday nap rate, which was considered to counteract the reduced sleep duration (G2). The third group (18.9%) had the longest sleep duration that increased moderately over follow-up, a stable sleep onset time similar to the first two groups, and moderately increasing midday nap rate. We designated it as a medium increase in sleep characteristics (G3). The last group (36.0%) had moderate sleep duration at the outset, slightly increasing over the following years, and a lower midday nap rate at baseline that increased slightly in the final survey years. This group had a constant sleep onset time, and we described it as having slightly increased trends of sleep characteristics overall (G4).
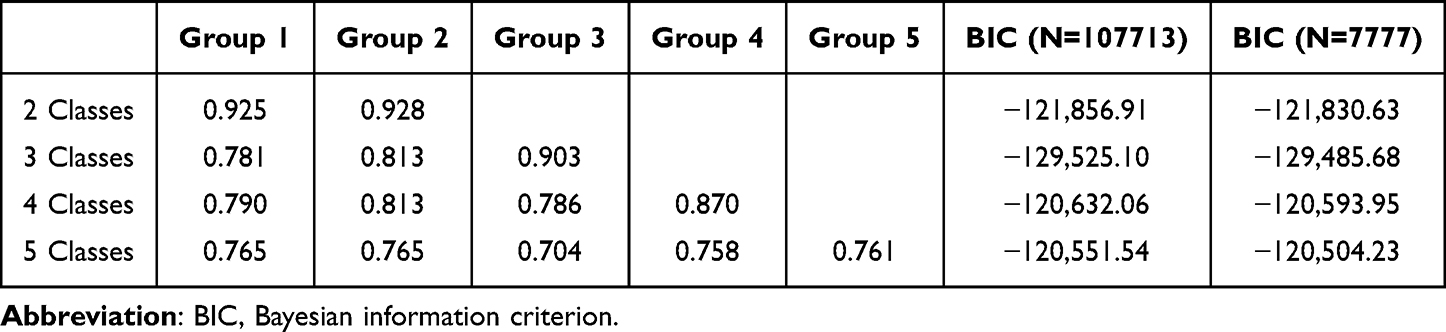 |
Table 1 Average Posterior Probabilities of Group Assignment and Bayesian Information Criterion (BIC) Statistics of Model Fit |
 |
Figure 2 The visual trajectories of sleep defined by sleep duration, sleep onset time, and nap rate in CFPS from 2010 to 2018. G1 (blue point): stable-with-lower sleep characteristic group. G2 (red point): counteracting reduced sleep duration. G3 (green point): medium increase in sleep characteristics. G4 (red point): slightly increasing sleep trends. |
Table 2 depicts the distribution of family context information and demographic indexes among sleep trajectories. Most variables showed a significant distribution except for marital status, current smoking habit, number of siblings, and number of girls.
 |
Table 2 Distribution and Comparison of Demographic Characteristics, Health Conditions, Lifestyle Factors, and Family Context in the CFPS 2010 Survey Wave, by Sleep Trajectory Groups |
The frequencies of sleep trajectories among family context are presented in Table 3. Group 2-C (two girls in the family) showed the highest proportion of stable sleep trajectory (G1) that is characterized by shorter sleep duration and lower midday nap ratio. Group 4-C (one girl in the family) showed the highest proportion of slightly decreasing nocturnal sleep duration and increasing midday nap ratio (G2). Groups 1-C (two boys in the family) and 5-C (Large family) had the highest sleep trajectory with medium increases in sleep duration and midday nap ratio (G3). Group 3-C (only one boy in the family) showed the highest scale of slightly increasing trends of sleep duration and nap ratio (G4), while the nap ratio was at the lowest position in 2010 with G1.
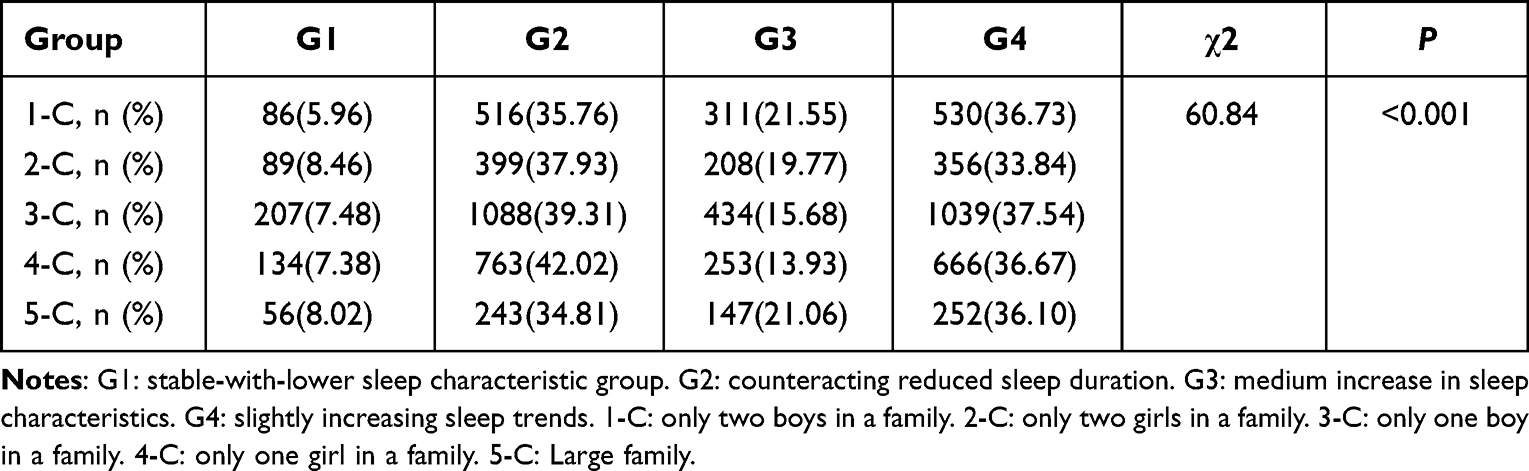 |
Table 3 Univariate Analysis of Sleep Trajectories Among Family Context Groups by n (%) |
The relative risk-ratio (rrr) of family context with sleep trajectories is displayed in Table 4. Families that had two girls, one boy, or only one girl negatively associated with G3 sleep trajectory that featured as moderately increased sleep duration and elevated midday nap ratio compared with two boys’ family. Robust output was driven by the adjusted and unadjusted model (rrr: 0.658, 0.671, and 0.654, respectively, from the adjusted model). Negatively association (rrr in the adjusted model: 0.620) was also observed between families with only two girls and slightly increasing trends of sleep duration and nap ratio (G4). Moreover, in the adjusted model, this family context observed a negatively relationship with G2 sleep trajectory that slightly decreased nocturnal sleep duration and increased midday nap ratio (rrr: 0.693).
 |
Table 4 The Relationship of Family Context and Sleep Trajectories from 2010 to 2018 in Chinese Adults, rrr (95% CI) |
Discussion
Five family context classes were identified, mainly according to the number of children and their gender. Subjects in the current study experienced different periods before and after the implementation of the one-child family planning policy28 and its inconsistent execution time and implementation intensity in the provinces of China. This explains why the variance in family context derives from the number of children produced and their gender. Four optimal sleep trajectories were identified based on sleep duration, sleep onset time, and midday nap habits. The family context was a potential factor that could not be ignored in attempting to understand factors influencing sleep quality.5,29 Our results indicated that family context is significantly associated with sleep trajectories.
Along with the reform and opening up of China from the 1970s, parenting perceptions were profoundly altered in the 21st century from “food and clothing worry-free” to work towards a “high-quality of talent fostering”. Although misleading, commercial slogans such as “You can’t let your child lose on the starting line!” reflect the pressure and anxiety in China regarding children’s education and investing, driven by competition for unfairly distributed educational resources.30 Parents in larger families faced strong financial pressure, and its negative association with sleep quality has been well documented.31,32 Our study revealed that subjects from families with one or two girls or one boy did not demonstrate increased sleep duration and midday nap ratio, compared with families with two boys. In families with two boys, the subjects’ sleep trajectory is more inclined to change over time. The unavoidable explanation might be that the preference for sons dominates in East Asia,33 and that boys—default successors and providers for parents in future—give their parents hope of an outstanding vocational future along with associated demands for increased financial support. Another potential reason is the pressure of bride price34 that has increased dramatically in recent decades in China, especially in poverty-stricken areas. Both of those situations are financially demanding for parents, placing them under great pressure. Additionally, in China, affected by Confucianism, parents believe that it is their responsibility to care and educate their children well, and with more children means more responsibility and duty.35 Those responsibilities and pressure were potentially deteriorating their sleep quality, and leading them to nap more to make up for the lost sleep.
Our study also revealed that subjects from families with two girls did not show changes in sleeping habits, and they tended to remain constant in sleep habits compared with families of two boys. It may be that families with girls face significantly less financial pressure in the Chinese social context. Meanwhile, subjects from larger families have sleep trajectories that are similar to those with two or more boys—more children mean more education expenses and daily cost of living. On one hand, having a large family size increases the financial burden and accumulation of this effect on sleep disorders.36 On the other hand, their parents need to spend more time to care and accompany them so that they reduce the opportunity to communicate with others or participate social activities, the previous study reported that social supports can improve parenting stress37 and contribute to good sleep habit.38
Although we used a nationwide cohort sample, a part of the subjects was missing from the following survey, which may have lowered the efficacy of the analysis. Other limitations should also be noted. First, sleep-related items were collected via questionnaire interview, suggesting that recall bias may be possible, although a previous study showed a generally consistent assessment of objective and subjective sleep items.39 Second, there were limitations in the secondary data analysis, and we omitted some possible factors (eg, dwelling environment) from the CFPS data variables list. Third, despite controlling for many covariates in the final model, a few potential confounders were not included in this study.
Conclusion
In conclusion, the number of children and their gender played a key role in grouping of Chinese family context. Over time, sleep trajectories showed different trends, and the study found that family context is associated with it. Subjects from families only with girls seemed to have more stable sleep trajectories, while those with one or more boys’ families had unstable sleep trajectories. This provided new insights for interventions of sleep problem, governors may be can adopt more policy to reduce pressure of those families with one or more boys.
Acknowledgments
We are grateful for the consent to access data from the China Family Panel Studies (CFPS), funded by 985 Program of Peking University and carried out by the Institute of Social Science Survey of Peking University.
Funding
This work was supported by the Key Research and Development Projects of Ningxia, China (Grant number 2020BFG02002); the Natural Science Foundation of Ningxia, China (Grant number 2021AAC03359).
Disclosure
The authors have no conflict of interest to declare.
References
1. Alexander M, Ray MA, Hébert JR, et al. The national veteran sleep disorder study: descriptive epidemiology and secular trends, 2000–2010. Sleep. 2016;39(7):1399–1410. doi:10.5665/sleep.5972
2. Porter VR, Buxton WG, Avidan AY. Sleep, cognition and dementia. Curr Psychiatry Rep. 2015;17(12):97. doi:10.1007/s11920-015-0631-8
3. Bollu PC, Kaur H. Sleep medicine: insomnia and sleep. Mo Med. 2019;116(1):68–75.
4. Ohayon MM, Paskow M, Roach A, et al. The national sleep foundation’s sleep satisfaction tool. Sleep Health. 2019;5(1):5–11. doi:10.1016/j.sleh.2018.10.003
5. Lu R, Wang Z, Lin X, Guo L. How do family role overload and work interferance with family affect the life satisfaction and sleep sufficiency of construction professionals? Int J Environ Res Public Health. 2019;16(17):3094. doi:10.3390/ijerph16173094
6. Counts CJ, Grubin FC, John-Henderson NA. Childhood socioeconomic status and risk in early family environments: predictors of global sleep quality in college students. Sleep Health. 2018;4(3):301–306. doi:10.1016/j.sleh.2018.02.003
7. Covington LB, Patterson F, Hale LE, et al. The contributory role of the family context in early childhood sleep health: a systematic review. Sleep Health. 2021;7(2):254–265. doi:10.1016/j.sleh.2020.11.010
8. Philbrook LE, Saini EK, Fuller-Rowell TE, Buckhalt JA, El-Sheikh M. Socioeconomic status and sleep in adolescence: the role of family chaos. J Family Psychol. 2020;34(5):577–586. doi:10.1037/fam0000636
9. Myers K, Redere A, Fefferman NH. How resource limitations and household economics may compromise efforts to safeguard children during outbreaks. BMC Public Health. 2020;20(1):270. doi:10.1186/s12889-019-7968-6
10. Graham H, White PCL. Social determinants and lifestyles: integrating environmental and public health perspectives. Public Health. 2016;141:270–278. doi:10.1016/j.puhe.2016.09.019
11. Hagen EW, Mirer AG, Palta M, Peppard PE. The sleep-time cost of parenting: sleep duration and sleepiness among employed parents in the Wisconsin Sleep Cohort Study. Am J Epidemiol. 2013;177(5):394–401. doi:10.1093/aje/kws246
12. Muennig P, Woolf SH. Health and economic benefits of reducing the number of students per classroom in US primary schools. Am J Public Health. 2007;97(11):2020–2027. doi:10.2105/AJPH.2006.105478
13. Whinnery J, Jackson N, Rattanaumpawan P, Grandner MA. Short and long sleep duration associated with race/ethnicity, sociodemographics, and socioeconomic position. Sleep. 2014;37(3):601–611. doi:10.5665/sleep.3508
14. Zomers ML, Hulsegge G, van Oostrom SH, Proper KI, Verschuren WMM, Picavet HSJ. Characterizing adult sleep behavior over 20 years-the Population-Based Doetinchem Cohort Study. Sleep. 2017;40(7):zsx085. doi:10.1093/sleep/zsx085
15. Kim C-W, Chang Y, Kang J-G, Ryu S. Changes in sleep duration and subsequent risk of hypertension in healthy adults. Sleep. 2018;41(11). doi:10.1093/sleep/zsy159
16. Escobar DFSS, Jesus TF, Noll PRES, Noll M. Family and school context: effects on the mental health of Brazilian students. Int J Environ Res Public Health. 2020;17(17):6042. doi:10.3390/ijerph17176042
17. Xie Y, Lu P. The sampling design of the china family panel studies (CFPS). Chin J Soc. 2015;1(4):471–484. doi:10.1177/2057150X15614535
18. Xie Y, Hu J. An introduction to the China family panel studies (CFPS). Chin Sociol Rev. 2014;47(1):3–29.
19. Francisco R, Pedro M, Delvecchio E, et al. Psychological symptoms and behavioral changes in children and adolescents during the early phase of COVID-19 quarantine in three European countries. Front Psychiatry. 2020;11:570164. doi:10.3389/fpsyt.2020.570164
20. Ren J, Li X, Chen S, Chen S, Nie Y. The influence of factors such as parenting stress and social support on the state anxiety in parents of special needs children during the COVID-19 epidemic. Front Psychol. 2020;11:565393. doi:10.3389/fpsyg.2020.565393
21. Zhang H, Shang Z, Wu L, et al. Prolonged grief disorder in Chinese Shidu parents who have lost their only child. Eur J Psychotraumatol. 2020;11(1):1726071. doi:10.1080/20008198.2020.1726071
22. Vermunt JK, Magidson JM. Latent class cluster analysis. Applied Latent Class Analysis. 2002;2002:89–106.
23. Mori M, Krumholz HM, Allore HG. Using latent class analysis to identify hidden clinical phenotypes. JAMA. 2020;324(7):700–701. doi:10.1001/jama.2020.2278
24. Li J, Yu H, He S, et al. The association between awareness and behavior concerning the need for protection when using pesticide sprays and neurologic symptoms: a latent class cluster analysis. Medicine. 2019;98(30):e16588–e16588. doi:10.1097/MD.0000000000016588
25. Nylund KL, Asparouhov T, Muthén BO. Deciding on the number of classes in latent class analysis and growth mixture modeling: a monte carlo simulation study. Struc Equ Mod. 2007;14:535–569. doi:10.1080/10705510701575396
26. Ramaswamy V, Desarbo WS, Reibstein DJ, Robinson WT. An empirical pooling approach for estimating marketing mix elasticities with PIMS data. Market Sci. 1993;12(1):103–124. doi:10.1287/mksc.12.1.103
27. Jones BL, Nagin DS, Roeder K. A SAS procedure based on mixture models for estimating developmental trajectories. Sociol Methods Res. 2001;29(3):374–393. doi:10.1177/0049124101029003005
28. Ding QJ, Hesketh T. Family size, fertility preferences, and sex ratio in China in the era of the one child family policy: results from national family planning and reproductive health survey. BMJ. 2006;333(7564):371–373. doi:10.1136/bmj.38775.672662.80
29. Schmeer KK, Tarrence J, Browning CR, Calder CA, Ford JL, Boettner B. Family contexts and sleep during adolescence. SSM Popul Health. 2018;7:4.
30. Wan G. A study on uneven children’s education resources: based on children’s education in China’s 31 provincial areas. Chin J Popul Sci. 2012;1:82–93.
31. Hall M, Buysse DJ, Nofzinger EA, et al. Financial strain is a significant correlate of sleep continuity disturbances in late-life. Biol Psychol. 2008;77(2):217–222. doi:10.1016/j.biopsycho.2007.10.012
32. Lee CY, Chen HC, Tseng MC, et al. The relationships among sleep quality and chronotype, emotional disturbance, and insomnia vulnerability in shift nurses. J Nurs Res. 2015;23:225–235. doi:10.1097/jnr.0000000000000095
33. Mattison SM, Beheim B, Chak B, Buston P. Offspring sex preferences among patrilineal and matrilineal Mosuo in Southwest China revealed by differences in parity progression. R Soc Open Sci. 2016;3(9):160526. doi:10.1098/rsos.160526
34. Rees S, Mohsin M, Tay AK, et al. Associations between bride price obligations and women’s anger, symptoms of mental distress, poverty, spouse and family conflict and preoccupations with injustice in conflict-affected Timor-Leste. BMJ Glob Health. 2016;1(1):e000025–e000025. doi:10.1136/bmjgh-2015-000025
35. Park M, Chesla C. Revisiting Confucianism as a conceptual framework for Asian family study. J Fam Nurs. 2007;13(3):293–311. doi:10.1177/1074840707304400
36. Chen X, Wang R, Zee P, et al. Racial/ethnic differences in sleep disturbances: the multi-ethnic study of atherosclerosis (Mesa). Sleep. 2015;38(6):877–888. doi:10.5665/sleep.4732
37. Martinez VC, Turnage D. Social support and parenting stress in Hispanic parents of children with autism spectrum disorder. Issues Ment Health Nurs. 2022;43(11):1030–1040. doi:10.1080/01612840.2022.2100949
38. Krause N, Rainville G. Exploring the relationship between social support and sleep. Health Educ Behav. 2020;47(1):153–161. doi:10.1177/1090198119871331
39. Devenney LE, Coyle KB, Roth T, Verster JC. Sleep after heavy alcohol consumption and physical activity levels during alcohol hangover. J Clin Med. 2019;8(5):752. doi:10.3390/jcm8050752
 © 2023 The Author(s). This work is published and licensed by Dove Medical Press Limited. The full terms of this license are available at https://www.dovepress.com/terms.php and incorporate the Creative Commons Attribution - Non Commercial (unported, v3.0) License.
By accessing the work you hereby accept the Terms. Non-commercial uses of the work are permitted without any further permission from Dove Medical Press Limited, provided the work is properly attributed. For permission for commercial use of this work, please see paragraphs 4.2 and 5 of our Terms.
© 2023 The Author(s). This work is published and licensed by Dove Medical Press Limited. The full terms of this license are available at https://www.dovepress.com/terms.php and incorporate the Creative Commons Attribution - Non Commercial (unported, v3.0) License.
By accessing the work you hereby accept the Terms. Non-commercial uses of the work are permitted without any further permission from Dove Medical Press Limited, provided the work is properly attributed. For permission for commercial use of this work, please see paragraphs 4.2 and 5 of our Terms.