")
Back to Journals » Nature and Science of Sleep » Volume 16
Application Value of Cardiometabolic Index for the Screening of Obstructive Sleep Apnea with or Without Metabolic Syndrome
Authors Wang D , Chen Y, Ding Y, Tang Y, Su X , Li S, Zhang H, Zhou Y , Zhuang Z, Gan Q , Wang J, Zhang Y, Zhao D , Zhang N
Received 14 November 2023
Accepted for publication 12 February 2024
Published 19 February 2024 Volume 2024:16 Pages 177—191
DOI https://doi.org/10.2147/NSS.S449862
Checked for plagiarism Yes
Review by Single anonymous peer review
Peer reviewer comments 2
Editor who approved publication: Dr Valentina Alfonsi
Donghao Wang,1,* Yating Chen,1,* Yutong Ding,1,* Yongkang Tang,1,* Xiaofen Su,1,* Shiwei Li,1 Haojie Zhang,1,2 Yanyan Zhou,1 Zhiyang Zhuang,1 Qiming Gan,1 Jingcun Wang,1 Yuting Zhang,1 Dongxing Zhao,1 Nuofu Zhang1
1State Key Laboratory of Respiratory Disease, National Clinical Research Center for Respiratory Disease, National Center for Respiratory Medicine, Sleep Medicine Center, Guangzhou Institute of Respiratory Health, the First Affiliated Hospital of Guangzhou Medical University, Guangzhou, Guangdong, 510160, People’s Republic of China; 2The Clinical Medicine Department, Henan University, Zhengzhou, People’s Republic of China
*These authors contributed equally to this work
Correspondence: Nuofu Zhang, State Key Laboratory of Respiratory Disease, National Clinical Research Center for Respiratory Disease, National Center for Respiratory Medicine, Sleep Medicine Center, Guangzhou Institute of Respiratory Health, the First Affiliated Hospital of Guangzhou Medical University, Guangzhou, Guangdong, 510160, People’s Republic of China, Tel +86-13600460056, Email [email protected]
Background: Obstructive sleep apnea (OSA) is a common chronic disease with various comorbidities. The cardiometabolic index (CMI) reflects visceral fat tissue distribution and function, assessing the risk of obesity-related conditions such as metabolic syndrome (MetS) and stroke, which are strongly connected to OSA. The relationship between CMI with OSA and OSA combined with MetS (OMS) remains unclear. This study aims to evaluate the screening value of CMI for OSA and OMS, compared to the lipid accumulation product (LAP).
Methods: A total of 280 participants who underwent polysomnography were finally included, with the measurements of metabolic-related laboratory test results such as total cholesterol and triglyceride. Receiver operating curve (ROC) analysis and calculation of the area under the curve (AUC) were conducted to assess the screening potential of CMI, LAP, and the logistic regression models established based on them for OSA and OMS. The Youden index, sensitivity, and specificity were used to determine the optimal cutoff points.
Results: ROC curve analysis revealed that the AUCs for CMI in screening OSA and OMS were 0.808 and 0.797, and the optimal cutoff values were 0.71 (sensitivity 0.797, specificity 0.776) and 0.89 (sensitivity 0.830, specificity 0.662), respectively, showing higher Youden index than LAP. The AUCs of screening models based on CMI for OSA and OMS were 0.887 and 0.824, respectively.
Conclusion: CMI and LAP can effectively screen for OSA and OMS, while CMI has more practical cutoff values for identifying the diseased states. Screening models based on CMI demonstrate a high discriminatory ability for OSA and OMS, which needs verification in a large-scale population.
Keywords: obstructive sleep apnea, metabolic syndrome, cardiometabolic index, lipid accumulation products, screening model
Introduction
Obstructive sleep apnea (OSA) is a chronic sleep-related breathing disorder characterized by recurrent occurrences of complete or partial upper airway obstruction during sleep.1 These pathologically result in nocturnal intermittent hypoxemia, disruptions in sleep patterns, hypercapnia, and heightened sympathetic nervous system activity.1 Numerous studies have established that OSA is an independent factor contributing to the development and worsening of various conditions, including hypertension, gastroesophageal reflux disease (GERD), and metabolic syndrome (MetS).2–4
MetS is a cluster of metabolic disturbances including central obesity, hyperglycemia, hypertension, and atherogenic dyslipidemia.5 According to data from the Centers for Disease Control and Prevention in the United States, approximately 85% of individuals with type 2 diabetes also have MetS, yet the number of individuals with MetS is three times higher than that of those with type 2 diabetes.6 MetS is a significant risk factor for the development of cardiovascular diseases, with relative risks of 1.74 for cardiovascular disease, 1.52 for coronary heart disease, and 1.76 for stroke when compared to those without MetS.7 Due to its high prevalence and severe adverse consequences, MS has emerged as a substantial public health concern.
The risk of comorbid MetS in patients with OSA is significantly higher compared to the general population. There is a mutual causal relationship between OSA and MetS, potentially forming a detrimental cycle. A large-sample clinical study in China estimated the prevalence of MetS to be 18.6%, 30.4%, 43.8%, and 57.1% in the patients with no, mild, moderate, and severe OSA, respectively.8 Conversely, around 60.5% of patients with MetS have comorbid moderate or severe OSA.9 A prospective cohort study showed that approximately 17.2% of OSA patients develop comorbid MetS within six years, indicating that OSA is independently associated with MetS.10 The high rates of comorbidity between OSA and MetS are probably due to the fact that they share several common risk factors, such as obesity, elderly, and poor lifestyles. In general population, a 10% weight gain predicts an approximately 32% increase in the apnea–hypopnea index (AHI), and a 6-fold increase in the odds of developing moderate-to-severe OSA.11 Moreover, central obesity is a crucial component of MetS, which is closely related to fat deposition in the neck, and worse upper airway stenosis observed during sleep compared to peripheral obesity.12 Both OSA and MetS can damage multiple organ systems, contributing to the poor prognosis of patients. Therefore, the search for new indicators with high efficacy for prompt diagnosis is urgently needed.
Polysomnography (PSG) serves as the gold standard for diagnosing OSA. Nevertheless, its complexity, high cost, and time-consuming process contribute to the relatively low rates of OSA diagnosis and treatment. Otherwise, the cardiometabolic index (CMI) is a novel indicator that reflects visceral fat distribution and functional impairments, which can be rapidly assessed using lipid parameters, waist circumference, and height, making it valuable for predicting the risk of obesity-relevant metabolic disorders.13 Given that CMI reflects both lipid metabolism and central obesity, it is closely associated with OSA. One study has indicated that with every 1-unit increase in the CMI of patients with OSA, the risk of developing cardiovascular diseases in the future increases by 31%.14 If the screening value of CMI can be confirmed, it could provide a theoretical foundation for the rapid assessment of OSA and the risk of comorbid MetS in patients with OSA. Above all, this study mainly aims to evaluate the screening value of CMI for OSA and OSA combined with MetS (OMS) in comparison to the lipid accumulation product (LAP), which is widely considered to have predictive value.15
Methods
Study Population
All participants were consecutively recruited from the Sleep Medical Center of the First Affiliated Hospital of Guangzhou Medical University, Guangzhou, China, from January 2021 to January 2022. This included adults referred for PSG evaluation due to suspected sleep-disordered breathing by their attending physicians or those who requested a self-checkup. In addition to PSG, blood samples were collected from each participant for the assessment of metabolic-related parameters.
Patients with respiratory events dominated by central or mixed sleep apnea and those with comorbidities such as chronic insomnia, restless leg syndrome, narcolepsy, and other sleep disorders were excluded. Ultimately, a total of 280 patients met all inclusion criteria and were included in the analysis. This study complies with the Declaration of Helsinki and was approved by the Ethics Committee of the First Affiliated Hospital of Guangzhou Medical University with Ethical Approval No. 05, 2017, and all patients provided informed consent by giving their signatures. The study flowchart is presented in Figure 1.
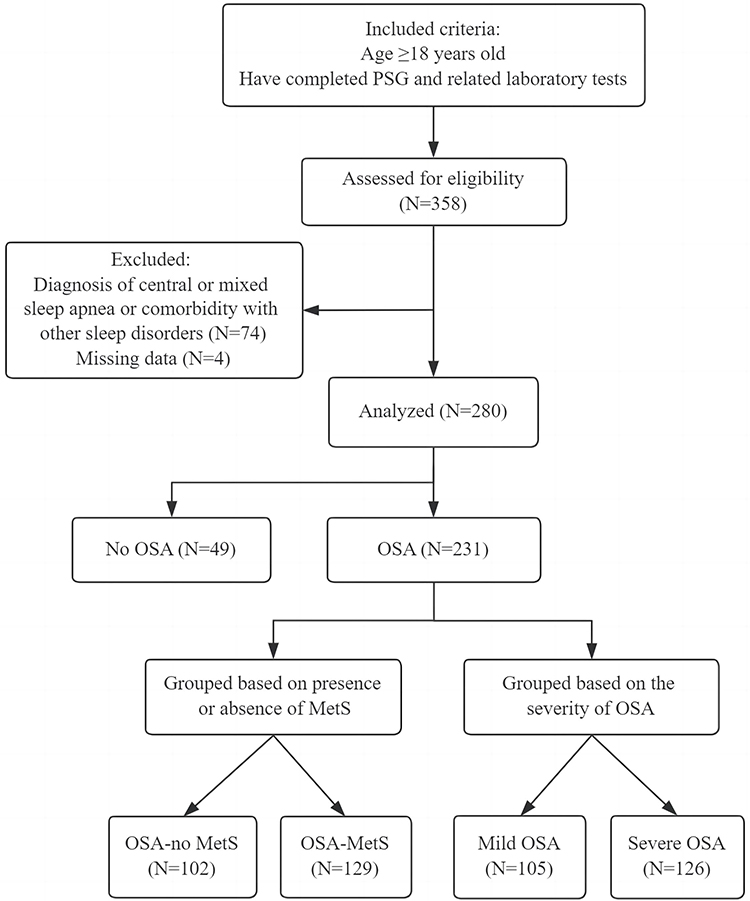 |
Figure 1 Flowchart of the study. Abbreviations: MetS, metabolic syndrome; OSA, obstructive sleep apnea. |
Data Collection
Extracting baseline data for all patients from the medical electronic system, including demographic characteristics such as age, gender, and body mass index (BMI), neck circumference, waist circumference; OSA-related symptoms: loud snoring, observed apnea; Epworth sleepiness scale (ESS) score; comorbidities: coronary artery disease, atrial fibrillation, heart failure, cerebrovascular disease, nasopharyngeal diseases, chronic obstructive pulmonary disease (COPD), asthma, GERD and MetS; biochemical measurements: fasting blood glucose (FBG), hemoglobin A1c (HbA1c), total cholesterol (TC), triglyceride (TG), high-density lipoprotein cholesterol (HDL-C), low-density lipoprotein cholesterol (LDL-C), blood urea nitrogen (BUN), serum creatinine (Scr), uric acid (UA). Additionally, we collected the parameters related to respiratory event from PSG including AHI, mean pulse oxygen saturation (MSpO2), lowest arterial oxygen saturation (LSaO2), and cumulative percentages of time spent at arterial oxygen saturation below 90% (T90%).
Polysomnography and OSA
All participants underwent overnight PSG monitoring with an Alice 5 PSG (Philips Wellcome, USA) for at least 7 hours. The use of alcohol, coffee, sedatives, and hypnotics was prohibited on the same day. The monitoring indicators included electroencephalogram, electromyography, blood oxygen saturation, electrooculogram, electrocardiogram, snoring, mouth airflow, nasal airflow, chest breathing, and body position. The raw data were automatically read by the instrument. Two trained sleep professionals separately analyzed the parameters, such as sleep duration and sleep breathing events, based on the Manual for the Scoring of Sleep and Associated Events published by the American Academy of Sleep Medicine in 2012. Apneas were classified as a drop ≥90% of baseline airflow lasting at least 10 seconds, while hypopnea was classified as ≥30% pre-event drop over ≥10 seconds associated with the desaturation of oxygen ≥3% or an arousal.
The diagnostic criteria for OSA include the presence of typical nighttime symptoms of snoring accompanied by episodes of breathing cessation, physical examination findings indicating narrowing or obstruction in the upper airway, and significant daytime sleepiness (ESS score ≥11) with an AHI ≥5 events per hour. For patients without significant daytime sleepiness (ESS score <11), a diagnosis can also be established if the AHI is ≥15 events per hour or if there is an AHI ≥5 events per hour in conjunction with one or more comorbidities, such as hypertension, diabetes, cognitive impairment, coronary artery disease, cerebrovascular disease, or mood disorder.16
Five events/hour ≤AHI ≤30 events/hour was defined as mild-moderate OSA, while AHI >30 events/hour was severe OSA.
Metabolic Syndrome
MetS was defined in individual presenting with any three or more of the following criteria1 7: (1) Abdominal obesity (also known as central obesity): Waist circumference of ≥90 cm in men or ≥85 cm in women. (2) High blood glucose: FBG levels ≥6.1 mmol/L or 2-hour post-glucose load blood glucose levels ≥7.8 mmol/L, or a confirmed diagnosis of diabetes under treatment. (3) High blood pressure: Blood pressure ≥130/85 mmHg or a confirmed diagnosis of hypertension under treatment. (4) Hypertriglyceridemia: blood TG levels ≥1.70 mmol/L. (5) Low HDL-C: blood HDL-C levels <1.04 mmol/L. The metabolic score has a total of 5 points, with one point awarded for each of the above criteria met.
Statistical Analysis
Statistical analysis was performed using SPSS 26.0 software. Continuous data were presented as mean ± standard deviation or median (interquartile range, IQR: P25-P75). Independent sample t-tests were used for normally distributed data, while the Mann–Whitney U-test was employed for non-normally distributed data. Non-normally distributed data were log-transformed. Categorical variables were expressed as counts (%) and compared between groups using the chi-square test. Pearson correlation analysis or Spearman correlation analysis was utilized to assess the relationships between variables. Multiple linear regression analysis was applied to adjust for confounding factors in correlation analysis, using the stepwise method for variable selection. Multiple logistic regression analysis was used to select appropriate predictors and establish different screening models, with forward stepwise selection for variable inclusion. ROC curves and AUC were used to evaluate the predictive values of CMI, LAP, various parameters, and different models for screening OSA and OMS. Youden index, sensitivity, specificity, positive predictive value (PPV), and negative predictive value (NPV) were calculated for different cutoff points, and the optimal cutoff points for CMI and LAP were determined. The Youden index is calculated as (Sensitivity + Specificity) – 1. A P value <0.05 was considered to be statistically significant.
Results
Patients Baseline Clinical Characteristics
A total of 280 participants were eventually enrolled in this study. All participants were categorized into three groups: no OSA, mild-moderate OSA, and severe OSA, based on their AHI. Among all subjects, 77.9% were male, and the average age was 44.0 (34.0–55.8) years old, with an average BMI of 26.8 (24.4–29.5) kg/m². BMI, neck circumference, and waist circumference increased with the severity of OSA, exhibiting statistically significant differences. Loud snoring and observed apnea were more commonly noticed among patients with severe OSA. The incidence of comorbidities did not show significant variations across different groups (as shown in Table 1).
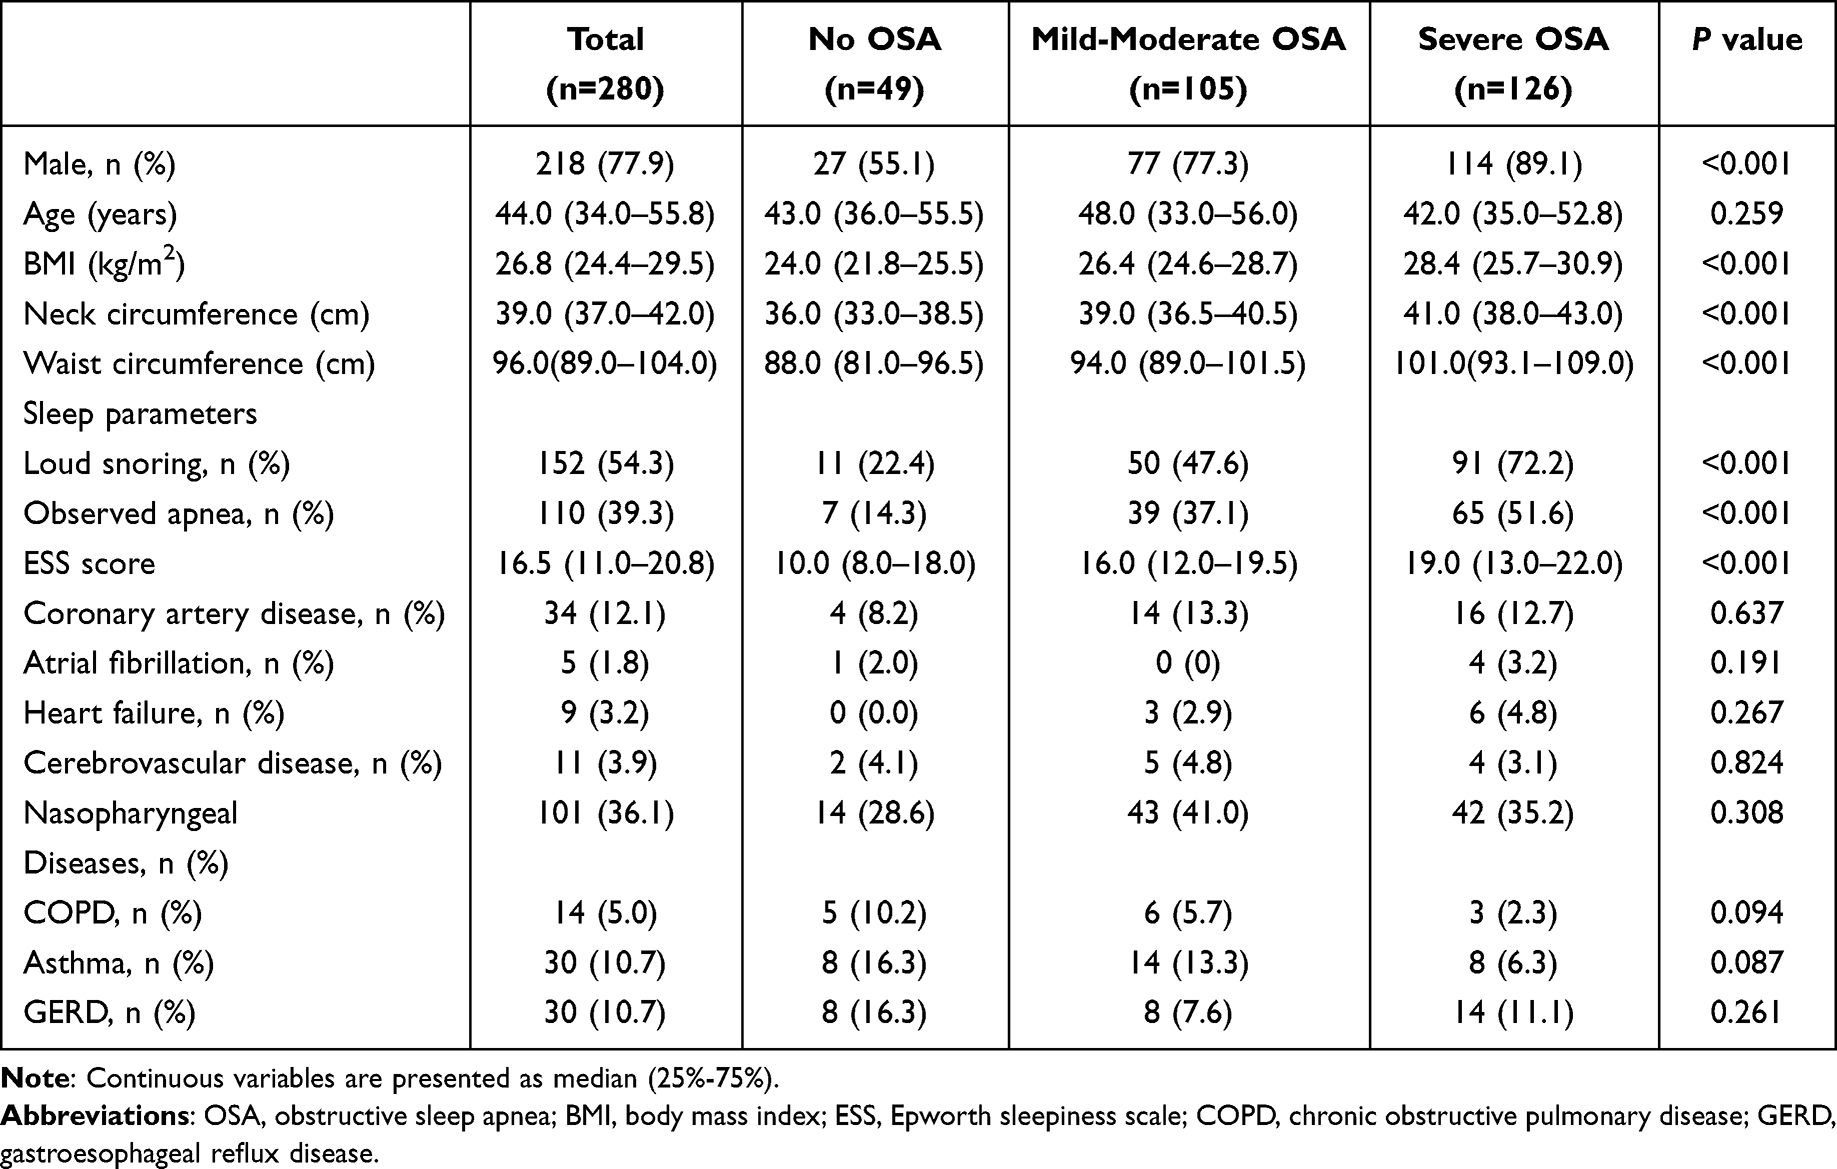 |
Table 1 Demographic and Anthropometric Characteristics of All Subjects with Different Severities of OSA |
Metabolic Syndrome Assessment
Among all participants, there were 137 cases (48.9%) of individuals comorbid with MetS. In the group of no OSA, the likelihood of harboring MetS was 16.3%, while the likelihood increased to 52.4% and 58.7% in those with mild-moderate and severe OSA, respectively. The average metabolic score for all the participants was 2.5 (2.0–3.0). OSA patients had higher metabolic scores compared to those without OSA, and these scores increased with the severity of OSA. Across different groups, there were statistically significant differences in the number of individuals with abdominal obesity, high blood glucose, hypertriglyceridemia, and low HDL-C, all of which increased with the severity of OSA (as shown in Table 2). Other laboratory tests, especially the UA, also showed significant differences in between-group comparisons of different severities of OSA (as shown in Table S1).
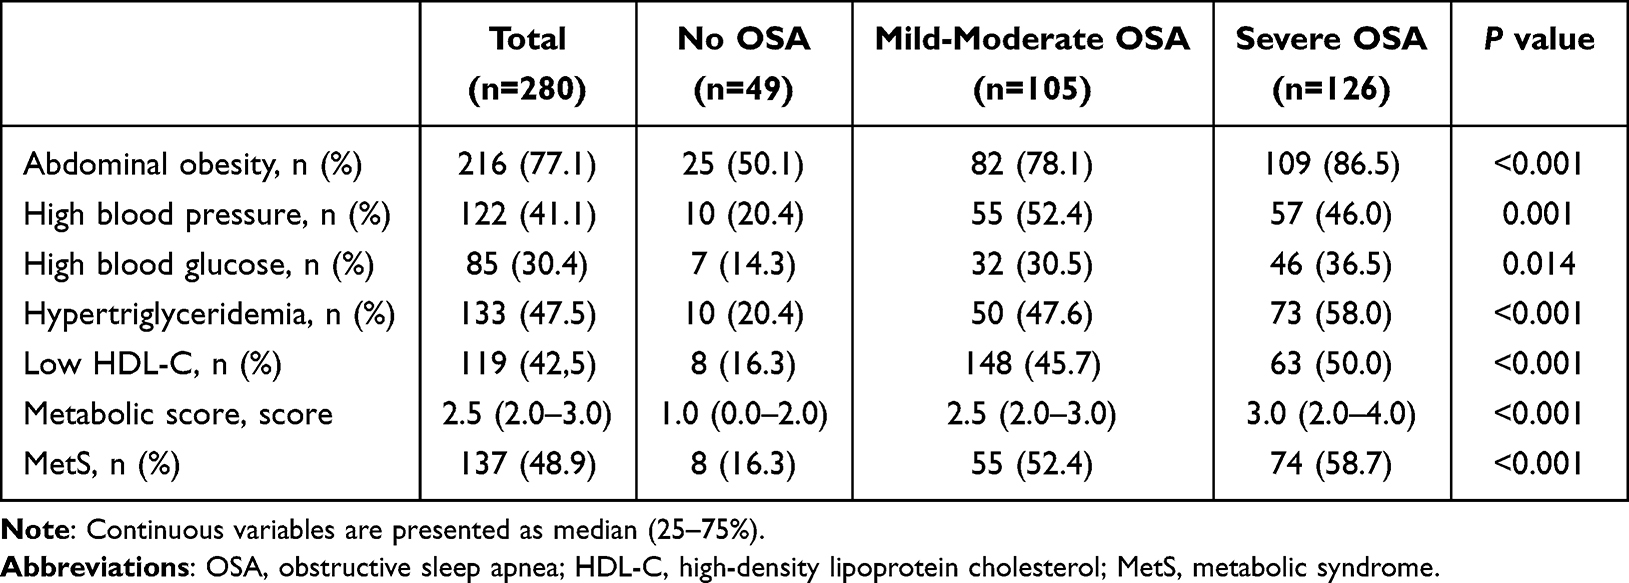 |
Table 2 Comparison of Metabolic Syndrome Indicators in Subjects Between Groups of Different Severities of OSA |
PSG Parameters
Among the 280 participants, patients with mild-moderate and severe OSA comprised 41.4% and 45.7% of the total, with an average AHI of 14.4 (9.0–22.1) events per hour and 54.9 (39.0–71.1) events per hour, respectively. Notably, MSpO2 and LSaO2 showed a progressive decrease with increasing severity of OSA, while T90% was significantly increased (as shown in Table S2).
CMI and LAP
The average CMI and LAP for all participants was 0.99 (0.61–1.57) and 57.7 (37.1–96.5), respectively. There were significant statistical differences in CMI and LAP across different groups, with both parameters gradually increasing with the severity of OSA. Specifically, the CMI for the mild-moderate OSA group and the severe OSA group was 1.00 (0.66–1.54) and 1.17 (0.82–1.84), while the LAP for these groups was 61.1 (41.2–93.1) and 77.6 (49.1–120.3), respectively (as shown in Table 3).
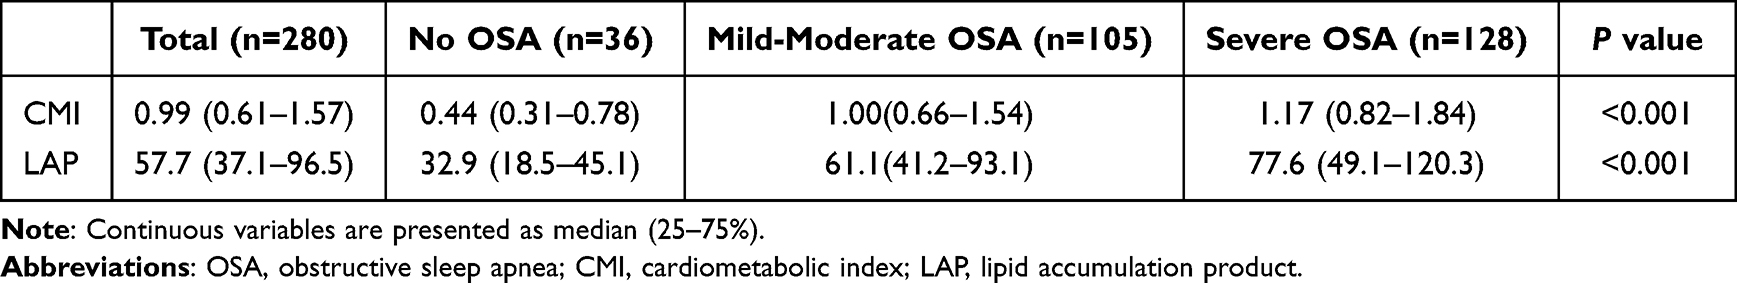 |
Table 3 Comparison of CMI and LAP in Subjects Between Groups of Different Severities of OSA |
Comparison of the Baseline, Laboratory Tests, and PSG Parameters Between the OSA and OMS Groups
Among 231 patients with OSA, 129 (55.8%) were complicated with MetS. At baseline, the age, BMI, neck circumference, and waist circumference of patients with OMS were higher than those of patients with isolated OSA, but there was no significant difference in loud snoring, observed apnea, and sleepiness (as shown in Table S3). In terms of comorbidities, patients with OMS were more likely to have coronary heart disease and heart failure (17.8% vs 6.9%, P < 0.05; 7.0% vs 0.0%, P < 0.01). Of note, patients with isolated OSA were significantly more likely to have nasopharyngeal disease than those with OMS (45.1% vs 31.8%, P < 0.05, Table S3). There were significant differences in most laboratory tests, CMI, and LAP between the two groups (as shown in Table S4, Table S5). In addition, the results showed no significant difference in PSG parameters between the two groups, indicating that PSG parameters may fail to predict whether patients with OSA are complicated with MetS (as shown in Table S6).
Screening Efficacy of Various Indicators
The screening performance of various indicators was assessed using ROC curves and AUC values. For the screening of OSA, the AUC values for CMI and LAP were found to be 0.808 (95% CI 0.733–0.883, P < 0.01) and 0.809 (95% CI 0.738–0.880, P < 0.01), respectively, indicating that their superior screening efficacy compared to other parameters. In the case of OMS screening, the AUC values for CMI and LAP did not exhibit a significant decrease, with values of 0.797 (95% CI 0.744–0.849, P < 0.01) and 0.771 (95% CI 0.716–0.825, P < 0.01), respectively. Their screening efficacy remained superior to other parameters (as shown in Table 4, Figure 2).
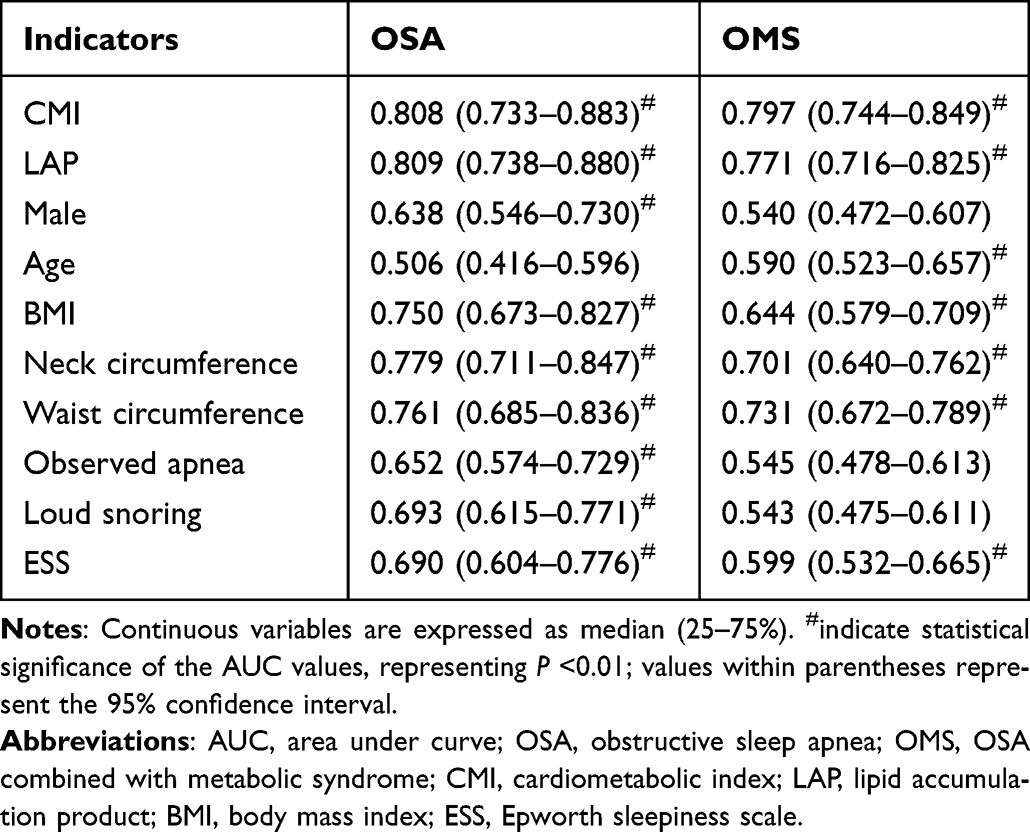 |
Table 4 AUC Values for Different Metrics Screening Across Groups |
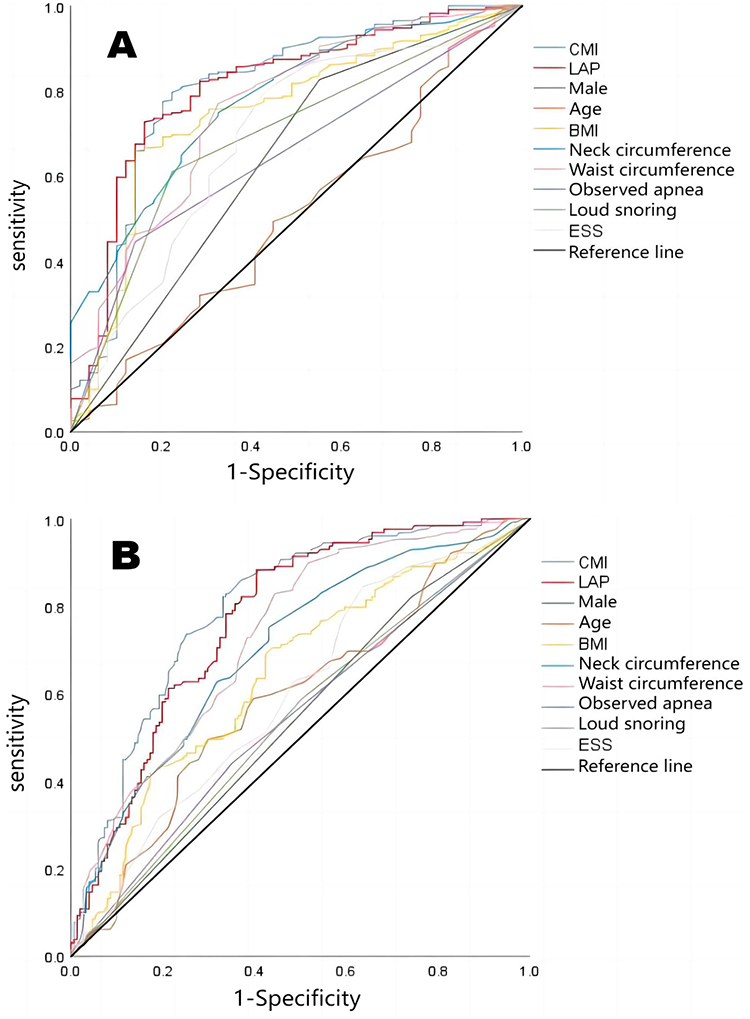 |
Figure 2 The screening value was evaluated by the area under the ROC curve of the various parameters. Abbreviations: CMI, cardiometabolic index; LAP, lipid accumulation product; BMI, body mass index; ESS, Epworth sleepiness scale. Note: (A) For OSA; (B) For OMS. |
Optimal Cutoff Points and Corresponding Screening Efficacy of CMI and LAP for Screening OSA and OMS
The cutoff point with the maximum Youden index was selected according to the ROC curve, and the sensitivity, specificity, PPV, and NPV of the cutoff point were calculated.
In the ROC curve for screening OSA, CMI had a maximum Youden index of 0.572, corresponding to a cutoff point of 0.71, with relatively high sensitivity and specificity at 0.797 (95% CI 0.745–0.848) and 0.776 (95% CI 0.659–0.892), respectively. For LAP, the chosen cutoff point was 48.3, resulting in a sensitivity of 0.727 (95% CI 0.670–0.785) and a specificity of 0.837 (95% CI 0.733–0.940), with lower Youden index and sensitivity (as shown in Table 5).
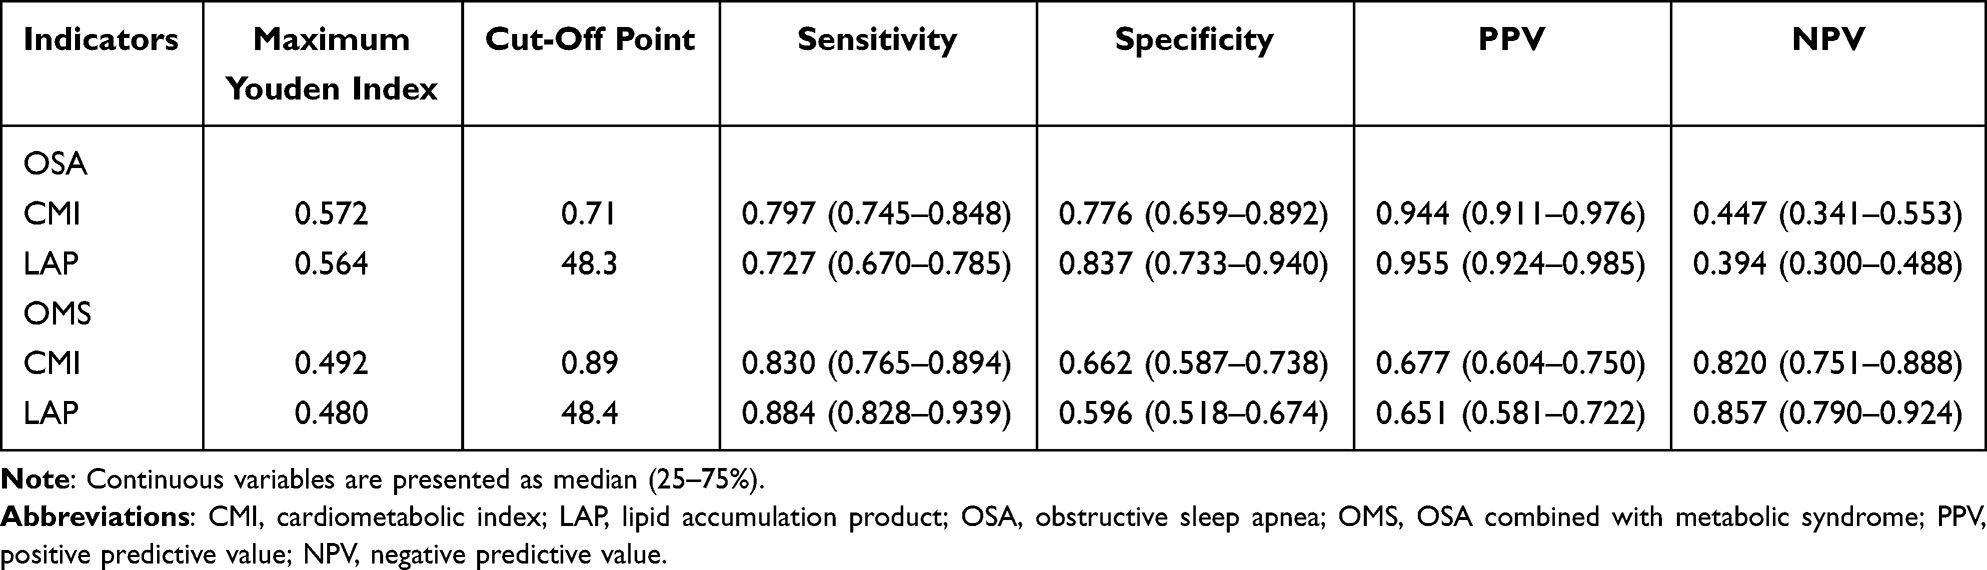 |
Table 5 The Value of CMI and LAP in Screening for OSA and OMS |
The ROC curve for screening OMS demonstrated that CMI had a decreased maximum Youden index of 0.492, with a corresponding cutoff point of 0.89. Sensitivity showed a slight increase to 0.830 (95% CI 0.765–0.894), but specificity significantly decreased to 0.662 (95% CI 0.587–0.738). For LAP, the maximum Youden index dropped to 0.480, with a similar corresponding cutoff point of 48.4. Otherwise, although the sensitivity slightly increased to 0.884 (95% CI 0.828–0.939), the specificity dramatically decreased to 0.596 (95% CI 0.518–0.674) (as shown in Table 5).
Correlation Analysis
All parameters were non-normally distributed data and were transformed to normally distributed data by logarithmic transformation. Pearson correlation analysis was then conducted. The results indicated that LogCMI and LogLAP were positively correlated with LogAHI and negatively correlated with LogMSpO2, LogT90%, and LogLSaO2 (as shown in Table 6, Figure 3). A correlation analysis between PSG parameters and the other indicators including age, BMI, neck circumference, and waist circumference is shown in Table S7.
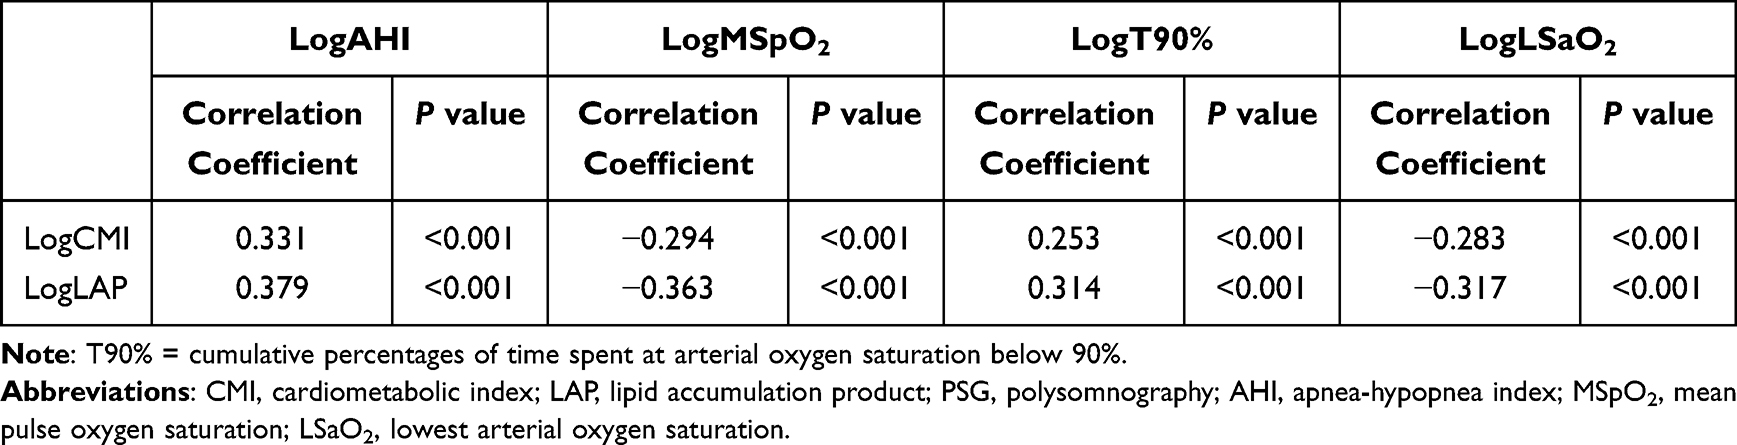 |
Table 6 Comparison of Pearson Correlation Coefficients Between CMI, LAP, and PSG Parameters |
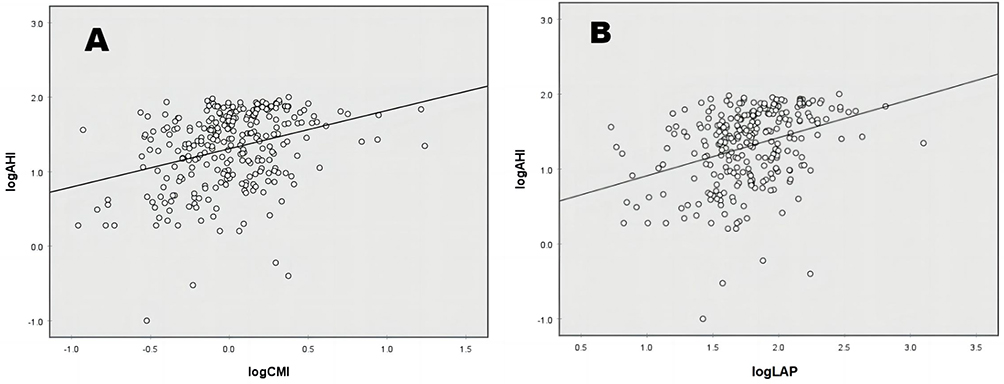 |
Figure 3 The scatterplot of correlation between LogCHI, LogLAP, and LogAHI. Abbreviations: CMI, cardiometabolic index; LAP, lipid accumulation product; AHI, apnea–hypopnea index. Note: (A) LogCMI and LogAHI; (B) LogLAP and LogAHI. |
Multiple Linear Regression Analysis
Multiple linear regression analysis was conducted to evaluate the adjusted correlation between CMI, LAP, and AHI. The results showed that LogCMI and LogLAP were significantly positively correlated with LogAHI, with β coefficients of 0.174 (P = 0.005) and 0.159 (P = 0.026), respectively (as shown in Table 7).
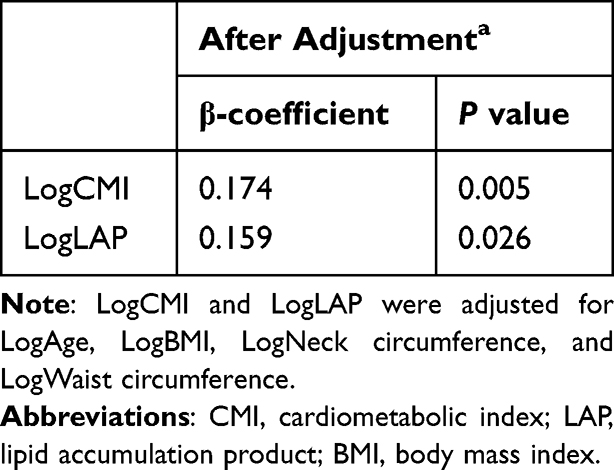 |
Table 7 Multiple Linear Regression Model Evaluating the Relationship Between CMI and LAP and AHI |
Development of a Screening Model for OSA and OMS and Comparison of AUC Values for Each Model
The results found that CMI and LAP are valuable indicators for screening OSA and OMS. Subsequently, logistic regression was performed to establish the screening model for OSA and OMS, with initial parameters selected from 18 demographic and comorbidity-related variables. The optimal cutoff points for CMI and LAP were considered as indicators and finally incorporated into the separate screening models for OSA and OMS.
In the screening model for OSA, a stepwise selection process identified four variables: neck circumference, BMI, loud snoring, and observed apnea, which were used to establish Model A1, with an AUC of 0.852 (95% CI 0.803–0.902). Adding CMI ≥0.71 as an indicator to create Model A2 resulted in an improvement in AUC to 0.887 (95% CI 0.844–0.930). When LAP ≥48.3 was included based on Model A1, Model A3 had a similar AUC to A2, with an AUC of 0.885 (95% CI 0.842–0.931) (as shown in Table 8, Figure 4).
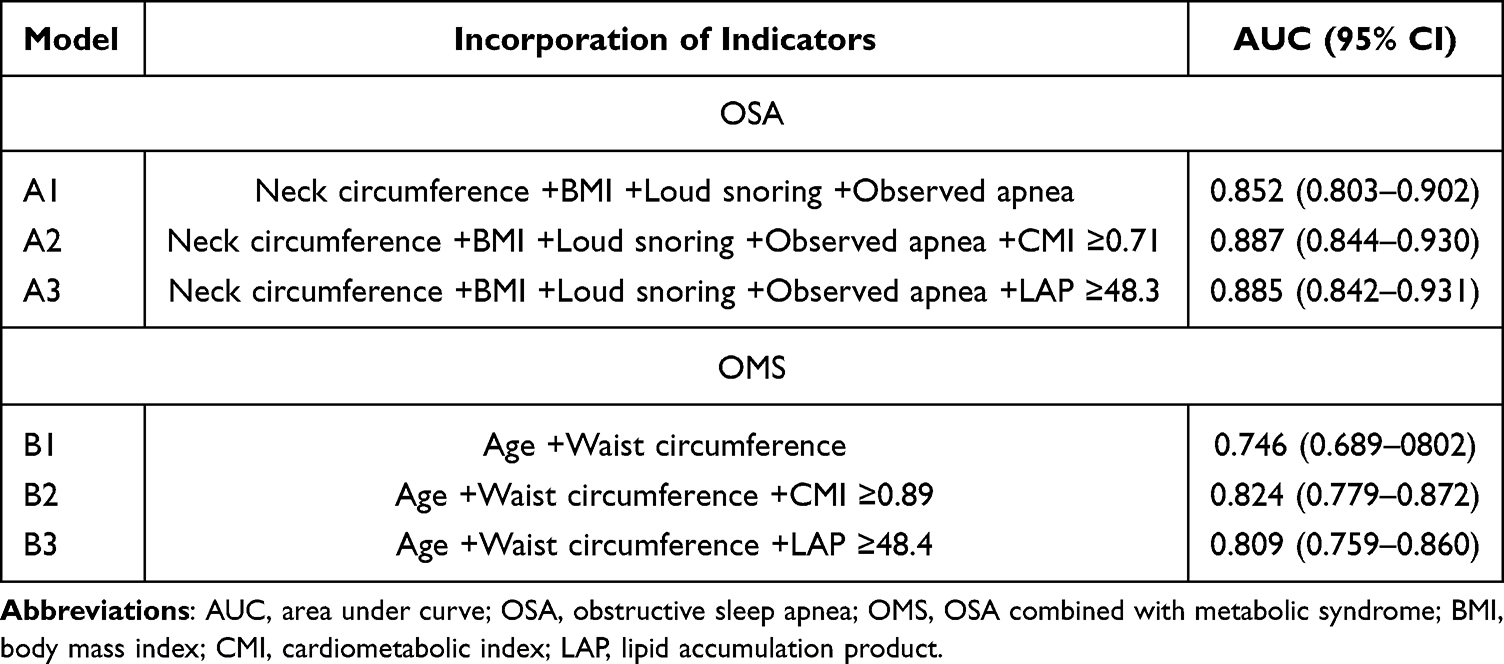 |
Table 8 Comparison of AUC Values of Different Screening Models for OSA and OMS |
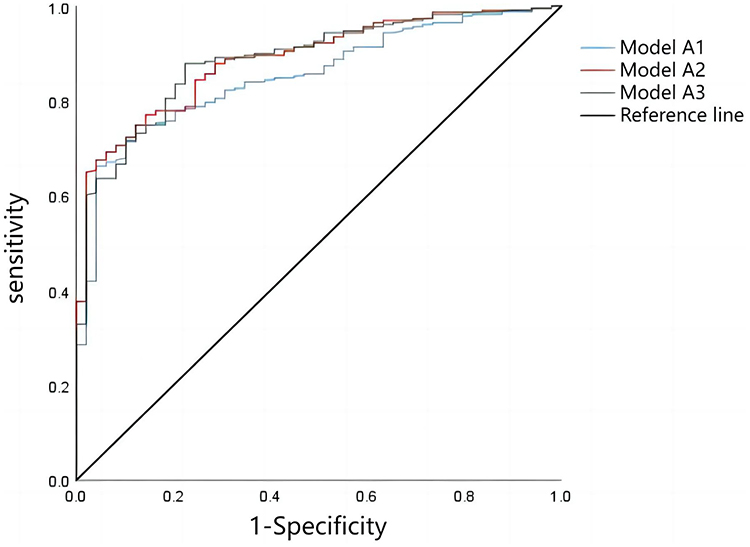 |
Figure 4 ROC curves for the OSA screening model. Abbreviations: ROC, receiver operating curve; OSA, obstructive sleep apnea. |
The initial Model B1 for screening OMS only included age and waist circumference, with an AUC of 0.746 (95% CI 0.689–0.802). The AUC significantly improved to 0.824 (95% CI 0.779–0.872) when adding CMI ≥0.89 as an indicator to create Model B2. Otherwise, when LAP ≥48.4 was incorporated to establish Model B3, the AUC increased to 0.809 (95% CI 0.759–0.860), which was slightly lower than that of Model B2 (as shown in Table 8, Figure 5).
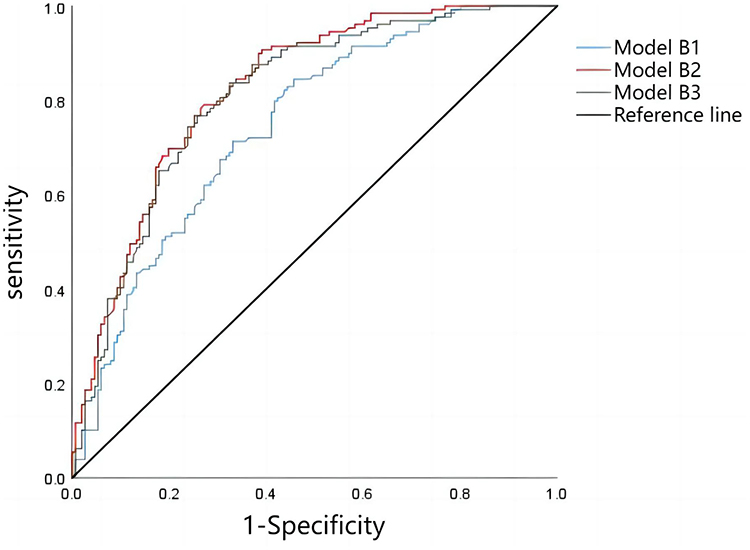 |
Figure 5 ROC curves for the OMS screening model. Abbreviations: ROC, receiver operating curve; OMS, combined with metabolic syndrome. |
Discussion
MetS represents a clinical syndrome intricately linked to hypertension, elevated blood glucose levels, obesity, and dyslipidemia. Notably, the diagnostic criteria extend beyond the mere diagnosis of hypertension and high blood glucose, encompassing early elevations in blood pressure (≥130/85 mmHg), insulin resistance, and impaired glucose tolerance.6 A meta-analysis, encompassing 87 original research articles, unequivocally established the independent association of MetS with the incidence of cardiovascular diseases (RR: 2.35; 95% CI: 2.02–2.73), cardiovascular disease mortality (RR: 2.40; 95% CI: 1.87–3.08), all-cause mortality (RR: 1.58; 95% CI: 1.39–1.78), myocardial infarction (RR: 1.99; 95% CI: 1.61–2.46), and stroke (RR: 2.27; 95% CI: 1.80–2.85).17 Beyond the aforementioned comorbidities, MetS contributes to multi-system diseases, such as non-alcoholic fatty liver disease, which is considered a manifestation of MetS in the liver.18 Furthermore, MetS can exert adverse effects on male fertility by inducing oxidative stress and impairing sperm quality.19 It is implicated in conditions like polycystic ovary syndrome and Alzheimer’s disease.20–22 During the COVID-19 pandemic, reports indicate that approximately 20% of COVID-19 infected patients have comorbid MetS.23 Experts believe that MetS plays a crucial role in influencing viral infection, disease progression, and prognosis assessment.24 MetS is closely associated with multisystem damage and a decline in the quality of life. Similar to OSA, early and appropriate diagnosis and treatment are imperative.
Among the patients with OSA included in this study, the prevalence of MetS was 55.8%. This finding aligns with a large-scale clinical database study conducted by Guo et al8 but notably surpasses the prevalence of MetS as documented in earlier epidemiological surveys.6 This suggests a strong association between OSA and MetS. Many global studies have shown that the prevalence of MetS among OSA patients can be 72.9% to 79%,25,26 indicating the population-specific variations in metabolic profiles among individuals with OSA. Additionally, the data from this study revealed significant differences in the prevalence of MetS between the mild-moderate and severe OSA groups, with rates of 52.4%, and 58.7%, respectively, which were both notably higher than the rate observed in the group of no OSA (16.3%). With increasing severity of OSA, the risk of MetS also increased. Regarding the assessment of metabolic components of MetS, apart from hypertension, the likelihood of abdominal obesity, high blood sugar, elevated TG, and low HDL-C cholesterol levels all increased with the severity of OSA. A meta-analysis by Hou et al3 reported that, compared to individuals with normal sleep breathing, the odds ratios for hypertension in individuals with mild, moderate, and severe OSA were 1.184 (95% CI, 1.093–1.274), 1.316 (95% CI, 1.197–1.433), and 1.561 (95% CI, 1.287–1.835), respectively. The inconsistency among these results and our study may be attributed to the relatively small sample size, potentially introducing statistical bias.
This study examined the statistical differences in multiple variables between patients with isolated OSA and OMS. The results showed that compared to isolated OSA, patients with OMS had higher age, neck circumference, waist circumference, BUN levels, and UA levels. They also had a higher risk of coronary heart disease and heart failure, and there was a significant increase in the likelihood of meeting each criterion in the metabolic score. Of note, patients with isolated OSA were more likely to have comorbid nasal and pharyngeal diseases, with a prevalence of 45.1% vs 31.8% (P < 0.05). Additionally, although there were significant differences in metabolic profiles between the two groups, PSG parameters such as AHI and LSpO2 showed no statistical differences. In the population with isolated OSA, factors such as rhinitis, pharyngitis, and abnormalities in maxillofacial structures may have a greater impact on the severity of OSA, while OSA combined with MetS represents a clinical phenotype highly correlated with central obesity and metabolic disturbances. Continuous Positive Airway Pressure (CPAP) is widely acknowledged as the standard treatment for OSA. However, studies have shown that CPAP cannot significantly reduce patients’ lipid levels, inflammation markers, or reverse insulin resistance and the presence of MetS.27 Metabolic disturbance cannot be reversed solely by improving AHI and sleep efficiency; long-term weight loss is also essential.28 Patients presenting with the clinical phenotype of OMS may consider treatment options that include weight reduction and lifestyle interventions, encompassing dietary and nutritional modifications, aerobic exercise, improved sleep hygiene, smoking cessation, and routine care.29 In addition, metabolic surgical treatments, including laparoscopic sleeve gastrectomy, laparoscopic Roux-en-Y gastric bypass, and biliopancreatic diversion with duodenal switch, can also be considered.30 Following these treatments, patients exhibiting this phenotype typically experience substantial improvements in OSA symptoms, obesity, and metabolic disturbances.31–33
In recent years, researchers have examined the value of complex lipid indices such as the atherogenic index of plasma (AIP), visceral adiposity index (VAI), and LAP for screening OSA. Zhao et al analyzed LAP and VAI in a large cross-sectional cohort of 86 patients who underwent weight loss surgery, concluding that LAP exhibits a stronger correlation with OSA compared to VAI.34 Zou et al compared LAP, VAI, and triglyceride-glucose index in another large Chinese cohort and found that LAP outperformed the other two complex lipid indices in detecting OSA, with AUC values of 0.742 (95% CI: 0.713–0.771), 0.680 (95% CI: 0.648–0.712), and 0.697 (95% CI: 0.666–0.729), respectively.35 Similarly, Bikov et al conducted a study with 802 subjects and found that in ROC curves for identifying OSA, the AUC values for VAI, AIP, and LAP were 0.631 (95% CI: 0.598–0.666), 0.653 (95% CI: 0.619–0.686), and 0.726 (95% CI: 0.694–0.757), respectively.36 Currently, there is no research exploring the potential application value of CMI in screening for OSA and OMS. The lipid profile, including TG and HDL-C, is one of the common metabolic assessment parameters used in various clinical departments. Clinicians can quickly assess CMI by examining lipid profiles and measuring waist circumference and height. Therefore, this study primarily aims to assess the application value of CMI by comparing it with LAP, which has already been validated for screening utility.
This study found that the correlation between CMI, LAP, and AHI had Pearson coefficients of only 0.331 and 0.379, both significantly lower than neck circumference and waist circumference. These findings may suggest a relatively weak correlation between the values of CMI and LAP and the severity of OSA. This conclusion is supported by Dong et al, who found that LAP and AHI were not significantly correlated.37 Possible reasons for this weak correlation include (1) OSA is a highly heterogeneous disease, and the patients have multiple contributing factors. Blood lipid levels and the degree of obesity may not completely explain the variability and individual differences in the severity of OSA. (2) The study included subjects who may have a history of high blood lipids or obesity treatment, and the treatment process and effectiveness can influence blood lipid levels and obesity. (3) The sample size in this study was limited, which can introduce statistical bias. In our study, CMI had an AUC value of about 0.8 for both OSA and OMS, slightly better than LAP, demonstrating good screening performance. At the optimal cutoff points for OSA and OMS, the Youden index of CMI exceeded that of LAP, with its sensitivity consistently surpassing 0.78. When considering sensitivity and specificity, screening indicators should prioritize high sensitivity to enhance disease detection, reduce the rate of false negatives, and mitigate the adverse consequences of missed diagnosis for patients. The optimal cutoff points for CMI in screening OSA and OMS were 0.71 and 0.89, respectively. In contrast to LAP, which exhibited no significant change in cutoff points (48.3–48.4), the gradient increase in screening cutoff points can better assess the progression of the disease in patients with OSA. Above all, CMI has a more practical screening value for OSA and OMS compared to LAP.
Most previous studies have primarily explored the relationship between complex lipid indices and OSA or MetS by ROC curves, without building screening models based on these indices for hospitalized patients. This study used the multiple logistic regression to establish the screening models for OSA and OMS. The results showed that the AUC of the final screening model for OSA including CMI ≥0.71 was 0.887, and the AUC of the final OMS screening model including CMI ≥0.89 was 0.824. Remarkably, the AUC values of the above models are slightly higher than those of the models that include LAP as an additional indicator. Our study demonstrates that screening models consisting of demographic characteristics and composite lipid indices can effectively identify OSA and MetS.
This study has several limitations. Firstly, the participants included in this study came to sleep medicine center for suspected OSA, leading to a certain degree of selection bias. The results showed that patients with mild-moderate OSA were elder and had a larger prevalence of hypertension, and the possible explanation is that these elder patients had fewer OSA-related symptoms and were referred to a sleep center because of comorbidities such as hypertension. The screening value of each indicator and model should be prospectively validated in inpatients. Secondly, this is a retrospective study with a small sample size, and the causal association between OSA and MetS cannot be confirmed. Lastly, sleep parameters did not include the sleep architecture in this study, so they cannot reflect the relationship between CMI and sleep architecture.
Conclusions
OSA combined with metabolic syndrome is very common, and the prevalence of metabolic syndrome increases with the severity of OSA. OMS represents a specific clinical phenotype characterized by central obesity and metabolic disturbances. It requires a comprehensive assessment of factors such as obesity, renal function, lipid profile, and uric acid levels. Clinical indicators like CMI and LAP are easily accessible and closely associated with OSA and MetS. CMI and LAP can effectively screen for OSA and OMS, while CMI demonstrates more practical cutoff values for identifying the disease states. Screening models based on CMI demonstrate a high discriminatory ability for OSA and OMS, which may be a routine screening tool for hospitalized patients.
Abbreviations
AHI, apnea hypopnea index; AUC, area under curve; AIP, atherogenic index of plasma; BMI, body mass index; BUN, blood urea nitrogen; CPAP, continuous positive airway pressure; CMI, cardiometabolic index; CVD, cardiovascular diseases; COPD, chronic obstructive pulmonary disease; ESS, Epworth sleepiness scale; FBG, fasting blood glucose; GERD, gastroesophageal reflux disease; GLP-1, glucagon-like peptide-1; HDL-C, high-density lipoprotein cholesterol; HbA1c, hemoglobin A1c; IH, intermittent hypoxia; LAP, lipid accumulation product; LSaO2, lowest arterial oxygen saturation; LDL-C, low-density lipoprotein cholesterol; MSpO2, mean pulse oxygen saturation; MetS, metabolic syndrome; OSA, obstructive sleep apnea; OMS, OSA combined with Mets; PSG, polysomnography; PPV, positive predictive value; ROC, receiver operating curve; Scr, serum creatinine; T90%, cumulative percentages of time spent at arterial oxygen saturation below 90%; TC, total cholesterol; TG, triglycerides; UA, uric acid; VAI, visceral adiposity index; NPV, negative predictive value; 90% CI, 95% Confidence interval.
Data Sharing Statement
The data used to support the findings of this study are available from the corresponding author upon request.
Acknowledgments
We would also like to thank Professor Nanshan Zhong from the State Key Laboratory of Respiratory Disease for the constructive advice he gave.
Funding
This research project was supported by Basic Research Project (Dengfeng hospital) jointly funded by Guangzhou City and the School (No.202201020586) and the Natural Science Foundation of Guangdong Province China (No. 2019A1515010981).
Disclosure
The authors report no conflicts of interest in this work.
References
1. Gottlieb DJ, Punjabi NM. Diagnosis and management of obstructive sleep apnea: a review. JAMA. 2020;323(14):1389. doi:10.1001/jama.2020.3514
2. Castaneda A, Jauregui-Maldonado E, Ratnani I, et al. Correlation between metabolic syndrome and sleep apnea. World J Diabetes. 2018;9(4):66. doi:10.4239/wjd.v9.i4.66
3. Hou HF, Zhao YG, Yu WQ, et al. Association of obstructive sleep apnea with hypertension: a systematic review and meta-analysis. J Glob Health. 2018;8(1):010405. doi:10.7189/jogh.08.010405
4. Wu ZH, Yang XP, Niu X, et al. The relationship between obstructive sleep apnea hypopnea syndrome and gastroesophageal reflux disease: a meta-analysis. Sleep Breathing. 2019;23(2):389–397. doi:10.1007/s11325-018-1691-x
5. Fahed G, Aoun L, Zerdan MB, et al. Metabolic syndrome: updates on pathophysiology and management in 2021. Int J Mol Sci. 2022;23(2):786. doi:10.3390/ijms23020786
6. Saklayen MG. The global epidemic of the metabolic syndrome. Curr Hypertens Rep. 2018;20(2):12. doi:10.1007/s11906-018-0812-z
7. Ansarimoghaddam A, Adineh HA, Zareban I, et al. Prevalence of metabolic syndrome in Middle-East countries: meta-analysis of cross-sectional studies. Diabetes Metab Syndr. 2018;12(2):195. doi:10.1016/j.dsx.2017.11.004
8. Guo WB, Liu YP, Xu HH, et al. Obstructive sleep apnea and metabolic syndrome: an association study based on a large sample clinical database. Zhonghua Er Bi Yan Hou Tou Jing Wai Ke Za Zhi. 2021;56(12):1263–1269. doi:10.3760/cma.j.cn115330-20210531-00314
9. Drager LF, Lopes HF, Maki-Nunes C, et al. The impact of obstructive sleep apnea on metabolic and inflammatory markers in consecutive patients with metabolic syndrome. PLoS One. 2010;5(8):e12065. doi:10.1371/journal.pone.0012065
10. Hirotsu C, Haba-Rubio J, Togeiro SM, et al. Obstructive sleep apnoea as a risk factor for incident metabolic syndrome: a joined Episono and HypnoLaus prospective cohorts study. Eur Respir J. 2018;52(5):1801150. doi:10.1183/13993003.01150-2018
11. Peppard PE, Young T, Palta M, et al. Longitudinal study of moderate weight change and sleep-disordered breathing. JAMA. 2000;284(23):3015–3021. doi:10.1001/jama.284.23.3015
12. Molnar V, Lakner Z, Molnar A, et al. The predictive role of the upper-airway adipose tissue in the pathogenesis of obstructive sleep apnoea. Life. 2022;12(10):1543. doi:10.3390/life12101543
13. Liu X, Wu Q, Yan G, et al. Cardiometabolic index: a new tool for screening the metabolically obese normal weight phenotype. J Endocrinol Invest. 2021;44(6):1253–1261. doi:10.1007/s40618-020-01417-z
14. Cai XT, Hu JL, Wen W, et al. Associations of the cardiometabolic index with the risk of cardiovascular disease in patients with hypertension and obstructive sleep apnea: results of a longitudinal cohort study. Oxid Med Cell Longev. 2022;2022:4914791. doi:10.1155/2022/4914791
15. Behnoush AH, Bahiraie P, Varniab ZS, et al. Composite lipid indices in patients with obstructive sleep apnea: a systematic review and meta-analysis. Lipids Health Dis. 2023;22(1):84. doi:10.1186/s12944-023-01859-3
16. Sateia MJ. International classification of sleep disorders-third edition: highlights and modifications. Chest. 2014;146(5):1387–1394. doi:10.1378/chest.14-0970
17. Mottillo S, Filion KB, Genest J, et al. The metabolic syndrome and cardiovascular risk a systematic review and meta-analysis. J Am College Cardiol. 2010;56(14):1113–1132. doi:10.1016/j.jacc.2010.05.034
18. Friedman SL, Neuschwander-Tetri BA, Rinella M, et al. Mechanisms of NAFLD development and therapeutic strategies. Nature Med. 2018;24(7):908–922. doi:10.1038/s41591-018-0104-9
19. Salvio G, Ciarloni A, Cutini M, et al. Metabolic syndrome and male fertility: beyond heart consequences of a complex cardiometabolic endocrinopathy. Int J Mol Sci. 2022;23(10):5497. doi:10.3390/ijms23105497
20. Sanchez-Garrido MA, Tena-Sempere M. Metabolic dysfunction in polycystic ovary syndrome: pathogenic role of androgen excess and potential therapeutic strategies. Mol Metabol. 2020;35:100937. doi:10.1016/j.molmet.2020.01.001
21. Taylor VH, MacQueen GM. Cognitive dysfunction associated with metabolic syndrome. Obesity Rev. 2007;8(5):409–418. doi:10.1111/j.1467-789X.2007.00401.x
22. Campos-Peña V, Toral-Rios D, Becerril-Pérez F, et al. Metabolic syndrome as a risk factor for alzheimer’s disease: is Aβ a crucial factor in both pathologies? Antioxid Redox Signal. 2017;26(10):542–560. doi:10.1089/ars.2016.6768
23. Costa FF, Rosario WR, Ribeiro Farias AC, et al. Metabolic syndrome and COVID-19: an update on the associated comorbidities and proposed therapies. Diabetes Metabolic Syndrome. 2020;14(5):809–814. doi:10.1016/j.dsx.2020.06.016
24. Zuin M, Rigatelli G, Bilato C, et al. Prognostic role of metabolic syndrome in COVID-19 patients: a systematic review meta-analysis. Viruses. 2021;13(10):1938. doi:10.3390/v13101938
25. Agrawal S, Sharma SK, Sreenivas V, et al. Prevalence of metabolic syndrome in a north Indian hospital-based population with obstructive sleep apnoea. Indian J Med Res. 2011;134(5):639–644. doi:10.4103/0971-5916.90988
26. Chaudhary P, Goyal A, Goel SK, et al. Women with OSA have higher chances of having metabolic syndrome than men: effect of gender on syndrome Z in cross sectional study. Sleep Med. 2021;79:83–87. doi:10.1016/j.sleep.2020.12.042
27. Jullian-Desayes I, Joyeux-Faure M, Tamisier R, et al. Impact of obstructive sleep apnea treatment by continuous positive airway pressure on cardiometabolic biomarkers: a systematic review from sham CPAP randomized controlled trials. Sleep Med Rev. 2015;21:23–28. doi:10.1016/j.smrv.2014.07.004
28. Gaines J, Vgontzas AN, Fernandez-Mendoza J, et al. Obstructive sleep apnea and the metabolic syndrome: the road to clinically-meaningful phenotyping, improved prognosis, and personalized treatment. Sleep Med Rev. 2018;42:211–219. doi:10.1016/j.smrv.2018.08.009
29. Giampá SQC, Lorenzi G, Drager LF. Obstructive sleep apnea and metabolic syndrome. Obesity. 2023;31(4):900–911. doi:10.1002/oby.23679
30. Genser L, Mariolo JRC, Castagneto-Gissey L, et al. Obesity, type 2 diabetes, and the metabolic syndrome pathophysiologic relationships and guidelines for surgical intervention. Surgical Clinic North Am. 2016;96(4):681. doi:10.1016/j.suc.2016.03.013
31. Zou J, Zhang P, Yu H, et al. Effect of laparoscopic Roux-en-Y gastric bypass surgery on obstructive sleep apnea in a Chinese population with obesity and T2DM. Obesity Surg. 2015;25(8):1446–1453. doi:10.1007/s11695-014-1510-9
32. Xu HJ, Zhang P, Han XD, et al. Sex effect on obesity indices and metabolic outcomes in patients with obese obstructive sleep apnea and type 2 diabetes after laparoscopic Roux-en-Y gastric bypass surgery: a preliminary study. Obesity Surg. 2016;26(11):2629–2639. doi:10.1007/s11695-016-2140-1
33. Carneiro-Barrera A, Amaro-Gahete FJ, Guillén-Riquelme A, et al. Effect of an interdisciplinary weight loss and lifestyle intervention on obstructive sleep apnea severity the INTERAPNEA randomized clinical trial. JAMA Network Open. 2022;5(4):e228212. doi:10.1001/jamanetworkopen.2022.8212
34. Zhao XL, Xu HJ, Qian YJ, et al. Abdominal obesity is more strongly correlated with obstructive sleep apnea than general obesity in China: results from two separated observational and longitudinal studies. Obesity Surg. 2019;29(8):2535–2547. doi:10.1007/s11695-019-03870-z
35. Zou JJ, Wang YY, Xu HJ, et al. The use of visceral adiposity variables in the prediction of obstructive sleep apnea: evidence from a large cross-sectional study. Sleep Breathing. 2020;24(4):1373–1382. doi:10.1007/s11325-019-01980-7
36. Bikov A, Frent S, Reisz D, et al. Comparison of composite lipid indices in patients with obstructive sleep apnoea. Nat Sci Sleep. 2022;14:1333–1340.
37. Dong LQ, Lin MZ, Wang WG, et al. Lipid accumulation product (LAP) was independently associated with obstructive sleep apnea in patients with type 2 diabetes mellitus. BMC Endocr Disord. 2020;20(1):179. doi:10.1186/s12902-020-00661-x
 © 2024 The Author(s). This work is published and licensed by Dove Medical Press Limited. The full terms of this license are available at https://www.dovepress.com/terms.php and incorporate the Creative Commons Attribution - Non Commercial (unported, v3.0) License.
By accessing the work you hereby accept the Terms. Non-commercial uses of the work are permitted without any further permission from Dove Medical Press Limited, provided the work is properly attributed. For permission for commercial use of this work, please see paragraphs 4.2 and 5 of our Terms.
© 2024 The Author(s). This work is published and licensed by Dove Medical Press Limited. The full terms of this license are available at https://www.dovepress.com/terms.php and incorporate the Creative Commons Attribution - Non Commercial (unported, v3.0) License.
By accessing the work you hereby accept the Terms. Non-commercial uses of the work are permitted without any further permission from Dove Medical Press Limited, provided the work is properly attributed. For permission for commercial use of this work, please see paragraphs 4.2 and 5 of our Terms.