Back to Journals » Clinical Ophthalmology » Volume 14
Wide Stromal Mapping Using an Anterior Segment Optical Coherence Tomography
Authors Hashmani N ![]() , Hashmani M, Asghar N, Islam M, Hashmani S
, Hashmani M, Asghar N, Islam M, Hashmani S
Received 12 December 2019
Accepted for publication 26 February 2020
Published 10 March 2020 Volume 2020:14 Pages 751—757
DOI https://doi.org/10.2147/OPTH.S242035
Checked for plagiarism Yes
Review by Single anonymous peer review
Peer reviewer comments 2
Editor who approved publication: Dr Scott Fraser
Nauman Hashmani, Maria Hashmani, Noureen Asghar, Mahnoor Islam, Sharif Hashmani
Department of Ophthalmology and Visual Sciences, Hashmanis Hospital, Karachi, Pakistan
Correspondence: Nauman Hashmani 68/B Khayaban-e-Shahbaz, DHA Phase 7, Karachi, Pakistan
Tel +92 321-2828062
Email [email protected]
Purpose: To quantify and assess the reproducibility of the corneal stromal thickness profiles captured by the SD-OCT. Secondly, we correlated the zonal thicknesses to the age, gender and axial length.
Methods: We included 227 normal eyes of 227 patients with a maximum hypermetropia of +5 and myopia of – 6 diopters (D). Subjects with an intraocular pressure exceeding 22 mm Hg, evidence of cataract formation, history of ophthalmic surgery or disease were excluded. Lastly, reproducibility was evaluated in a subset of 50 participants by means of an identical scan protocol repeated by 2 different OCT operators.
Results: Stromal values were consistently thicker in the peripheral cornea (p< 0.001). Age was negatively correlated with approximately every sector of the stroma with notable exceptions of the center (r=0.117, p=0.088) and the superior inner (r=0.057, 0.409), middle (r=0.086, p=0.209) and outer locations (r=0.120, p=0.079). There was no statistical significance in most sectors when looking at the axial length, gender and K1/K2. This method was highly reproducible in terms of both the ICC and COV.
Conclusion: Corneal stromal mapping is highly reproducible and shows a negative correlation to age. Additionally, the periphery of the stroma is consistently thicker to the center. Other variables like gender and axial length show no relationship to the corneal stroma.
Keywords: cornea, corneal stroma, OCT, AS-OCT, tomography, topography
Introduction
The anterior segment optical coherence tomography (AS-OCT) came into existence for the first time in 1994 based on the time-domain OCT (TD-OCT).1 This technology had a resolution of 30 μm and therefore it could generate corneal pachymetry maps; however, it was not optimal to delineate individual layers, like the corneal epithelium. In 2002, the spectral-domain OCT (SD-OCT) drastically increased the scan speed and resolution; this led to the introduction of automated algorithms to map the epithelium and the stroma.2
Previous research has focused on the very high-frequency digital ultrasound to carry out stromal mapping of the cornea.3 A newly released and commercially available algorithm for the Avanti RTVue XR (Optovue, Inc., Fremont, CA, USA) has allowed clinicians to map the central 9 mm of the corneal stroma using the SD-OCT. This is a potential non-contact alternative tool to map the cornea.
To our knowledge, there are a lack of studies on the corneal stromal thickness and its association with demographic variables. Furthermore, a dearth of information exists on the reproducibility of commercially available SD-OCT stromal mapping, especially in the periphery of the cornea. Therefore, we aimed to create these maps in healthy eyes and correlate them with age, gender and axial length. Also, we observed interobserver reproducibility of each zonal measurement using 9 mm maps.
Methods
Study Design and Ethical Statement
This cross-sectional study was performed in patients presenting to the Hashmanis Hospital, Karachi, Pakistan for routine eye checkup. All patients were administered a written informed consent. In addition, the study adhered to the Declaration of Helsinki and was approved by the Ethics Committee of the Hospital. This study is an extension of our previous study measuring the corneal epithelium4 and therefore some of the analysis presented here is similar.
Inclusion/Exclusion Criteria
We included one eye from self-reported ophthalmologically healthy patients between 20 and 75 years of age. If both eyes met the inclusion criteria, one was randomly selected. The following tests were administered to each patient before inclusion: auto refractometer (Topcon KR-800, Tokyo, Japan), air-puff tonometer (Reichert 7CR, Reichert, Inc., Depew, NY, USA), visual acuity via a Snellen chart, slit lamp exam with a full-dilated fundus, optical biometer (Wavelight OB-820, WaveLight, Erlangen, Germany), corneal tomography (Pentacam HR; Oculus, Wetzlar, Germany), and the commercially available SD-OCT (Optovue, Inc) for both posterior and anterior segment imaging. All eyes were scanned during the hours of 8:00 AM to 1:00 PM to account for diurnal variation in corneal thickness.
Patients with the following characteristics were included. A maximum hypermetropia of +5 diopters (D) and myopia of −6 D, a minimum best-corrected visual acuity (BCVA) of 0.8, a maximum IOP of 22 mmHg, no previous ophthalmic surgery or evidence of cataract formation.
Patients with evidence of vitreoretinal or corneal diseases like keratoconus or form fruste keratoconus, dystrophies or dry eyes (Schirmer’s test 2 value below 5 mm) were excluded. In addition, those with an indication of visual field loss (clinical examination), glaucoma, amblyopia, systemic disease, pregnancy or lactation were excluded as well. No patient was on any systemic or topical medications.
Optical Coherence Tomography Scan Protocol
All eyes were scanned using an anterior segment SD-OCT with a commercial software that can cover the central 9 mm of the cornea. The stroma includes the bowman’s layer down to the endothelium. The specifications of this OCT machine are as follows: a 5 μm axial resolution with a 22 μm beam width and a light source with a median wavelength of 840 nm. Figure 1 demonstrates a sample image of the stromal map. The zones were divided into the central (2 mm), inner (2–5 mm), middle (5–7 mm) and outer (7–9 mm).
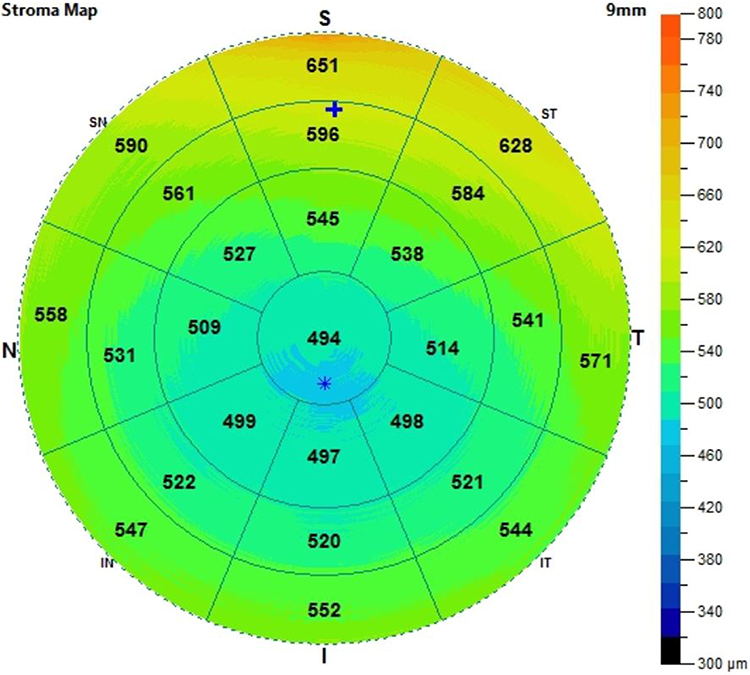 |
Figure 1 A 9 mm stromal map. The zones were divided into the central (2 mm), inner (2–5 mm), middle (5–7 mm) and outer (7–9 mm). |
Each eye was dilated with 1% tropicamide for a posterior segment examination and then, each eye was permitted to return to its original non-dilated state for an anterior segment OCT scan. All scans were checked for the quality of their scans and only those without obvious artifacts were included. Additionally, any scan with a net-like pattern indicating signal blockage was excluded.
Reproducibility
The interobserver reproducibility was measured using identical scan protocols on one eye by two OCT technicians.
Statistical Analysis
Sample size was calculated according to the following formula 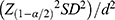 , with an assumption of a 95% confidence interval
  , a margin of error of 5 μm and a standard deviation of 32.5. The minimal sample came out to be 162.
The Statistical Package for the Social Sciences (SPSS v23; SPSS, Inc., Chicago, IL, USA) was used for all data analysis. Descriptive statistics (mean and standard deviations) were calculated for each zonal measurement and the various demographic factors. The following statistical tests were used one-way ANOVA, Pearson product moment correlation coefficient, partial correlation, student’s t-test and a multiple regression analysis. For measuring reproducibility, the following were employed: coefficient of variation (CV) and the intraclass correlation coefficient (ICC). Statistical significance was considered when p-value was < 0.05.
Results
Patients
We included 227 patients with 118 males and 109 females. The mean age for this population was 40.0 years (20–75 years). The general characteristics are shown in Table 1.
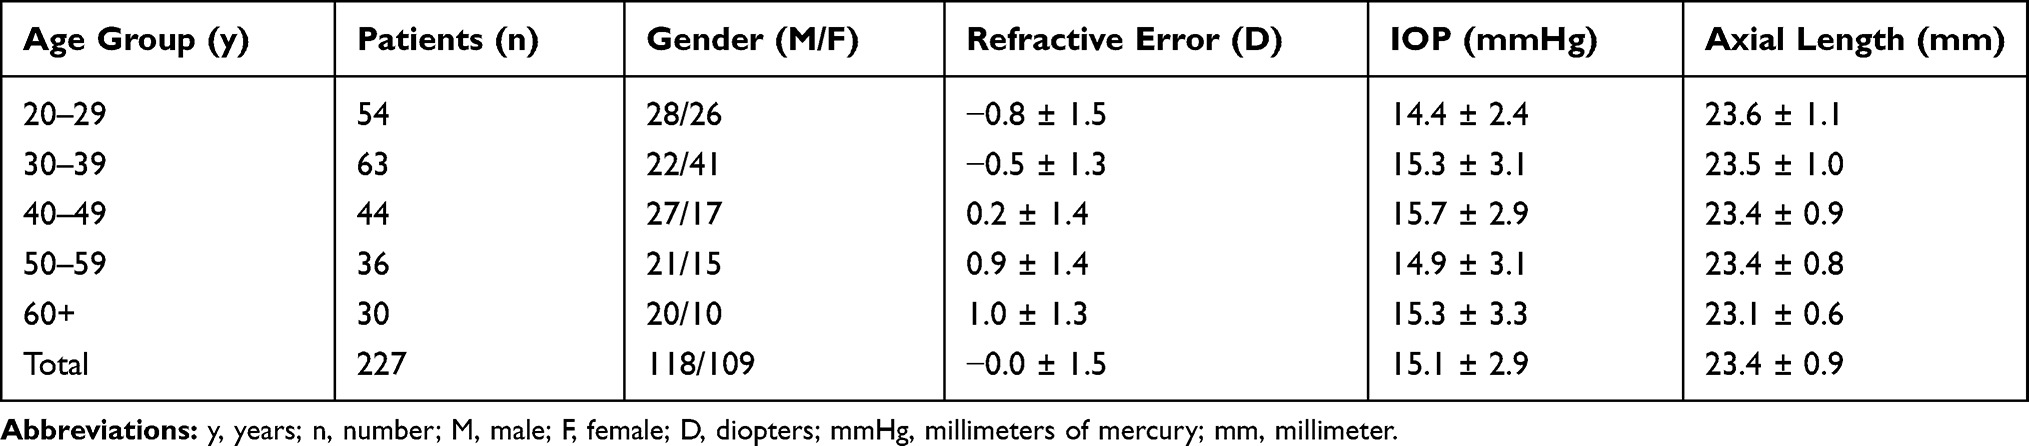 |
Table 1 General Characteristics |
Corneal Stromal Thickness
The data presented as mean and standard deviations of the various stromal sectors have been presented in Table 2. Stromal values were consistently thicker in the peripheral cornea (p<0.001). The outermost section of the cornea was between 14.8% and 28.5% thicker than the central, with the superior quadrant showing the largest value. The thinnest point was the center with a mean of 467.0 ± 31.1 μm. When looking at the peripheral cornea, the thickest point was the superior quadrant with mean values of 506.3 ± 33.4 μm, 553.5 ± 35.1 μm and 600.0 ± 39.9 μm in the inner, middle and outer zones, respectively.
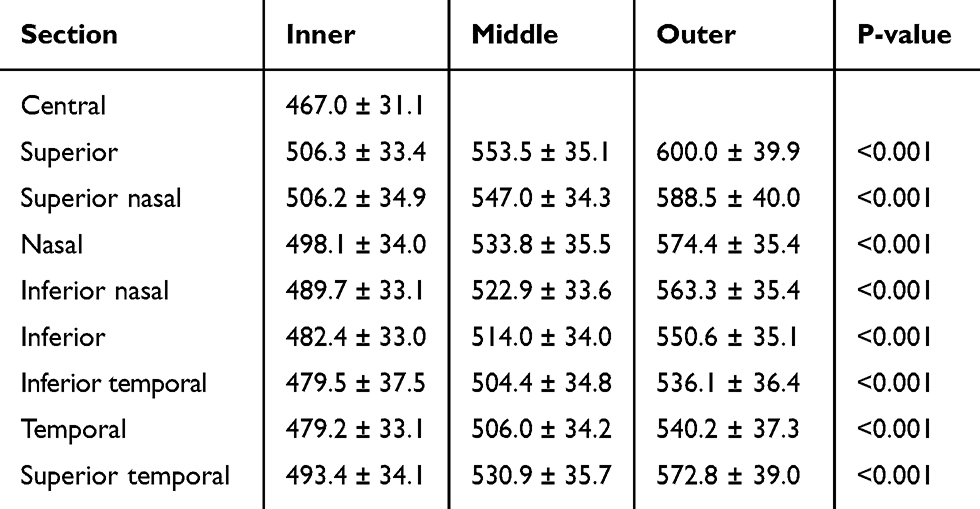 |
Table 2 Thickness by Section |
Keratometry
The K1 and K2 averaged 43.5 ± 1.5 and 44.2 ± 1.6, respectively. There was no correlation between stromal thickness and K1 (r=0.07, p=0.35) and K2 (r=0.06, p=0.36).
Gender
All sectors were similar between the two genders. This can be seen in Table 3. Additionally, no statistically significant difference was found among the sexes in the following variables: sphere (p=0.089), cylinder (p=0.169), spherical equivalent (p=0.071), IOP (p=0.066) and axial length (p=0.098).
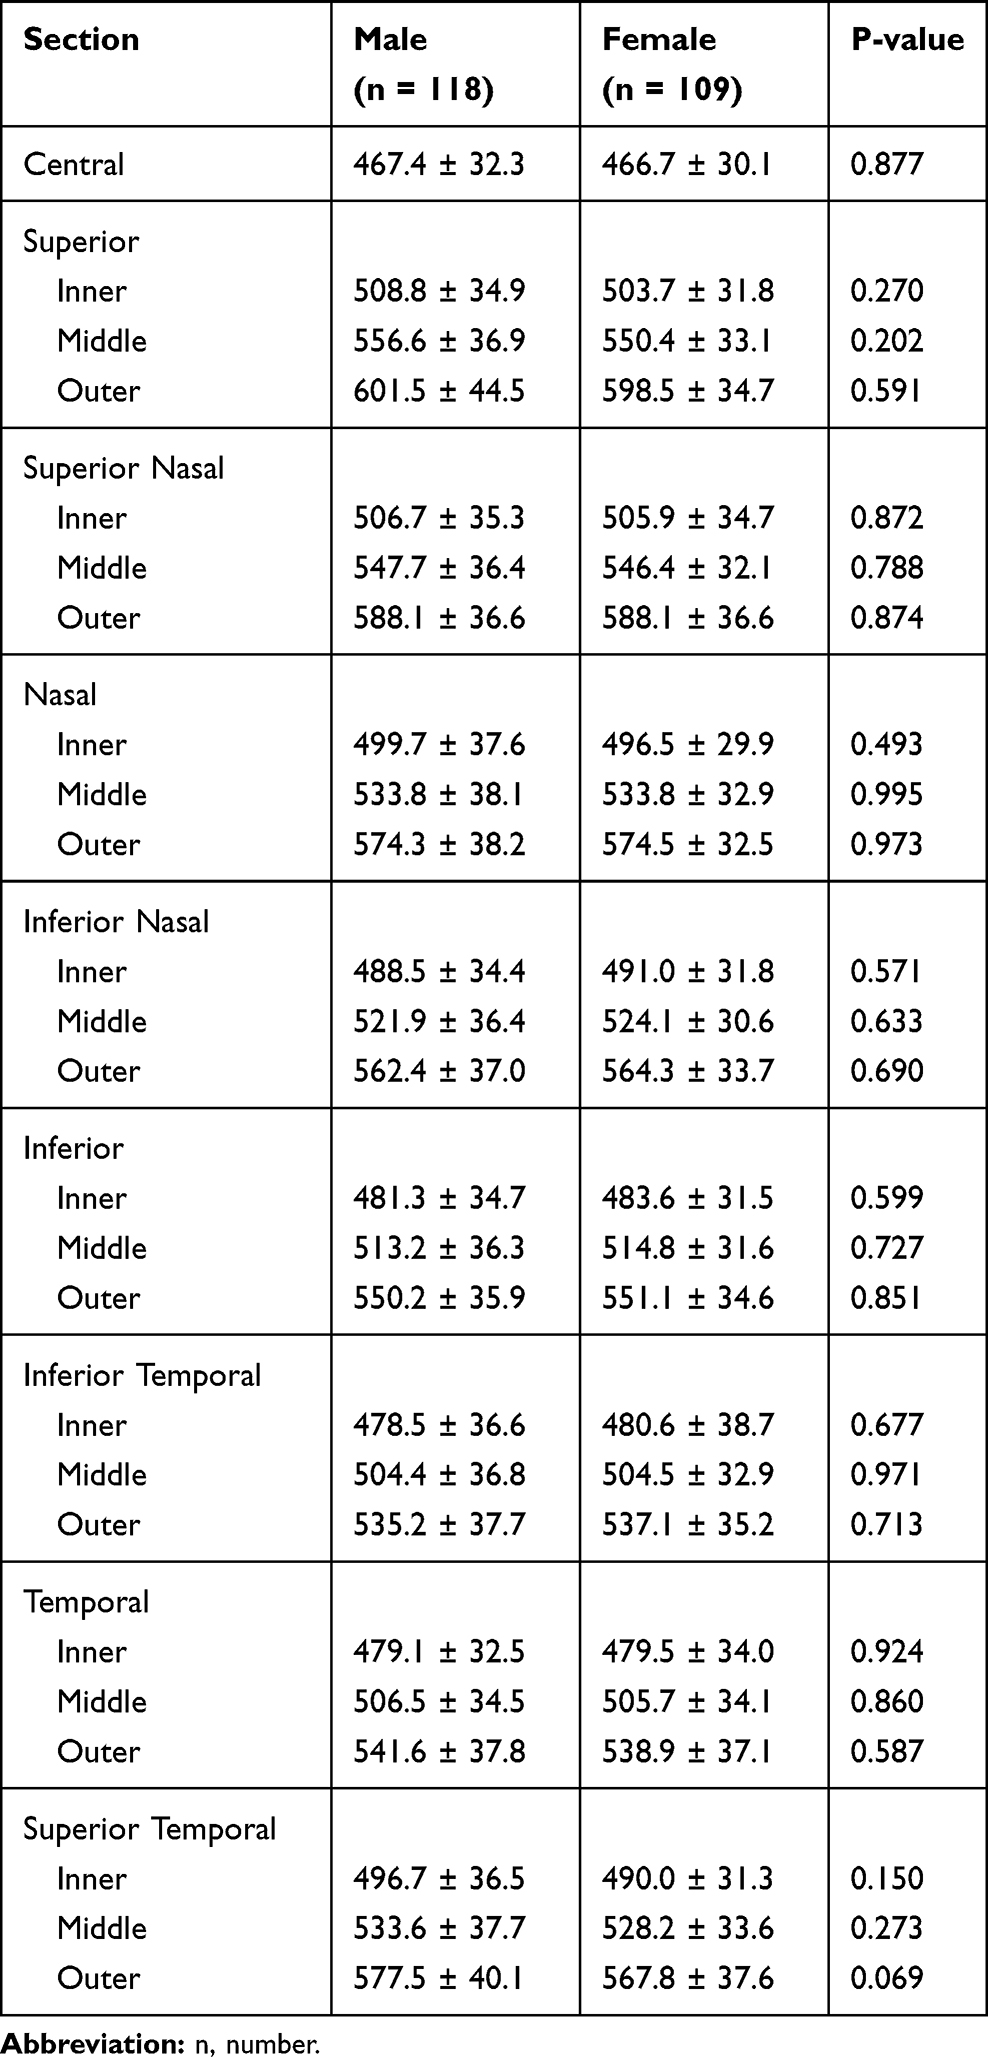 |
Table 3 Gender Differences |
Age
Age was negatively correlated with approximately every sector of the stroma with notable exceptions of the center (r=0.117, p=0.088) and the superior inner (r=0.057, 0.409), middle (r=0.086, p=0.209) and outer locations (r=0.120, p=0.079). Interestingly, the strength of the correlation was seen to increase from the center towards the periphery (inner location < middle location < outer location) for each relevant quadrant. The correlations of age and stromal thickness are displayed in Table 4.
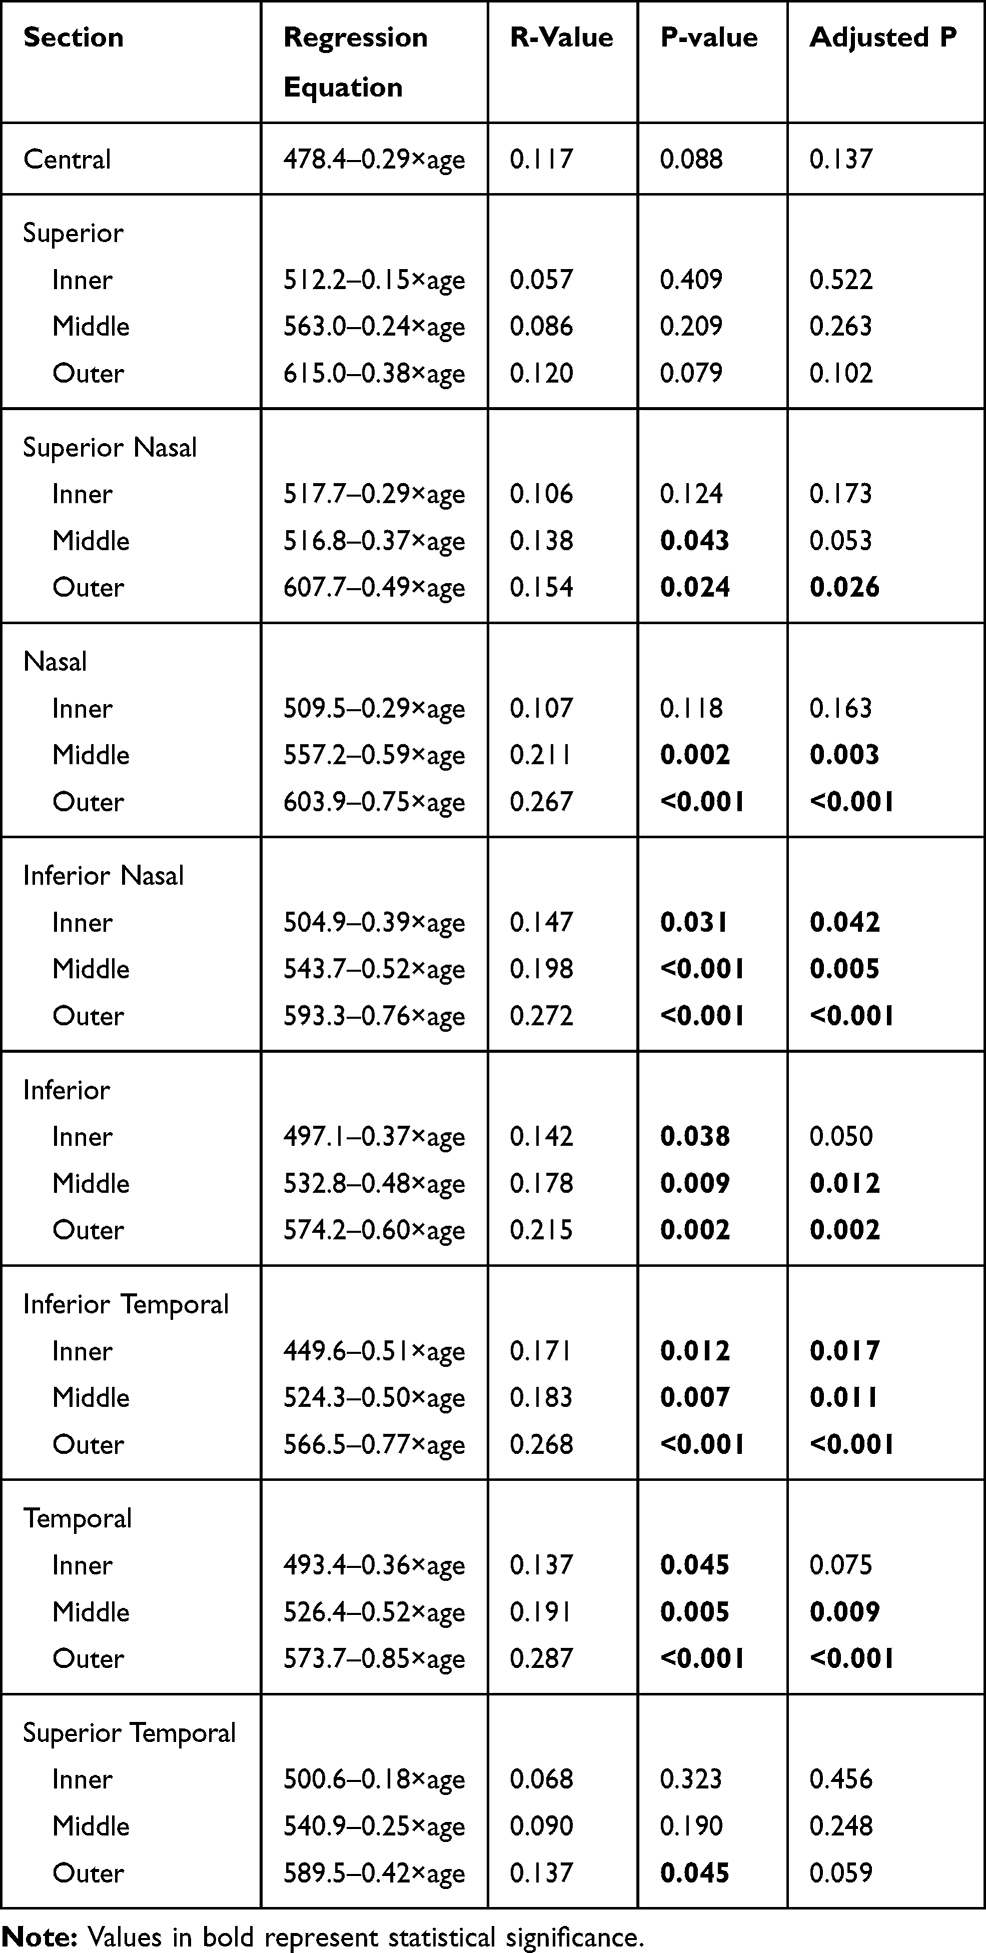 |
Table 4 Age Correlations |
Axial Length
Statistical significance was found in the following sectors: central (r=0.160, p=0.019), outer inferior temporal (r=0.143, p<0.001), inner (r=0.166, p=0.015), middle (r=0.150, p=0.028) and outer temporal (r=0.141, p=0.039), and inner superior temporal (r=0.168, p=0.014). The following zones fell out of statistical significance when adjusting for age: outer inferior temporal (r=0.143, p<0.001) and middle (p=0.052) and outer temporal (p=0.090). This data is represented in Table 5.
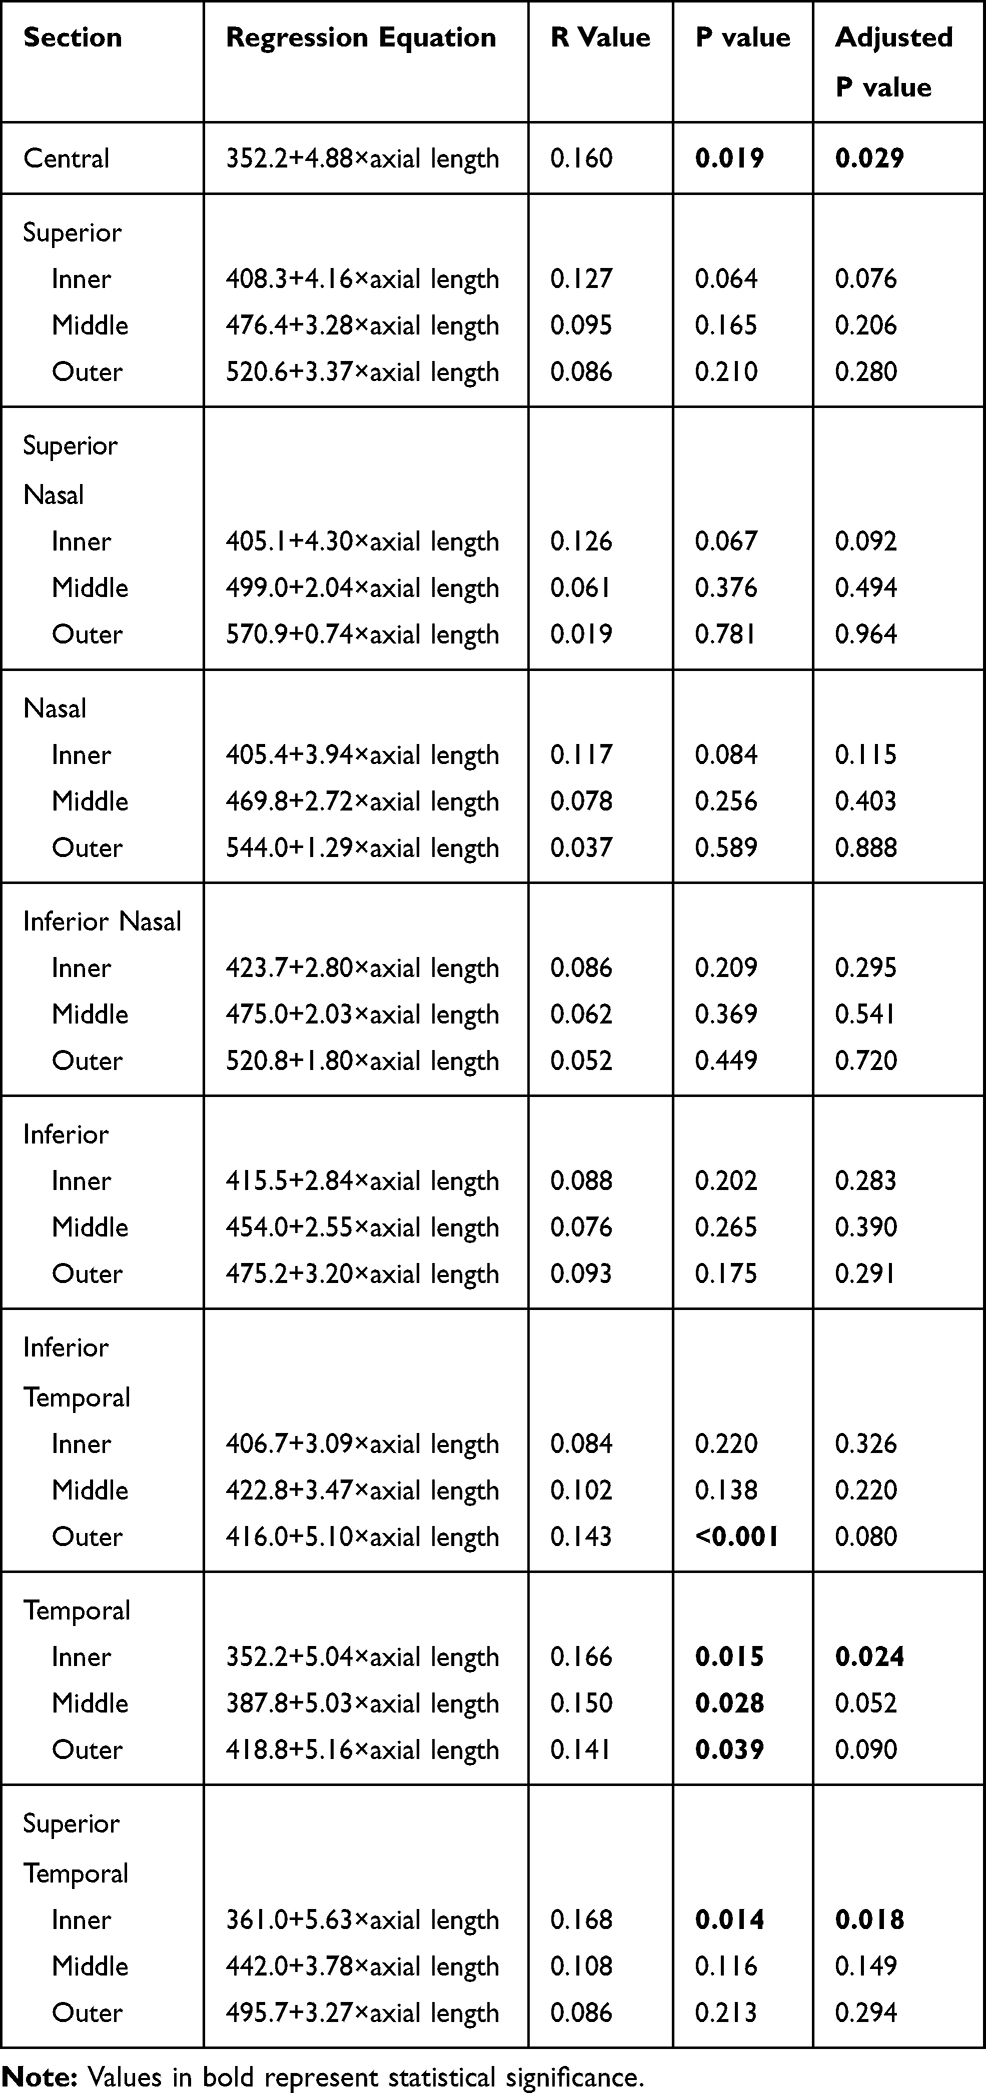 |
Table 5 Axial Length Correlations |
Reproducibility
For the 50 patients included in this analysis (25 males and 25 females), the mean age was 39.0 ± 15.0 years. Excellent results were found throughout with a minimum CV of 0.002 and a maximum of 0.019. Similarly, there was a minimum ICC of 0.868 and maximum of 0.999. This is presented in Table 6.
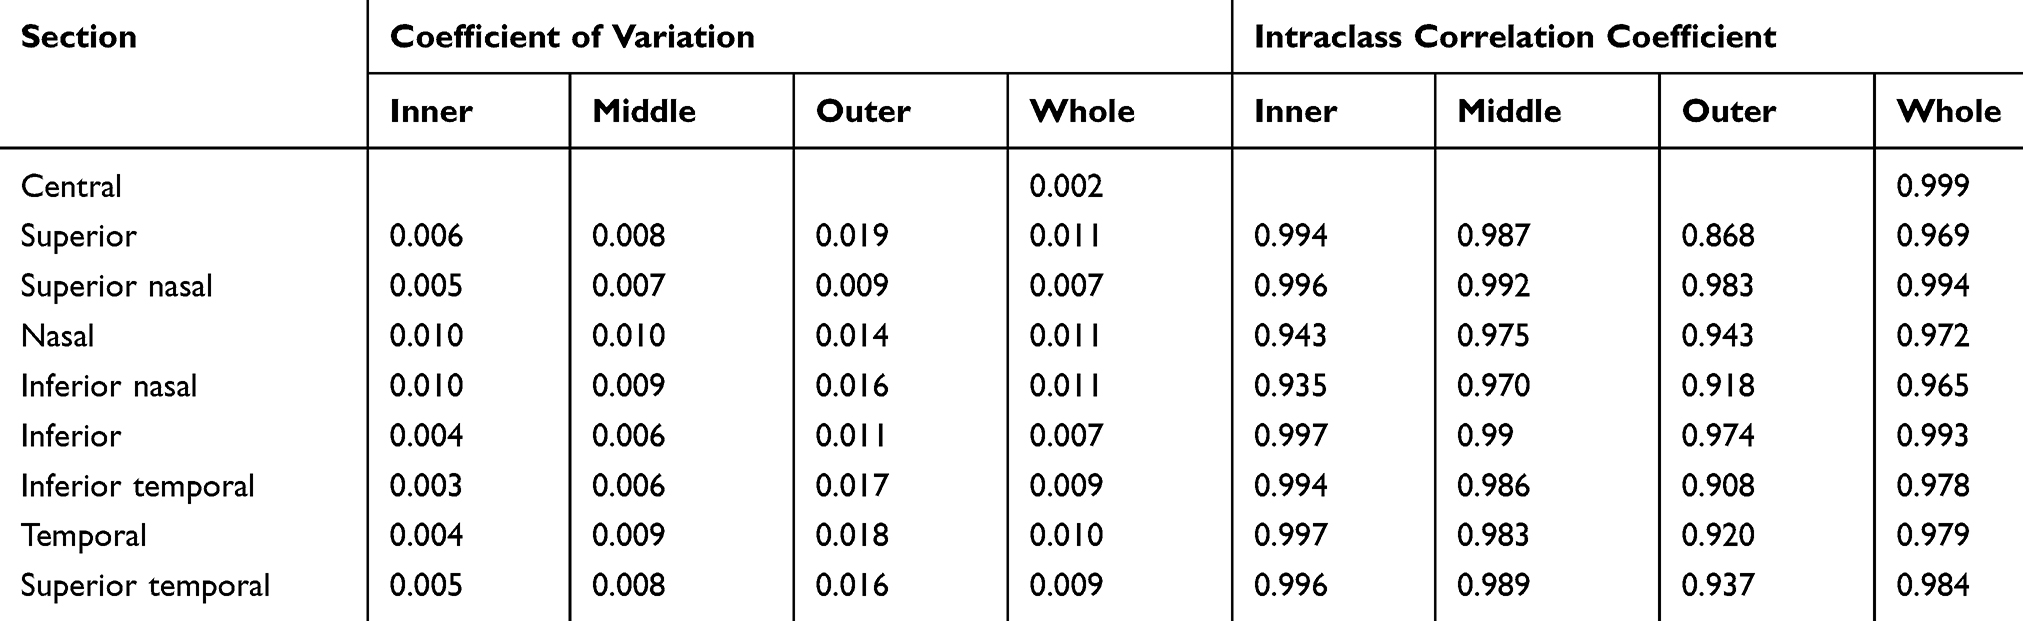 |
Table 6 Reproducibility |
Discussion
Corneal thickness as a unified measurement has been analyzed extensively in the literature for the purpose of delineating ocular pathologies; however, the individual layers have been explored less thoroughly. The clinical significance of stromal thickness has been recognized in its correlation with disease processes such as keratoconus5 and myopia,6 as well as its variation with surgical interventions.7 The present study aimed to independently evaluate stromal thickness in different meridians of the eye in normal individuals.
The literature includes a range of values for central stromal thickness, obtained through various techniques. Similar values were obtained through the VHF digital ultrasound3 and confocal microscopy.8–10 Another SD-OCT study reported a slightly higher central value of 482 μm.7 It may be safe to assume, therefore, that inter-study variations are likely not attributable to differences in measurement techniques. Therefore, geographical, genetic or simply patient variation may account for these differences.
With respect to the pattern of peripheral stromal thickening, previous studies with whole-corneal stromal mapping concur with our findings.3 Multiple mapping studies have attributed this to the structural layout of collagen fibrils in the stroma, highlighting a pattern of increasing collagen lamellae towards the periphery.11–13 It may also be interesting to note the study using the VHF digital ultrasound has reported maximum stromal thickness in the superior quadrant but with a considerably higher value (640 μm).3
Interestingly, we found the thinnest zone in our epithelial thickness profiles to be the superior zone; these were thicker as they approached the center.4 This is the reversal of what we find in the stroma. All previous theories trying to explain the regional differences in epithelial thickness profiles focused on the outside environment or the measurement method.4 Perhaps the epithelium is simply reacting to the stromal profiles even in the normal cornea in an attempt to smoothen out the surface of the cornea. This may be one of the reasons as evidenced by the change in epithelial thickness profiles post refractive surgery, as well.8
Our analysis noted no significant difference in stromal thickness between male and female participants, which is in agreement with other past studies.6,14 In another study, we found males to have thicker epithelial thickness profiles.4 Interestingly, we found a thicker central cornea in females using the Oculus Pentacam in a large cohort of patients.15 Baghdasaryan et al, on the other hand, found the corneal thickness to be significantly increased in male patients while epithelial thickness showed no difference.16 The dynamic nature of the cornea makes these measurements difficult as a large array of factors can affect the corneal thickness. This can account for the large discrepancy in not only the literature but our own datasets.
In addition, older age was found to be correlated with a significant decrease in stromal thickness in select peripheral sectors of the cornea. In part, this may be explained by a decline in stromal keratocyte density with age.9,14 Conversely, collagen deposition and collagen fibril diameter have been shown to increase with age, suggesting that age-related biomechanical adaptations are likely to be complex and multilayered. In terms of corneal thickness (epithelium plus stroma), available literature has described a negative17,18 as well as positive19 correlation between central corneal thickness and age. Nonetheless, it is difficult to ascertain whether these changes are due to the epithelium, stroma, or a combination of both.
Studies reporting isolated impact on stromal thickness are scarce, although Kim et al have denied any significant association between age and stromal thickness in any region of the cornea.14 As opposed to this, our findings not only show a significant negative correlation in the nasal, temporal and inferior quadrants, but also an increase in the strength of this correlation from inner to outer (peripheral) segments. This further cements the idea that epidemiological or age-related changes affect the cornea heterogeneously and may preferentially act on the periphery as compared to the center.
In conclusion, while epithelial thickness has been mapped extensively, stromal thickness represents an understudied domain with respect to our understanding of corneal mechanisms of adaptation. In view of how the stroma appears to respond independently to patient-related characteristics, these results encourage wide stromal mapping in larger patient populations in order to evaluate its clinical significance in the diagnosis and prognostication of ocular disease.
Limitations
There are several limitations to this study. Firstly, this study was conducted at a single center in Karachi, Pakistan and therefore only a specific subset of patients was seen. Secondly, the Optovue OCT cannot exclude the Descemet’s and the endothelium from the analysis; the stromal thicknesses, therefore, were likely overestimated due to the inclusion of these 2 layers.
Funding
The research was funded by the Hashmanis Foundation.
Disclosure
Dr Sharif Hashmani reports grants from Hashmanis Foundation, during the conduct of the study. There are no other conflicts of interest to note.
References
1. Izatt JA, Hee MR, Swanson EA, et al. Micrometer-scale resolution imaging of the anterior eye in vivo with optical coherence tomography. Arch Ophthalmol. 1994;112(12):1584–1589.
2. Wojtkowski M, Leitgeb R, Kowalczyk A, Bajraszewski T, Fercher AF. In vivo human retinal imaging by fourier domain optical coherence tomography. J Biomed Opt. 2002;7(3):457. doi:10.1117/1.1482379
3. Reinstein DZ, Archer TJ, Gobbe M, Silverman RH, Coleman DJ. Stromal thickness in the normal cornea: three-dimensional display with artemis very high-frequency digital ultrasound. J Refract Surg. 2009;25(9):776–786. doi:10.3928/1081597X-20090813-04
4. Hashmani N, Hashmani S, Saad CM. Wide corneal epithelial mapping using an optical coherence tomography. Invest Ophthalmol Vis Sci. 2018;59(3):1652–1658. doi:10.1167/iovs.17-23717
5. Zhou W, Stojanovic A. Comparison of corneal epithelial and stromal thickness distributions between eyes with keratoconus and healthy eyes with corneal astigmatism ≥2.0 D. PLoS One. 2014;9(1).
6. Kim BJ, Ryu IH, Lee JH, Kim SW. Correlation of sex and myopia with corneal epithelial and stromal thicknesses. Cornea. 2016;35(8):1078–1083. doi:10.1097/ICO.0000000000000850
7. Luft N, Ring MH, Dirisamer M, et al. Semiautomated SD-OCT measurements of corneal sublayer thickness in normal and post-SMILE eyes. Cornea. 2016;35(7):972–979. doi:10.1097/ICO.0000000000000799
8. Erie JC, Patel SV, McLaren JW, et al. Effect of myopic laser in situ keratomileusis on epithelial and stromal thickness: a confocal microscopy study. Ophthalmology. 2002;109(8):1447–1452. doi:10.1016/S0161-6420(02)01106-5
9. Patel SV, McLaren JW, Hodge DO, Bourne WM. Normal human keratocyte density and corneal thickness measurement by using confocal microscopy in vivo. Invest Ophthalmol Vis Sci. 2001;42(2):333–339.
10. Patel SV, McLaren JW, Hodge DO, Bourne WM. Confocal microscopy in vivo in corneas of long-term contact lens wearers. Invest Ophthalmol Vis Sci. 2002;43(4):995–1003.
11. Aghamohammadzadeh H, Newton RH, Meek KM. X-ray scattering used to map the preferred collagen orientation in the human cornea and limbus. Structure. 2004;12(2):249–256. doi:10.1016/j.str.2004.01.002
12. Henriksson JT, Bron AJ, Bergmanson JPG. An explanation for the central to peripheral thickness variation in the mouse cornea. Clin Exp Ophthalmol. 2012;40(2):174–181. doi:10.1111/ceo.2012.40.issue-2
13. Meek KM, Tuft SJ, Huang Y, et al. Changes in collagen orientation and distribution in keratoconus corneas. Invest Ophthalmol Vis Sci. 2005;46(6):1948–1956. doi:10.1167/iovs.04-1253
14. Kim BJ, Ryu IH, Kim SW. Age-related differences in corneal epithelial thickness measurements with anterior segment optical coherence tomography. Jpn J Ophthalmol. 2016;60(5):357–364. doi:10.1007/s10384-016-0457-x
15. Hashmani N, Hashmani S, Hanfi AN, et al. Effect of age, sex, and refractive errors on central corneal thickness measured by oculus pentacaml®. Clin Ophthalmol. 2017;11:1233–1238. doi:10.2147/OPTH.S141313
16. Baghdasaryan E, Tepelus TC, Marion KM, Bagherinia H, Sadda SR, Hsu HY. Evaluation of corneal epithelial thickness imaged by high definition optical coherence tomography in healthy eyes. Cornea. 2019;38(1):62–66. doi:10.1097/ICO.0000000000001745
17. Galgauskas S, Norvydaite D, Krasauskaite D, Stech S, Ašoklis RS. Age-related changes in corneal thickness and endothelial characteristics. Clin Interv Aging. 2013;8:1445–1450. doi:10.2147/CIA
18. Islam QU, Saeed MK, Mehboob MA. Age related changes in corneal morphological characteristics of healthy Pakistani eyes. Saudi J Ophthalmol. 2017;31(2):86–90. doi:10.1016/j.sjopt.2017.02.009
19. Rüfer F, Schröder A, Bader C, Erb C. Age-related changes in central and peripheral corneal thickness: determination of normal values with the Orbscan II topography system1. Cornea. 2007;26(1):1–5. doi:10.1097/01.ico.0000240095.95067.3f
 © 2020 The Author(s). This work is published and licensed by Dove Medical Press Limited. The
full terms of this license are available at https://www.dovepress.com/terms
and incorporate the Creative Commons Attribution
- Non Commercial (unported, 3.0) License.
By accessing the work you hereby accept the Terms. Non-commercial uses of the work are permitted
without any further permission from Dove Medical Press Limited, provided the work is properly
attributed. For permission for commercial use of this work, please see paragraphs 4.2 and 5 of our Terms.
© 2020 The Author(s). This work is published and licensed by Dove Medical Press Limited. The
full terms of this license are available at https://www.dovepress.com/terms
and incorporate the Creative Commons Attribution
- Non Commercial (unported, 3.0) License.
By accessing the work you hereby accept the Terms. Non-commercial uses of the work are permitted
without any further permission from Dove Medical Press Limited, provided the work is properly
attributed. For permission for commercial use of this work, please see paragraphs 4.2 and 5 of our Terms.