Back to Journals » International Journal of Nanomedicine » Volume 11
Voltammetric determination of melatonin using a graphene-based sensor in pharmaceutical products
Authors Apetrei IM, Apetrei C ![]()
Received 24 January 2016
Accepted for publication 24 February 2016
Published 2 May 2016 Volume 2016:11 Pages 1859—1866
DOI https://doi.org/10.2147/IJN.S104941
Checked for plagiarism Yes
Review by Single anonymous peer review
Peer reviewer comments 3
Editor who approved publication: Dr Thomas Webster
Irina Mirela Apetrei,1 Constantin Apetrei2
1Department of Pharmaceutical Sciences, Faculty of Medicine and Pharmacy, 2Department of Chemistry, Physics and Environment, Faculty of Sciences and Environment, “Dunarea de Jos” University of Galati, Galati, Romania
Abstract: Melatonin can be sensitively detected in pharmaceuticals by cyclic voltammetry and fixed-potential amperometry using a graphene-based sensor. The sensor characterization of cyclic voltammetry constantly provides high values of electrode active area and heterogeneous rate constant. In optimal conditions, the sensor was applied for the determination of melatonin in different pharmaceutical samples. The sensitivity to melatonin was 0.0371 A M-1, and the limit of detection was 0.87×10⁻⁶ M. The data obtained by using the graphene-based sensor for the detection of melatonin in pharmaceutical products were in good agreement with the data provided by the producer. Since no interferences from the excipients were found, using a separation technique was not necessary. Additionally, the low price, ease of handling, small amount of sample, short time per analysis, and possibility of automation are the important advantages that recommend this methodology for quality control of pharmaceuticals.
Keywords: electroanalysis, kinetics, chitosan, limit of detection, recovery
Introduction
Melatonin or N-acetyl-5-methoxytriptamine is the pineal hormone. It is of considerable interest due to its modulating role of a series of physiologic processes. The regulation of biological rhythms controlling the phase and amplitude of circadian rhythm and neuroendocrine processes is among the most important aspects that need to be highlighted.1 Moreover, melatonin is an antioxidant and free radical scavenger.2
Melatonin is usually used in therapy for sleep disorders and jetlag. Other experimental studies have shown the effectiveness of melatonin in epilepsy, Parkinsonism, Alzheimer’s disease, movement disorders, etc.3,4 Numerous analytical methods were reported for detection and quantification of melatonin, such as ultraviolet–visible (UV–vis) spectrophotometry, chemilumenescence, fluorometry, thin-layer chromatography, gas chromatography-mass spectrometry, and high-performance liquid chromatography.5–9 Furthermore, melatonin is an antioxidant compound that can be analyzed with electrochemical methods.10 Voltammetric and amperometric methods were applied for the determination of melatonin using carbon paste electrodes, carbon disk electrode, carbon fiber microdisk electrode, etc.11–13
However, the electrochemical performance of carbon electrodes can be enhanced and/or extended by modifying their surfaces with various materials. One class of these materials are nanostructured carbonaceous materials, such as mesoporous carbon, carbon nanofibers, carbon nanotubes, and graphene.14 Graphene is a material used in various fields due to its unique structural, mechanical, and electronic properties.15 One important application of graphene is biosensing and electrochemistry.16
The aims of this study are to develop a novel sensor based on graphene-coated carbon screen-printed electrode and to pursue an analytical procedure for determination of melatonin in pharmaceutical formulations. Commercial screen-printed carbon electrode was modified with graphene, chitosan solution being chosen for graphene dispersion in order to obtain an adhesive thin film.
Materials and methods
Chemicals and solutions
Stock solution (5×10⁻⁴ M) of melatonin (≥98% [thin-layer chromatography]; Sigma-Aldrich Co., St Louis, MO, USA) in absolute ethanol was freshly prepared and diluted as required. Graphene was purchased from Graphene Supermarket, Calverton, NY, USA (flakes of 8 nm height). K4[Fe(CN)6]·3H2O, KCl, Na2HPO4, NaH2PO4, CH3COOH, phosphoric acid, NaOH, and chitosan from shrimp shells were obtained from Sigma-Aldrich Co.
Supporting electrolytes used for electrochemical experiments were sodium phosphate buffer, 0.1 mol×L−1 Na2HPO4/NaH2PO4 (phosphate-buffered saline [PBS]), pH 7.0, and 0.2 mol×L−1 KCl.
All reagents used were of analytical grade. Aqueous solutions were prepared with ultrapure MilliQ water (resistivity of 18.2 MΩ cm) directly taken from a Simplicity® ultrapurificator water system equipped with a UV lamp (EMD Millipore, Billerica, MA, USA).
Modification of commercial screen-printed electrode
Screen-printed carbon electrodes (4 mm in diameter) were purchased from Dropsens Ltd, Llanera, Asturias, Spain model 110, and further modified with graphene. Chitosan was dissolved in aqueous 1% CH3COOH solution, and then the pH was adjusted to 5.0 with 20% NaOH solution. Subsequently, graphene was added to the solution and sonicated for 1 hour to reach a homogeneous dispersion. In order to prepare the graphene-carbon screen-printed electrode (GPH-CSPE), 3 μL of aqueous graphene suspension was drop-coated uniformly onto the CSPE surface and left to dry in air. For the study of the influence of chitosan in sensor response, the CSPE was drop-coated with 3 μL of chitosan aqueous solution and left to dry in air.
Schematic design and components of sensitive layer are shown in Figure 1.
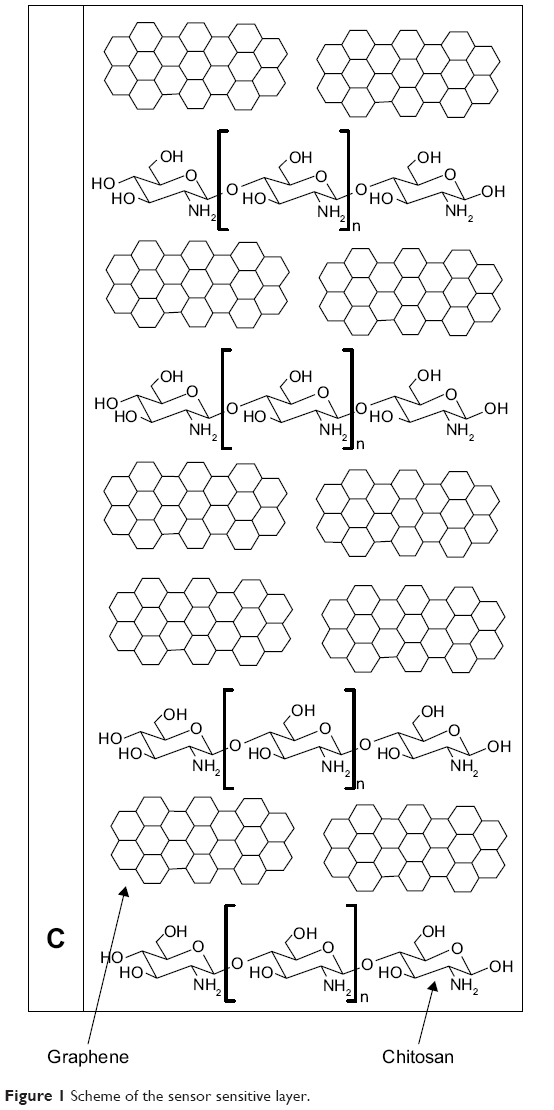 | Figure 1 Scheme of the sensor sensitive layer. |
Graphene is suitable for sensing applications because it is nanostructured and it can improve the sensitivity of the sensor by increasing the number of electroactive centers on the surface and enhancing the rate of electron transfer. Chitosan has a good mechanical strength and adsorption properties. Therefore, the composite film of graphene and chitosan is expected to be highly efficient when used as sensitive material for detection of melatonin.
Electrochemical measurements
Voltammetric measurements (cyclic voltammetry and fixed-potential amperometry [FPA]) were carried out using a Biologic SP 150 (Bio-Logic Science Instruments SAS, Claix, France) potentiostat/galvanostat and controlled by EC-Lab Express software for Windows 7. All measurements were carried out using a three-electrode configuration. The working electrode consisted of carbon-graphene, and the counter electrode consisted of carbon with a pseudosilver/silver chloride reference electrode. All experiments were carried out under aerobic conditions at room temperature. The experimental setup is shown in Figure 2.
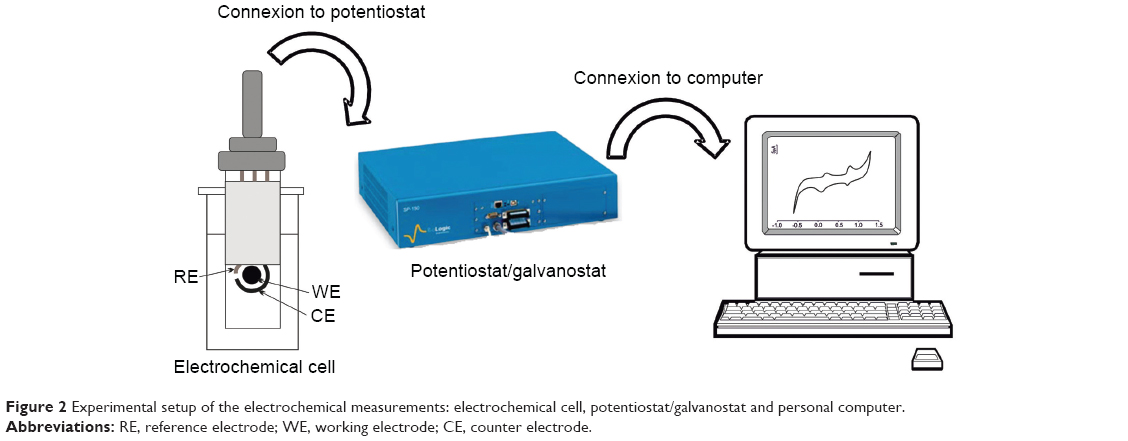 | Figure 2 Experimental setup of the electrochemical measurements: electrochemical cell, potentiostat/galvanostat and personal computer. |
Pharmaceutical analysis
Applicability of the sensor was studied by analyzing commercial melatonin formulations. Three pharmaceutical samples Bio-Melatonina (Pharma Nord), Bien Dormir® (SC Fiterman Pharma SA), and Melatonina (Cosmopharm) were purchased from local pharmacies.
The samples were dissolved in ethanol, and then the corresponding aliquot was mixed with 0.2 M phosphate-buffered solution. The final concentration of PBS was 0.1 mol×L−1. All pharmaceutical samples were analyzed in triplicate. All procedures and experimental protocols are in compliance with the European Communities Council Directive of 24 November 1986 (86/609/EEC).
Results and discussion
Voltammetric characterization of graphene-based sensor
The voltammetric behavior of the screen-printed electrodes (SPEs) (unmodified and modified with GPH) was first studied in order to evaluate the electroactive surface area of the working electrode and to quantify the heterogeneous rate constant (k0) obtained from cyclic voltammetric curves.
The cyclic voltammograms of the SPEs in 0.1 mol×L−1 KCl aqueous solution and in 0.1 mol×L−1 PBS (pH =7.0) were recorded. None of the cyclic voltammograms presented peaks in the potential range considered (from −0.4 V to +0.7 V). The voltammetric curves showed low background currents related to capacitive effects appearing when SPEs were immersed in electrolyte solution.17 The background currents were similar for both C-SPE and GPH-SPE. No influence of the chitosan in the CSPE response was observed. Therefore, SPEs could be successfully used in the analysis of melatonin in different electrolytes and at different pHs.
For the evaluation of electroactive surface area of the working electrode among different common benchmark redox systems, K4[Fe(CN)6] was selected for its surface sensitive electrochemical response, especially for carbonaceous materials.18
Figure 3 depicts the voltammetric curves of the unmodified and modified sensor devices, in which varying electron transfer reactivities were observed.
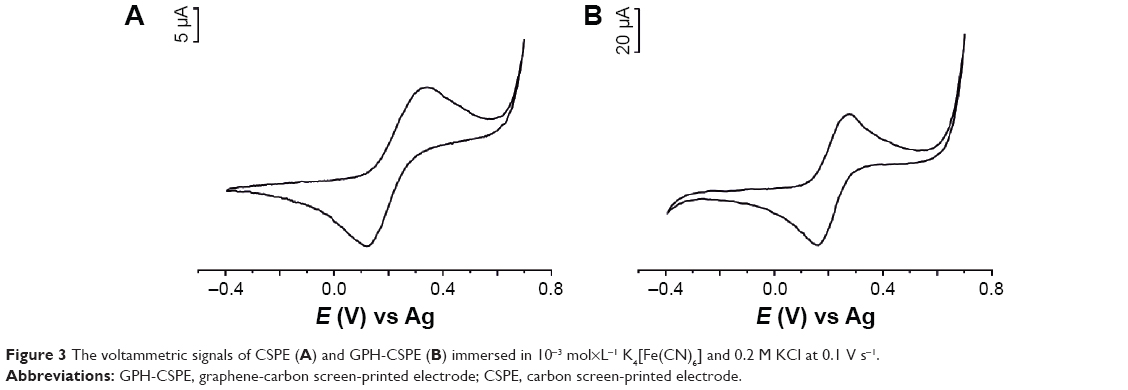 | Figure 3 The voltammetric signals of CSPE (A) and GPH-CSPE (B) immersed in 10−3 mol×L−1 K4[Fe(CN)6] and 0.2 M KCl at 0.1 V s−1. |
Sharp and well-defined redox peaks were observed related to the [Fe(CN)6]4−/[Fe(CN)6]3− redox pair present in solution in anodic and cathodic scans. The principal parameters obtained from cyclic voltammograms (CVs) and others calculated are summarized in Table 1.
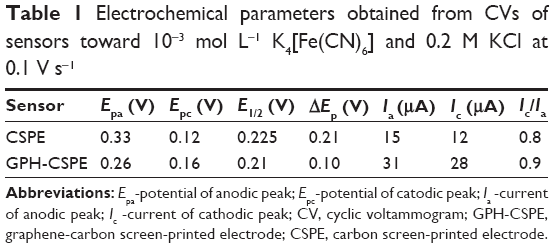 | Table 1 Electrochemical parameters obtained from CVs of sensors toward 10−3 mol L−1 K4[Fe(CN)6] and 0.2 M KCl at 0.1 V s−1 |
Half-wave potential (E1/2) is close to 0.2 V for both sensors. ΔEp (peak-to-peak separation) values are much larger than expected for a one-electron transfer reversible reaction. Ic/Ia ratio is close to 1.
The GPH-modified screen-printed electrode showed the highest degree of reversibility, the separation between the anodic and cathodic peaks being lower than that in the case of unmodified electrode, and the Ic/Ia ratio was closest to the ideal value. No differences were observed between CSPE and CSPE coated with chitosan.
In order to estimate the real surface area of SPEs, cyclic voltammograms of screen-printed-based sensor responses were registered at different scan rates. Figure 4 presents the CVs of GPH-SPE immersed in 10−3 mol×L−1 [Fe(CN)6]4− and 0.2 M KCl registered at different scan rates (0.05–1.0 V s−1) and the dependency between the anodic peak current and square root of the scan rate.
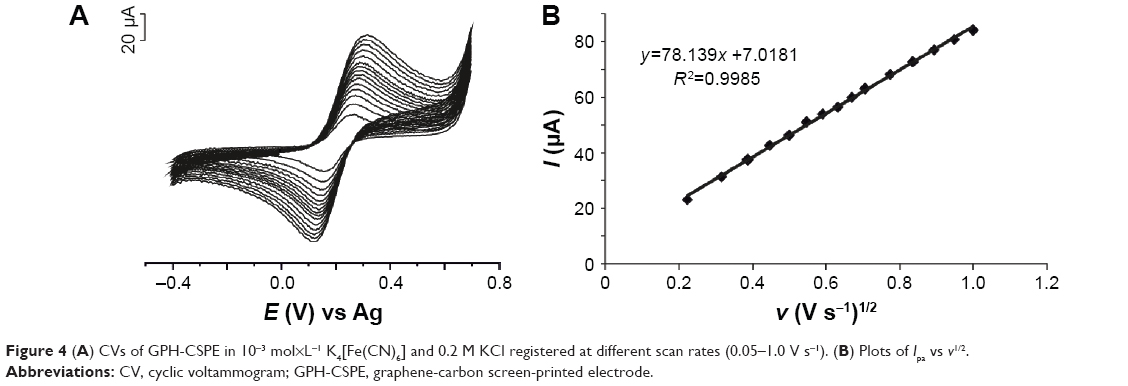 | Figure 4 (A) CVs of GPH-CSPE in 10−3 mol×L−1 K4[Fe(CN)6] and 0.2 M KCl registered at different scan rates (0.05–1.0 V s−1). (B) Plots of Ipa vs v1/2. |
A linear dependence was obtained between the anodic peak current and the square root of the scan rate, demonstrating that oxidation process of ferrocyanide at the sensor surface is diffusion controlled.
The voltammetric curves, as shown in Figure 4, were utilized for quantitative mathematical analysis to calculate several electrochemical parameters. The active electrode area of sensors was determined using the Randles–Sevcik equation for quasireversible electron transfer processes:19
Ip = (2.65 × 10⁵)n3/2 ACD1/2 v1/2 | (1) |
where n is the number of electrons exchanging in the redox process, A is the electrode area (cm2), C is the concentration of active molecule (mol cm−3), D is the diffusion coefficient (cm2 s−1), and v is the scan rate (V s−1).
The value of the real surface area of GPH-CSPE calculated was 0.8674 cm2. The electroactive surface area of the screen-printed electrodes was much larger than the geometrical electrode surface area (0.126 cm2). The roughness factor (electroactive surface area vs geometrical area ratio) was 6.88. This roughness factors could be related to the structure of graphene distributed on the surface of CSPE, which increased the large local rates of mass transport.20
The heterogeneous rate constant, k0, was determined using the Nicholson method, where the working curves relate ΔEp to a kinetic parameter (Ψ).19 The heterogeneous rate constant was calculated using the following equation:
|
|
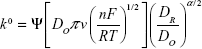
where Ψ refers to a kinetic parameter, DO is the diffusion coefficient for potassium ferricyanide (7.6×10⁻⁶ cm2 s−1), DR is the diffusion coefficient for potassium ferrocyanide (6.3×10⁻⁶ cm2 s−1), α is the transfer coefficient (0.5), R is the universal gas constant (V×C K−1 mol−1), T is the absolute temperature (K), n is the number of electrons transferred, and F is the Faraday constant (C mol−1).21
The heterogeneous rate constant, k0, calculated was 5.4×10⁻³ cm2 s−1, indicating a rapid reaction at electrode surface.
Electrochemical response of graphene-based sensor toward melatonin
The electrochemical response of melatonin was examined at GPH-CSPE. The cyclic voltammograms registered using the sensors for melatonin solution (10−4 M in 0.1 M phosphate buffer, pH 7.0) are presented in Figure 5.
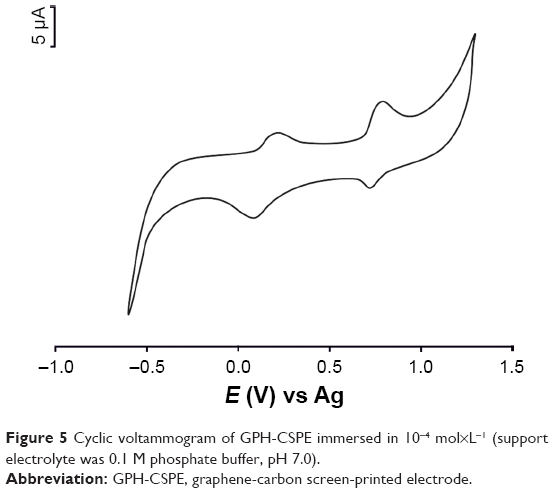 | Figure 5 Cyclic voltammogram of GPH-CSPE immersed in 10−4 mol×L−1 (support electrolyte was 0.1 M phosphate buffer, pH 7.0). |
Two anodic peaks were observed and two reduction peaks, less defined, appeared on the reverse direction. The oxidation peaks appeared at 0.22 V and 0.80 V, respectively. The reduction peaks appeared at 0.12 V and 0.75 V, respectively. The peak-to-peak separation difference (ΔE) was larger than the theoretical value calculated for a totally reversible redox system transferring one electron. The processes at the graphene-based sensor surface are shown in Figure 6. These processes are in agreement with those reported in the literature for melatonin.13
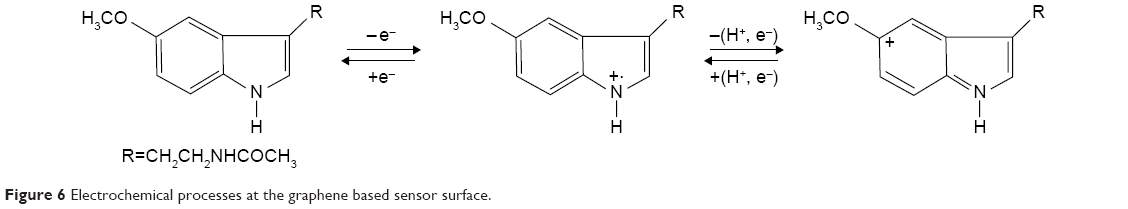 | Figure 6 Electrochemical processes at the graphene based sensor surface. |
The response of unmodified sensor was similar as the peak potentials, but the peak currents were 50% lower than those in the case of GPH-modified sensors. The presence of GPH at the sensor surface significantly improves the sensitivity of the sensor by increasing the rate of electron transfer.
The effect of potential scan rate, v, on the electrochemical behavior of GPH-CSPE was examined. The cyclic voltammograms of GPH-CSPE in 10−4 M melatonin and 0.1 M phosphate buffer (pH 7.0) at different scan rates (from 0.050 V s−1 to 1.000 V s−1) were recorded (not shown). Along the studied range of scan rate, the peak currents of oxidation peaks were proportional to the scan rate, indicating a surface-controlled process.
The value of α×n (product of transfer coefficient and number of electrons transferred in the rate determining step) was calculated according to the equation: 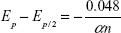 at 25°C, where Ep/2 is the half peak potential.19 Taking into account that α=0.5, the number of electrons exchanged in the rate determining step was equal to 1, highlighting the mechanism of oxidation process of melatonin.
Analytical procedure for quantitative determination of melatonin
The current of oxidation peak was found to increase when the concentration of melatonin was increased. The dependence between peak current and concentration of electroactive compound, melatonin, allows peak current measurements to be used for quantitative applications.
Besides CV, FPA was performed to study the GPH-based sensor response to melatonin since it is usually a more sensitive analytical method than CV and often more suitable for complex samples, such as pharmaceuticals.22
The working potential was determined by scanning potential in the range from 0.5 V to 1.0 V with a step of 50 mV in 0.1 mol×L−1 PBS in the presence of 10−4 mol×L−1 melatonin (Figure 7).
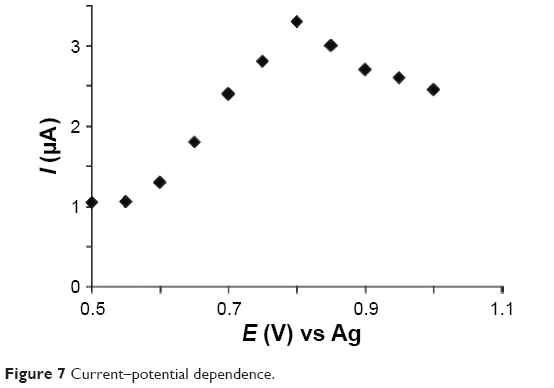 | Figure 7 Current–potential dependence. |
The dependence from the data obtained, current vs potential, revealed that the optimal working potential for oxidation of melatonin is 0.8 V.
FPA measurements were carried out by applying 0.8 V to the sensor and measuring the current when the aliquot of melatonin was added in the support electrolyte (0.1 mol×L−1 PBS, pH 7.0) under continuous stirring. A well-defined oxidation current proportional to the concentration of melatonin was observed (Figure 8).
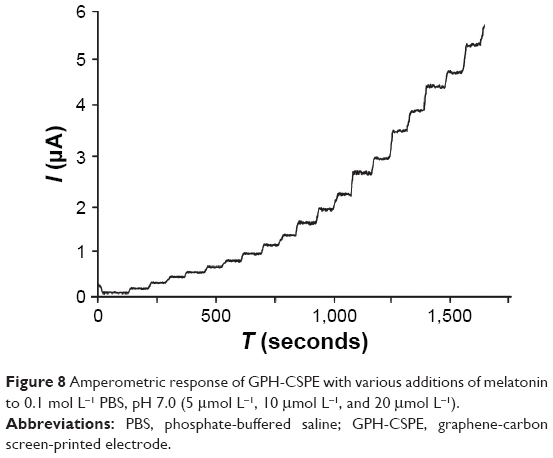 | Figure 8 Amperometric response of GPH-CSPE with various additions of melatonin to 0.1 mol L−1 PBS, pH 7.0 (5 μmol L−1, 10 μmol L−1, and 20 μmol L−1). |
The response time to melatonin at the GPH-CSPE sensor was ~4 seconds at different melatonin concentrations. From the amperometric measurements, the calibration curve of GPH-based sensor was constructed (Figure 9).
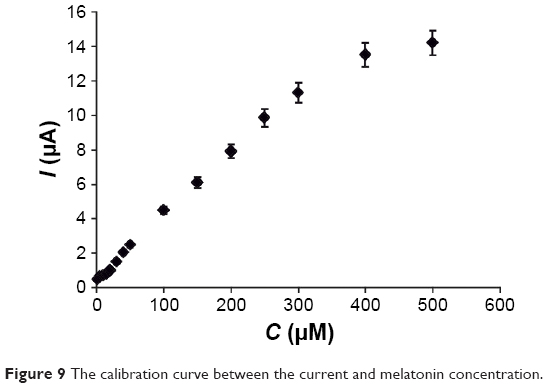 | Figure 9 The calibration curve between the current and melatonin concentration. |
As shown in the figure, a linear relationship between the peak currents and concentration of melatonin was obtained in the range of 1–300 μM. Above this concentration, loss of linearity was observed, and this was probably related to the adsorption of melatonin on the modified screen-printed electrode surface.
The limit of detection (LOD) and limit of quantification (LOQ) were calculated considering the linear range from the calibration curve using the following equations:
|
|

|
|

In these equations, σ is the standard deviation (SD) of the peak current (seven replicates) and m is the slope of the calibration curve (sensitivity). The sensitivity was 0.0371 A M−1. The LOD and LOQ values were calculated to be 0.87×10⁻⁶ M and 2.91×10⁻⁶ M, respectively. Low values of both LOD and LOQ confirmed the high sensitivity of the sensor developed.
Application of GPH-CSPE to detect melatonin in pharmaceutics
The GPH-CSPE sensor was applied for the determination of melatonin in pharmaceutical products. Significantly improved sensitivity can be achieved by applying FPA for the determination of melatonin. The optimized procedure was successfully applied for the determination of melatonin in pharmaceuticals (Bio-Melatonina from Pharma Nord, Bien Dormir® from SC Fiterman Pharma SA, and Melatonina from Cosmopharm). The FPA technique was applied to determine melatonin in commercial pharmaceutical products directly and using the standard addition method. The calculated values of melatonin in the samples determined from three measurements are summarized in Table 2.
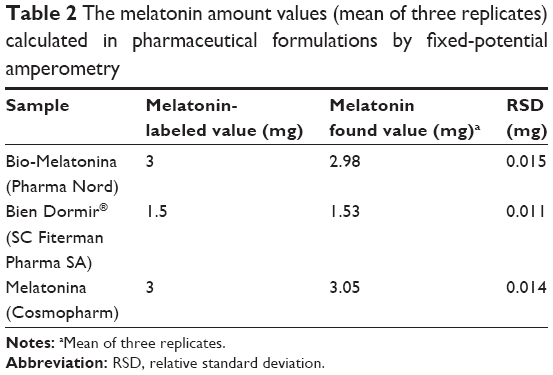 | Table 2 The melatonin amount values (mean of three replicates) calculated in pharmaceutical formulations by fixed-potential amperometry |
As shown in the table, the values obtained by using the sensor were very close to those indicated by the producer. Furthermore, low values of relative SD of the results were achieved.
Although the amount of melatonin in the pharmaceuticals was indicated by the producer, recovery studies were performed for Bien Dormir® (SC Fiterman Pharma) sample and an average recovery of 100.22% was obtained (Table 3).
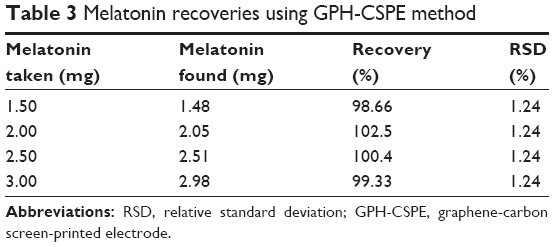 | Table 3 Melatonin recoveries using GPH-CSPE method |
The excellent percentage recovery and reduced values of relative SD of the results imply that the proposed method has a high sensitivity and could be applicable for the analysis of these pharmaceuticals and other similar formulation products containing melatonin.
Conclusion
A sensor based on graphene-coated screen-printed carbon electrodes has been developed and applied to the detection and quantification of melatonin. The developed sensor exhibited excellent sensitivity for voltammetric and amperometric detection of melatonin. The appropriateness of the FPA method for quantification of melatonin content in pharmaceutical products has been demonstrated. Excellent sensitivity, low LOD, no necessity of separation, small amount of sample, and possibilities for analyzing melatonin in complex samples are important characteristics of the method based on graphene sensor.
Acknowledgments
This work was supported by a grant of the Romanian National Authority for Scientific Research and Innovation, CNCS – UEFISCDI, project number PN-II-RU-TE-2014-4-1093.
Disclosure
The authors report no conflicts of interest in this work.
References
Cajochen C, Kraüchi K, Wirz-Justice A. Role of melatonin in the regulation of human circadian rhythms and sleep. J Neuroendocrinol. 2003;15:432–437. | ||
Charão MF, Souto C, Brucker N, et al. Caenorhabditis elegans as an alternative in vivo model to determine oral uptake, nanotoxicity, and efficacy of melatonin-loaded lipid-core nanocapsules on paraquat damage. Int J Nanomed. 2015;10:5093–5106. | ||
Srinivasan V, Cardinali DP, Srinivasan US, et al. Therapeutic potential of melatonin and its analogs in Parkinson’s disease: focus on sleep and neuroprotection. Ther Adv Neurol Disord. 2011;4:297–317. | ||
Pandi-Perumal SR, Srinivasan V, Warren Spence D, Cardinali DP. Role of the melatonin system in the control of sleep: therapeutic implications. CNS Drugs. 2007;21:995–1018. | ||
Ansari M, Rafiee K, Yasa N, Vardasbi S, Naimi SM, Nowrouzi A. Measurement of melatonin in alcoholic and hot water extracts of Tanacetum parthenium, Tripleurospermum disciforme and Viola odorata. Daru. 2010;18:173–178. | ||
Chau RM, Patel BA. Determination of serotonin, melatonin and metabolites in gastrointestinal tissue using high-performance liquid chromatography with electrochemical detection. Biomed Chromatogr. 2009;23:175–181. | ||
Mercolini L, Saracino MA, Bugamelli F, et al. HPLC-F analysis of melatonin and resveratrol isomers in wine using an SPE procedure. J Sep Sci. 2008;31:1007–1014. | ||
Lunn G. HPLC Methods for Recently Approved Pharmaceuticals. Hoboken, NJ: John Wiley & Sons; 2005:389. | ||
Paik MJ, Nguyen DT, Kim YJ, et al. Simultaneous GC-MS analysis of melatonin and its precursors as ethoxycarbonyl/pentafluoropropionyl derivatives in rat urine. Chromatographia. 2010;72:1213–1217. | ||
Bertrand PP, Polglaze KE, Bertrand RL, Sandow SL, Pozo MJ. Detection of melatonin production from the intestinal epithelium using electrochemical methods. Curr Pharm Des. 2014;20:4802–4806. | ||
Corujo-Antuña JL, Martínez-Montequín S, Fernández-Abedul MT, Costa-García A. Sensitive adsorptive stripping voltammetric methodologies for the determination of melatonin in biological fluids. Electroanalysis. 2003;15:773–778. | ||
Levent A. Electrochemical determination of melatonin hormone using a boron-doped diamond electrode. Diam Relat Mater. 2012;21:114–119. | ||
Santander P, Nunez-Vergara LJ, Sturm JC, Squella JA. Voltammetric determination of melatonin and pyridoxine (vitamin B6) in tablets. Bol Soc Chil Quím. 2001;46:131–136. | ||
Apetrei C, Apetrei IM, de Saja JA, Rodriguez-Mendez ML. Carbon paste electrodes made from different carbonaceous materials: application in the study of antioxidants. Sensors (Basel). 2011;11:1328–1344. | ||
Novoselov KS, Fal′ko VI, Colombo L, Gellert PR, Schwab MG, Kim K. A roadmap for graphene. Nature. 2012;490:192–200. | ||
Choi W, Lahiri I, Seelaboyina R, Kang YS. Synthesis of graphene and its applications: a review. Crit Rev Solid State. 2010;35:52–71. | ||
Cristea C, Bodoki E, Sima V, Sandulescu R. Modified screen printed electrodes for the development of biosensors. International Conference on Advancements of Medicine and Health Care through Technology. Vol. 26. Cluj-Napoca, Romania: 2009:89–92. | ||
Taurino I, Carrara S, Giorcelli M, Tagliaferro A, De Micheli G. Comparison of two different carbon nanotube-based surfaces with respect to potassium ferricyanide electrochemistry. Surf Sci. 2012;606:156–160. | ||
Bard AJ, Faulkner LR. Electrochemical Methods: Fundamentals and Applications. 2nd ed. New York, NY: Wiley; 2001:226–260. | ||
Apetrei IM, Apetrei C. Biosensing application of hybrid thin-film layers-based biosensors. IEEE Sens J. 2015;15:6926–6932. | ||
Kadara RO, Jenkinson N, Banks CE. Characterisation of commercially available electrochemical sensing platforms. Sens Actuat B. 2009;138:556–562. | ||
Baciu A, Ardelean M, Pop A, Pode R, Manea F. Simultaneous voltammetric/amperometric determination of sulfide and nitrite in water at BDD electrode. Sensors (Basel). 2015;15:14526–14538. |
 © 2016 The Author(s). This work is published and licensed by Dove Medical Press Limited. The
full terms of this license are available at https://www.dovepress.com/terms
and incorporate the Creative Commons Attribution
- Non Commercial (unported, 3.0) License.
By accessing the work you hereby accept the Terms. Non-commercial uses of the work are permitted
without any further permission from Dove Medical Press Limited, provided the work is properly
attributed. For permission for commercial use of this work, please see paragraphs 4.2 and 5 of our Terms.
© 2016 The Author(s). This work is published and licensed by Dove Medical Press Limited. The
full terms of this license are available at https://www.dovepress.com/terms
and incorporate the Creative Commons Attribution
- Non Commercial (unported, 3.0) License.
By accessing the work you hereby accept the Terms. Non-commercial uses of the work are permitted
without any further permission from Dove Medical Press Limited, provided the work is properly
attributed. For permission for commercial use of this work, please see paragraphs 4.2 and 5 of our Terms.