Back to Journals » Clinical Ophthalmology » Volume 11
Visual processing in patients with age-related macular degeneration performing a face detection test
Authors Vottonen P, Kaarniranta K, Pääkkönen A, Tarkka IM
Received 17 January 2017
Accepted for publication 2 May 2017
Published 3 July 2017 Volume 2017:11 Pages 1245—1252
DOI https://doi.org/10.2147/OPTH.S132583
Checked for plagiarism Yes
Review by Single anonymous peer review
Peer reviewer comments 2
Editor who approved publication: Dr Scott Fraser
Pasi Vottonen,1 Kai Kaarniranta,1,2 Ari Pääkkönen,3 Ina M Tarkka4
1Department of Ophthalmology, Kuopio University Hospital, Kuopio, Finland; 2Department of Ophthalmology, Institute of Clinical Medicine, University of Eastern Finland, Kuopio, Finland; 3Department of Clinical Neurophysiology, Institute of Clinical Medicine, University of Eastern Finland, Kuopio, Finland; 4Department of Health Sciences, University of Jyväskylä, Jyväskylä, Finland
Purpose: People with age-related macular degeneration (AMD) have difficulties in familiar face recognition and facial expression discrimination. Our aim was to evaluate the visual processing of faces in AMD patients and whether this would be improved by anti-vascular endothelial growth factor therapy. This was a prospective interventional cohort study.
Patients: Twelve patients with monocular wet AMD and 6 control subjects were recruited. Face detection processes were studied using cortical event-related potentials (ERPs). Patients received 3 bevacizumab intravitreal injections to the single affected eye. At baseline and 4–6 weeks after the last injection, clinical presentation and ERPs of the face task were evaluated. Face pictures were shown as targets (16.7%) among standard pictures of pixelated faces in an oddball-type paradigm.
Results: Face pictures elicited well-defined electrical components in occipital and parieto-occipital cortical areas at baseline and after treatment. The face-specific N170 component was evident in all subjects with longer peak latency in patients than in controls (170±13 vs 155±14, P=0.032). Unexpectedly, an early component reflecting unintentional prediction of perceiving a face, that is, deviance-related negativity, was present in patients and controls. Visual acuity of the affected eye seemed improved in patients from logarithm of the minimum angle of resolution 0.71 (±0.33) to 0.52 (±0.39) by 119 (±23) days without accompanying significant change in face-specific ERPs.
Conclusions: Monocular wet AMD distinctly influenced face-specific brain electrophysiological components. However, the anti-vascular endothelial growth factor treatment did not improve the binocular face detection ability. The EudraCT number of this study is 2012-000765-20.
Keywords: age-related eye diseases, bevacizumab, face recognition, EEG, N170
Introduction
Wet age-related macular degeneration (AMD) is a well-known risk factor for blindness in the elderly and an increasing burden in ophthalmology clinics.1,2 Long before the AMD patient reaches the stage of legal blindness, one of the first reported symptoms is difficulty in face recognition in daily life.3,4 Since face recognition and detection are such an important aspect of social interaction, it is evident that wet AMD may have a major social cost as well as exerting an economical impact on an individual’s life. Moreover, it is also a risk factor for hip fractures and depression as well as in reducing the quality of life.5–7 The recently developed anti-vascular endothelial growth factor (VEGF) drugs represent the first therapies that prevent moderate and severe vision loss in ~90% of the neovascular AMD patients and these agents are able to sustain or improve visual acuity (VA) during a 2 year follow-up period in ~80% of patients.8,9 Impaired VA or decreased contrast sensitivity may severely affect the face recognition ability in older adults.10,11 Face identification and performance in a behavioral face-matching task performance have been shown to be slower in patients with binocular AMD.10
Face recognition is a complex task involving mainly 3 regions of brain: inferior occipital gyrus, superior temporal sulcus and fusiform face area.12 It has been debated whether face is a specific stimulus to the brain, for example, neuropsychological case reports have revealed an inability to recognize facial identity and expression although other objects are still correctly identified.10,13–15 Brain imaging with electrophysiologic (electroencephalogram [EEG], event-related potential [ERP], magnetoencephalogram) and metabolic examinations (positron emission tomography, functional magnetic resonance imaging [MRI]) offer tools to investigate the mechanisms involved in face detection and recognition.15–17 VA, in general, seems to correlate with face recognition, but otherwise, very little is known about visual processing of faces in AMD patients.18
Usually, AMD does not affect both eyes evenly; thus, the 2 monocular VAs generally differ considerably.19 Patients with AMD have reduced binocular contrast summation and binocular inhibition, that is, binocular performance is worse than that of the better eye alone.20,21 AMD also impairs the fixation stability.22 After the treatment of wet AMD with ranibizumab injections, there appears to be an improvement in the fixation stability.23
Repeated intravitreal anti-VEGF injections are the current treatment for wet AMD and administration of these injections improve patient-reported vision-related function.24 Consequently, it is also important to understand the possible changes in complex visual processes such as face detection in AMD patients. Our patients were subjected to a face task with an oddball-type design in which their performance was evaluated by measuring ERPs. All our patients had 1 wet AMD eye. We followed them through the treatment with intravitreal anti-VEGF injections to investigate if the treatment changed the electrophysiological markers of face detection. Our control group also performed the same tasks at the same time intervals.
Material and methods
Study setting and population
This prospective nonrandomized interventional study was performed with AMD patients and healthy controls. The patients’ mean age was 80±7 years (range 66–89 years, median 79.5 years). The exclusion criteria were as follows: history of previous intravitreal treatment, diabetes, glaucoma, history of previous intraocular surgery (cataract surgery without complications was accepted) or laser treatment of the eyes. The duration of the active AMD disease was estimated according to the patient’s history from the beginning of visual symptoms, including decreased VA, blurring of vision or metamorphopsia. The patient must not have had those symptoms for more than 3 months, for inclusion in this study. The control group (mean age 72±6 years, range 65–81 years, median 72.5 years) had no history of eye or neurological diseases. The ethics committee of the Kuopio University Hospital approved the study and the tenets of the Declaration of Helsinki were followed. All participants signed an informed consent.
Clinical examination and treatment
The intervention group consisted of 12 patients with wet AMD and the control group consisted of 6 pseudophakic patients. Nine patients and all the subjects of the control group were pseudophakic. In the remaining 3 patients, only mild cataract was detected and no clinically significant progression of cataract was noted during the study period. Diagnosis was based on the best-corrected Snellen visual acuity (BCVA) testing (converted to logarithm of the minimum angle of resolution [logMAR] in the statistical analysis), full biomicroscopy examination and optical coherence tomography (OCT) (Spectral OCT/SLO; Ophthalmic Technologies Inc., Toronto, ON, Canada or Spectralis Heidelberg Engineering, Heidelberg, Germany) analysis in the Department of Ophthalmology, Kuopio University Hospital. The patient demographics and BCVA data are shown in Table 1. For patients on their first visit, when a diagnosis of exudative AMD was made, an anti-VEGF (bevacizumab) intravitreal injection was administered into the affected eye. Intravitreal injections were delivered 3 times separated by 4–6 weeks. ERPs with whole-head EEG, BCVA testing, full biomicroscopy examination and OCT analysis were performed at the first visit prior to the first anti-VEGF injection and 4 to 6 weeks after the last (ie, third) injection. There were 16–18 weeks between the baseline and follow-up measurements for patients and controls.
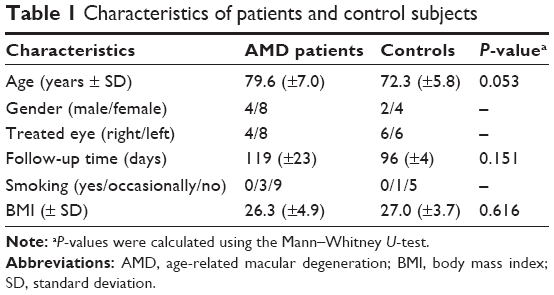 | Table 1 Characteristics of patients and control subjects |
Stimulation and recording
ERPs were recorded using a 64-channel electrode cap (Easycap; Falk-Minow Services, Herrsching, Germany). Data were collected with a SynAmps2 amplifier (Neuroscan, El Paso, TX, USA). The midline centrofrontal electrode (FCz) served as the reference for all scalp electrodes. Additional electrodes were placed on the skin above and below the right eye for a bipolar recording of vertical electro-oculogram activity. Contact impedance of all scalp electrodes was kept below 10 kΩ. The sampling rate was set at 500 Hz per channel with a recording band pass of 0.1–50 Hz.
Ten grayscale face images (5 male, 5 female) were selected from the Pictures of Facial Affect of Ekman and Friesen.25 The faces were all with a neutral expression and in a frontal view. For each image, a pixelated version was made with a horizontal resolution of about 8 pixels per face. The effect of pixelation was to set all original pixels in a square block of pixels to have the same grayscale value, that is, the average grayscale value of the block. Both the real face and pixelated images were cropped around the face with an elliptical mask. With the standardized images, the same mask could be used for all images. From a viewing distance of 100 cm, the major axis of the elliptical image was 10° and the minor axis 6.6° of visual angle.
The images were presented on a computer monitor using STIM2 software (Neuroscan). The pixelated images served as standard stimuli and the real face images as targets in an active oddball task. The subject had to press a button when seeing a real face image. Response accuracy and reaction times of the button presses were recorded with the EEG data.
The duration of each standard and target stimulus was 306.7 ms and the interstimulus interval was 1,506 ms. One recording session consisted of 2 blocks, each having 300 stimuli. There was a brief resting pause between the blocks. Each target image was presented 5 times and each pixelated image was shown 25 times in a block in a randomized order. Thus, the proportion of targets was 16.7%. Stimulation was binocular and full refractive correction was used.
Data analysis
The ERP data were analyzed offline with SCAN software (Neuroscan). The continuous data from 2 recording blocks were merged into a single file. Then the data were filtered digitally with a zero-phase shift band-pass filter to 1–30 Hz (3 dB points of 24 dB/octave roll-off). To avoid data loss by a blink artifact, the eye movement reduction technique described by Semlitsch et al26 was applied to the filtered data. The data were then transformed to epochs of 1,000 ms duration, including a 100 ms prestimulus baseline interval. For each channel and epoch, the mean amplitude of the baseline was subtracted from all time points. Epochs with artifacts exceeding ±30 μV at any of the frontal electrodes were automatically rejected. In addition, the data were checked visually and epochs containing suspected artifacts in any channel were rejected. The FCz-referenced epochs were then re-referenced to the common average and averaged separately for standard and target trials.
The latency and baseline-to-peak amplitude of the face-specific N170 component was measured from the target, that is, the real face-elicited response, at the Oz and PO8 electrodes. These electrodes were chosen as they represent the highest response amplitudes in the primary visual and temporo-occipital sites, respectively. The peak amplitude of the deviance-related negativity (DRN) was measured from the same electrodes as the mean amplitude of the target minus standard difference waveform in the time range of 220–280 ms.
In the behavioral data analysis, average reaction times to correct responses (real face pictures) were obtained. The number of errors was also analyzed. An error was counted if there was no response to the target, or the response occurred more than 1,000 ms after the target stimulus onset, or when a response was made to a standard stimulus.
Statistical analysis
Means and standard deviations of the amplitudes and latencies of major electrophysiological components, as well as behavioral data (reaction times, number of errors and misses) were calculated. The statistical analysis was done with SPSS® Statistics for Windows, Version 19.0 (SPSS Inc., Chicago, IL, USA). The level of statistical significance was set at P<0.05. Wilcoxon signed-rank test was used to determine if differences between the baseline and follow-up measurement values were statistically significant. Mann–Whitney U-test was used to compare the patients and the control subjects.
Results
Twelve patients were treated with 3 anti-VEGF injections and 6 control subjects were followed-up for a corresponding period (for subject characteristics, Table 1). A significant treatment effect was seen in the retinal thickness (P=0.004) and close to significant effect in the VA (P=0.091) was presented in the AMD patients. No significant changes in VA, OCT or electrophysiological markers of face recognition were observed in the control group during the follow-up (Table 2). During the study period, none of the subjects developed wet AMD in the fellow eye. There were no significant changes in the VA of the fellow eyes, nor was progression of dry AMD detected in the fundus examination or OCT.
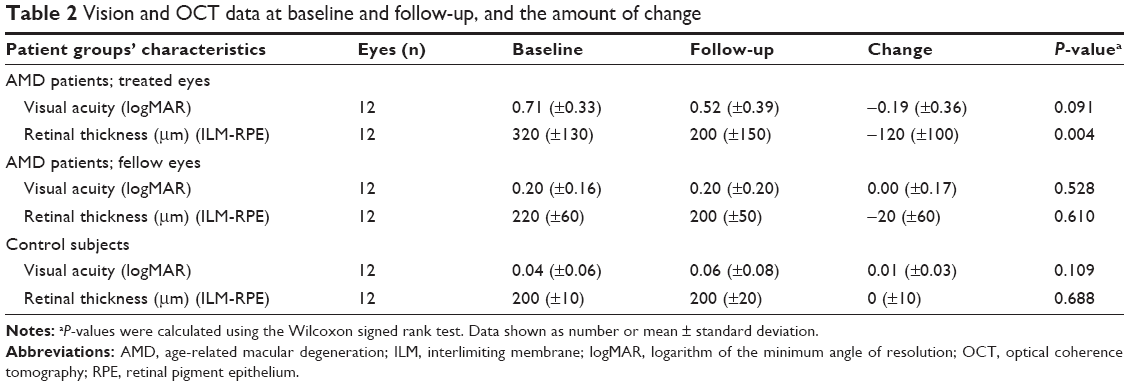 | Table 2 Vision and OCT data at baseline and follow-up, and the amount of change |
Electrophysiologic analysis of the face recognition task revealed high amplitude N170 components in both patients and controls. N170 occurred significantly earlier (P=0.032) in the control group than in patients before the treatment. This difference was not detected at follow-up (Table 3). Occipital and posterior temporal recordings of face (target) and pixelated face (standard) stimuli in patients are shown in Figure 1. Neither patients nor controls exhibited any significant differences in the ERP component characteristics (latencies, amplitudes) elicited by face stimulus between baseline and follow-up recordings. As our task design allowed for the formation of difference waveforms (target minus standard) to analyze specifically and exclusively face detection, the difference waveforms were calculated. The face-specific N170 was followed by DRN (see in Figure 1), which peaked around 250 ms. DRN is clearly seen in Figure 2, where the shaded area denotes the time window for the mean amplitude calculation for DRN. The mean amplitudes of DRN did not differ significantly between patients and controls, nor did DRN change between baseline and follow-up (Table 3). Nonetheless, a tendency toward higher amplitude is seen in patients, especially in the before-treatment recording (Figure 2, electrode PO8). These 2 components, N170 and DRN, elicited by the rarely presented face pictures most likely originate from different sources in the brain. As we recorded EEG with a high-density electrode cap, this allowed us to examine the scalp distributions of the waveforms. The differences between N170 and DRN are demonstrated by the topographic voltage maps revealing their scalp distributions (see Figure 3).
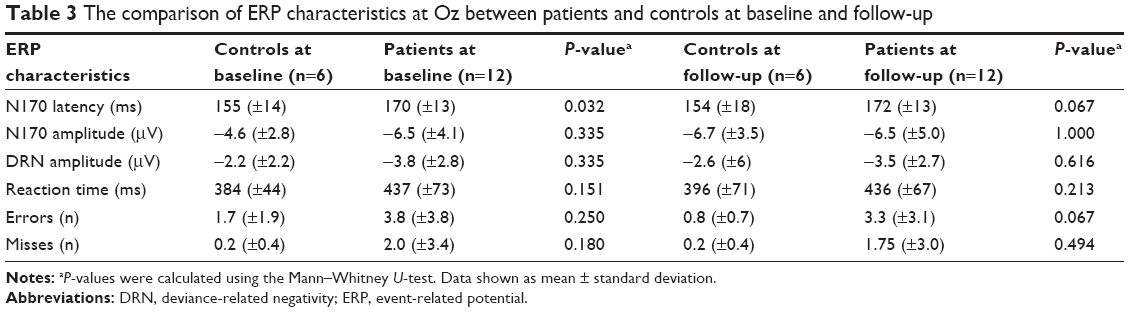 | Table 3 The comparison of ERP characteristics at Oz between patients and controls at baseline and follow-up |
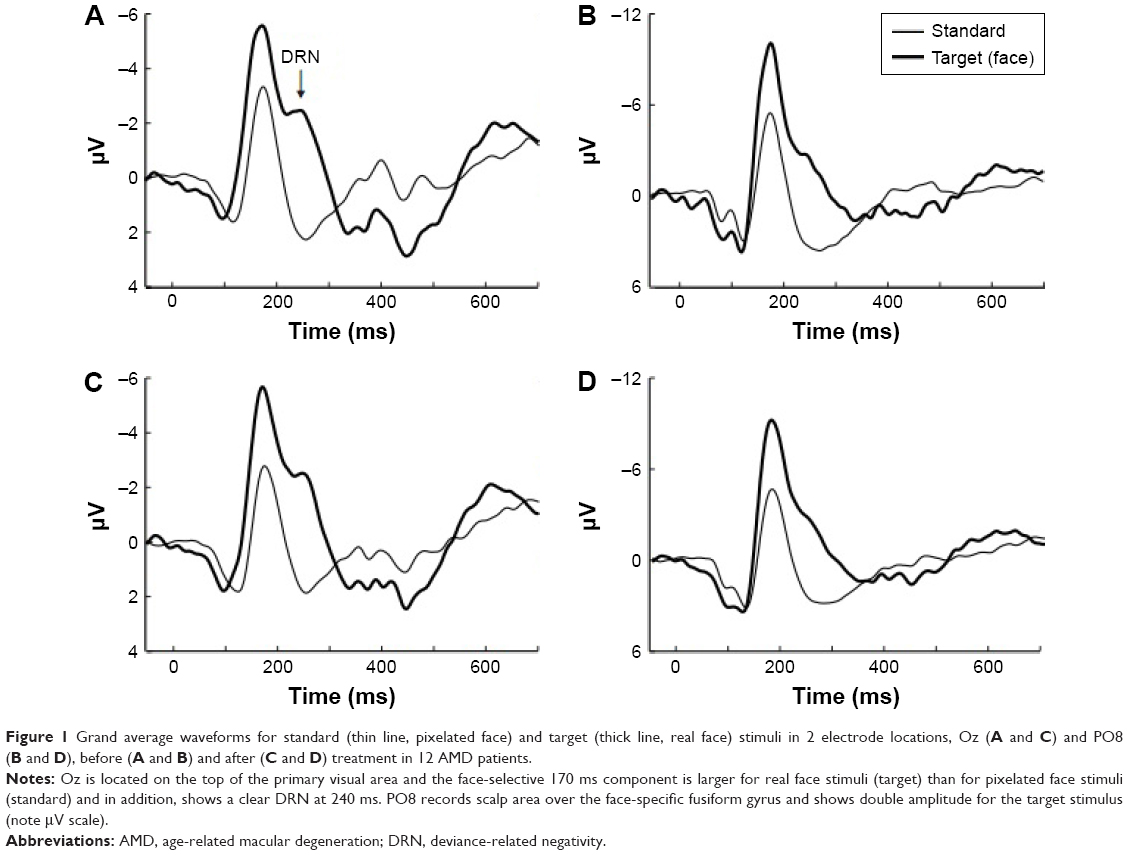 | Figure 1 Grand average waveforms for standard (thin line, pixelated face) and target (thick line, real face) stimuli in 2 electrode locations, Oz (A and C) and PO8 (B and D), before (A and B) and after (C and D) treatment in 12 AMD patients. |
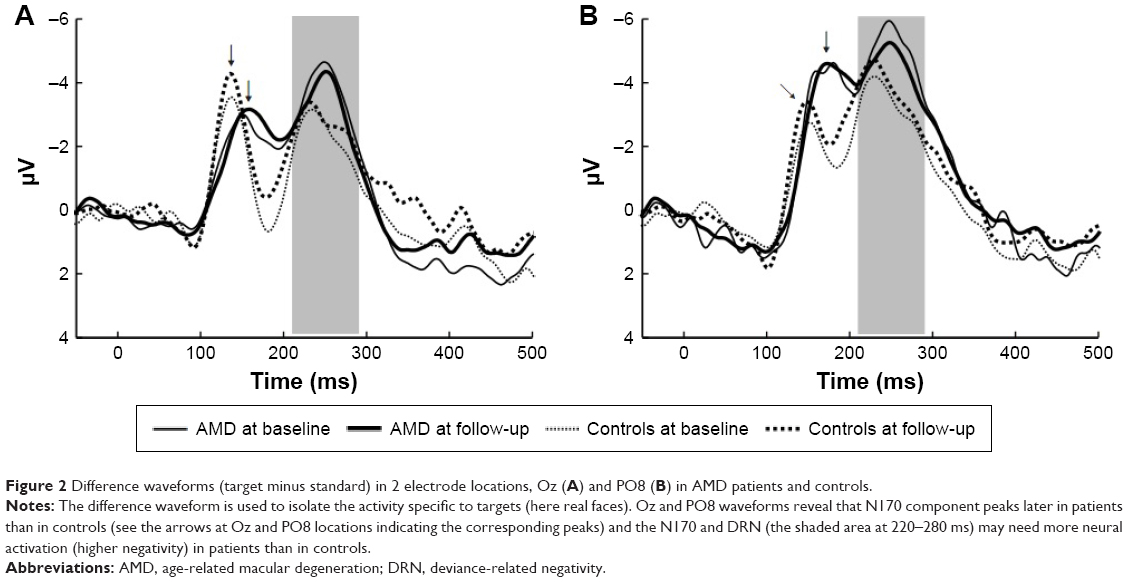 | Figure 2 Difference waveforms (target minus standard) in 2 electrode locations, Oz (A) and PO8 (B) in AMD patients and controls. |
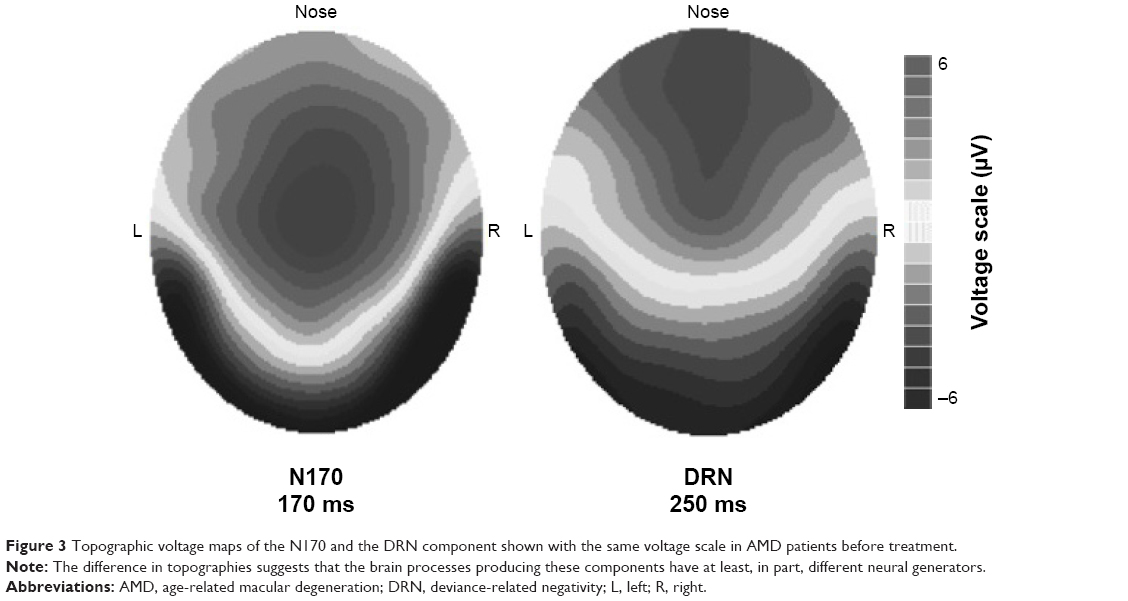 | Figure 3 Topographic voltage maps of the N170 and the DRN component shown with the same voltage scale in AMD patients before treatment. |
The DRN component was observed as a negative deflection followed by a positive deflection called P300. The well-known ERP component, P300, is widely agreed to indicate conscious context updating.27 Hence DRN occurred well before the conscious recognition process of the real face.
Behavioural data of the reaction times to seeing a real face were registered and the times tended to be slightly longer (non-significantly) in patients than in controls. Furthermore, making errors (being late or pushing a button for a standard stimulus) also tended to be more common among patients than in controls, albeit not statistically significant (Table 3).
Discussion
The effects of AMD and its current treatment in any specific cortical visual processes have been only occasionally studied.28–30 Individual patient investigations using functional MRI analysis have examined the reorganization in the visual cortex caused by AMD.31,32 However, the positive and/or negative effects on face processing of the now routine injection treatments have been largely overlooked. There are only 2 groups that have assessed visual evoked potentials (VEP) of wet AMD patients after anti-VEGF injections; reports including 2 of ours, with the key finding of increase in VEP amplitude.28–30 The electrophysiological parameters of face detection in this context have not been reported earlier.
The neurophysiological methods used in this study are widely considered to be reliable real-time markers of the cognitive processes elicited by a given task. The present visual task was a rather conventional oddball paradigm, where subjects were requested to press a button when seeing a real face among the standard elliptical grayscale stimuli. Behaviorally, task performance was not markedly impaired in AMD patients compared with controls even though a tendency toward slower responses was detected. The ERP component N170 latency was shorter in healthy controls than in patients; however, the waveform configurations and amplitudes we obtained here were similar to those in the literature.33–35 Furthermore, the injection therapy did not significantly change the analyzed ERP parameters. The fact that these parameters remained relatively unaltered, even though there was a clear treatment effect in the retinal thickness and VA in the treated eye, is probably best explained by the binocular nature of the present test. In the present data, we cannot separate the roles of individual eyes but it is likely that there was only a minor input from the worse eye during the test.
Our standard stimuli, an ellipsoid without facial characteristics, elicited a VEP component with a peak latency at about 160–170 ms. The real face stimuli elicited the N170 component, which manifests early detection of faces, and these stimuli almost doubled its amplitude in the scalp area above the fusiform gyrus (Figure 1). This rather typical high-amplitude N170 was somewhat unexpectedly followed by a prominent DRN component. DRN is a recognized component in visual mismatch negativity studies that reflects aspects of task difficulty.36 Here, the DRN can be seen as a negative deflection at about 250 ms in the parieto-occipital recording location; however, it is temporally more separated in the occipital recording site (Figures 1 and 2). The difference waveform analysis of target waveforms further clarified the temporal separation and clearly differentiated between the N170 and DRN.
The N170 component elicited by a face picture activates occipito-temporal brain areas, mainly the fusiform gyri, as displayed also in the N170 scalp distribution (Figure 3). The current component configuration and scalp distribution are in good agreement with previous neutral face stimulus analyses.33–35 The scalp distributions of DRN and N170 appear to be different (Figure 3). This difference further supports our view that N170 and DRN are separate processes, both elicited by the same face picture. According to psychophysiological models of human face processing, faces are first detected from their environment during a structural encoding stage, which is followed by the recognition phase during which the individual face will be identified.12 The 250 ms component, which here is called DRN, has also been thought to reflect a face stimulus repetition effect.37–39 Bindemann et al35 demonstrated that N250r was strongest to unprimed faces compared with primed face pictures. Our task corresponds to unprimed face stimuli as no naming or matching was required from our subjects. Hanso et al40 used pixelated images to study the effects of spatial quantification on ERP signatures of familiar versus unfamiliar face perception. They found a stronger negative component for fine and intermediate scale pixelation, but not for coarsely quantized facial images. In spatial frequency terms, their finely and coarsely quantized images are close to our real face and pixelated images, and thus the component they called N250r is very likely the same that we termed DRN. Fortunately, there is one way to determine whether repetition or deviance makes the greatest contribution to this component. Our participants had not seen the images before and thus, there could be no repetition effect in their response to the first occurrence of an individual real face image in the baseline recording. We calculated the grand average of these responses and found that it did not differ from the grand average of the responses over all real face images, apart from being somewhat noisier due to the much smaller number of sweeps on the average. Thus, the component at around 250 ms exists already before stimulus repetition and must be related to either some general or a face-specific deviance detection. It is possible that the DRN reflects the deviant stimulus triggered by accessing the memory storage of previous faces against which a perceived face image is compared. DRN may be a marker of the comparison process already, before the conscious recognition process. This component may well be one of the tools to account for the speed and efficiency at which humans are able to identify faces. The AMD patients’ waveform in Figure 2 hints that the DRN amplitude could be larger in patients than in controls. The present finding is not statistically significant but does suggest that the larger amplitude in the AMD patients may reflect their greater difficulty in making a comparison of target face pictures, that is, they need to activate larger neural assemblies to do the job.
The anti-VEGF treatment did not alter the face recognition parameters in AMD patients even though, as expected, no deterioration in any of the measured amplitudes was observed after the 14–16 weeks’ period. This supports the positive effect of anti-VEGF treatment, also evident in the OCT results. The binocular nature of this test takes into account the importance of the vision of the worse eye. The quality of life and the ability to perform normal activities of daily living are highly influenced by the vision of the better-seeing eye only.41,42 Furthermore, this finding is in alignment with the previous studies that reported a correlation between the better-seeing eye and vision-related quality of life in eye diseases with impairment of the central vision.43
We recognize that by using binocular task performance in this patient group, we have somewhat limited the utilization of our results in psychophysical face recognition research. Further studies should assess binocular VA and conduct experiments separately for each eye. There is a slight age difference between our patients and controls, but this, most likely, exerted no influence on the present results. In further studies, larger and more homogeneous groups should be evaluated.
Acknowledgments
The authors want to thank the participants and Helvi Käsnänen, RN, (Kuopio University Hospital), for technical assistance. This work was supported by the Valtion rutkimus rahoitus grant (state research grant) and the Finnish Eye Foundation.
Disclosure
The authors report no conflicts of interest in this work.
References
Jager RD, Mieler WF, Miller JW. Age-related macular degeneration. N Engl J Med. 2008;358(24):2606–2617. | ||
Day S, Acquah K, Lee PP, Mruthyunjaya P, Sloan FA. Medicare costs for neovascular age-related macular degeneration, 1994–2007. Am J Ophthalmol. 2011;152(6):1014–1020. | ||
Bullimore MA, Bailey IL, Wacker RT. Face recognition in age-related maculopathy. Invest Ophthalmol Vis Sci. 1991;32(7):2020–2029. | ||
Taylor DJ, Hobby AE, Binns AM, Crabb DP. How does age-related macular degeneration affect real-world visual ability and quality of life? A systematic review. BMJ Open. 2016;6(12):e011504. | ||
Brody BL, Gamst AC, Williams RA, et al. Depression, visual acuity, comorbidity, and disability associated with age-related macular degeneration. Ophthalmology. 2001;108(10):1893–1900; discussion 1900-1. | ||
Rovner BW, Casten RJ, Tasman WS. Effect of depression on vision function in age-related macular degeneration. Arch Ophthalmol. 2002;120(8):1041–1044. | ||
Ivers RQ, Cumming RG, Mitchell P, Simpson JM, Peduto AJ. Visual risk factors for hip fracture in older people. J Am Geriatr Soc. 2003;51(3):356–363. | ||
Ying GS, Kim BJ, Maguire MG, et al. Sustained visual acuity loss in the comparison of age-related macular degeneration treatments trials. JAMA Ophthalmol. 2014;132(8):915–921. | ||
Ying GS, Maguire MG, Daniel E, et al. Association of baseline characteristics and early vision response with 2-year vision outcomes in the Comparison of AMD Treatments Trials (CATT). Ophthalmology. 2015;122(12):2523.e1–2531.e1. | ||
Barnes CS, De L’Aune W, Schuchard RA. A test of face discrimination ability in aging and vision loss. Optom Vis Sci. 2011;88(2):188–199. | ||
McCulloch DL, Loffler G, Colquhoun K, Bruce N, Dutton GN, Bach M. The effects of visual degradation on face discrimination. Ophthalmic Physiol Opt. 2011;31(3):240–248. | ||
Haxby JV, Hoffman EA, Gobbini MI. The distributed human neural system for face perception. Trends Cogn Sci. 2000;4(6):223–233. | ||
Kanwisher N, McDermott J, Chun MM. The fusiform face area: a module in human extrastriate cortex specialized for face perception. J Neurosci. 1997;17(11):4302–4311. | ||
Calder AJ, Young AW. Understanding the recognition of facial identity and facial expression. Nat Rev Neurosci. 2005;6(8):641–651. | ||
Dekowska M, Kuniecki M, Jaskowski P. Facing facts: neuronal mechanisms of face perception. Acta Neurobiol Exp (Wars). 2008;68(2):229–252. | ||
LaBar KS, Crupain MJ, Voyvodic JT, McCarthy G. Dynamic perception of facial affect and identity in the human brain. Cereb Cortex. 2003;13(10):1023–1033. | ||
Fairhall SL, Ishai A. Effective connectivity within the distributed cortical network for face perception. Cereb Cortex. 2007;17(10):2400–2406. | ||
Tejeria L, Harper RA, Artes PH, Dickinson CM. Face recognition in age related macular degeneration: perceived disability, measured disability, and performance with a bioptic device. Br J Ophthalmol. 2002;86(9):1019–1026. | ||
Risk factors for choroidal neovascularization in the second eye of patients with juxtafoveal or subfoveal choroidal neovascularization secondary to age-related macular degeneration. Macular Photocoagulation Study Group. Arch Ophthalmol. 1997;115(6):741–747. | ||
Tarita-Nistor L, Gonzalez EG, Markowitz SN, Steinbach MJ. Binocular interactions in patients with age-related macular degeneration: acuity summation and rivalry. Vision Res. 2006;46(16):2487–2498. | ||
Valberg A, Fosse P. Binocular contrast inhibition in subjects with age-related macular degeneration. J Opt Soc Am A Opt Image Sci Vis. 2002;19(1):223–228. | ||
Bellmann C, Feely M, Crossland MD, Kabanarou SA, Rubin GS. Fixation stability using central and pericentral fixation targets in patients with age-related macular degeneration. Ophthalmology. 2004;111(12):2265–2270. | ||
Gonzalez EG, Tarita-Nistor L, Mandelcorn ED, Mandelcorn M, Steinbach MJ. Fixation control before and after treatment for neovascular age-related macular degeneration. Invest Ophthalmol Vis Sci. 2011;52(7):4208–4213. | ||
Chakravarthy U, Harding SP, Rogers CA, et al. Alternative treatments to inhibit VEGF in age-related choroidal neovascularisation: 2-year findings of the IVAN randomised controlled trial. Lancet. 2013;382(9900):1258–1267. | ||
Ekman P, Friesen WV. Pictures of Facial Affect. Palo Alto, CA: Consulting Psychologists Press; 1976. | ||
Semlitsch HV, Anderer P, Schuster P, Presslich O. A solution for reliable and valid reduction of ocular artifacts, applied to the P300 ERP. Psychophysiology. 1986;23(6):695–703. | ||
Rutiku R, Martin M, Bachmann T, Aru J. Does the P300 reflect conscious perception or its consequences? Neuroscience. 2015;298:180–189. | ||
Macky TA, Mahgoub MM. Electrophysiological assessment of optic nerve and retinal functions following intravitreal injection of bevacizumab (avastin). J Ocul Pharmacol Ther. 2012;28(2):159–165. | ||
Vottonen P, Kaarniranta K, Paakkonen A, Tarkka IM. Changes in neurophysiologic markers of visual processing following beneficial anti-VEGF treatment in macular degeneration. Clin Ophthalmol. 2013;7:437–442. | ||
Vottonen P, Paakkonen A, Tarkka IM, Kaarniranta K. Best-corrected visual acuity and retinal thickness are associated with improved cortical visual processing in treated wet AMD patients. Acta Ophthalmol. 2015;93(7):621–625. | ||
Dilks DD, Baker CI, Peli E, Kanwisher N. Reorganization of visual processing in macular degeneration is not specific to the “preferred retinal locus”. J Neurosci. 2009;29(9):2768–2773. | ||
Dilks DD, Julian JB, Peli E, Kanwisher N. Reorganization of visual processing in age-related macular degeneration depends on foveal loss. Optom Vis Sci. 2014;91(8):e199–e206. | ||
Mnatsakanian EV, Tarkka IM. Familiar-face recognition and comparison: source analysis of scalp-recorded event-related potentials. Clin Neurophysiol. 2004;115(4):880–886. | ||
Bentin S, Golland Y, Flevaris A, Robertson LC, Moscovitch M. Processing the trees and the forest during initial stages of face perception: electrophysiological evidence. J Cogn Neurosci. 2006;18(8):1406–1421. | ||
Bindemann M, Burton AM, Leuthold H, Schweinberger SR. Brain potential correlates of face recognition: geometric distortions and the N250r brain response to stimulus repetitions. Psychophysiology. 2008;45(4):535–544. | ||
Kimura M, Takeda Y. Task difficulty affects the predictive process indexed by visual mismatch negativity. Front Hum Neurosci. 2013;7:267. | ||
Begleiter H, Porjesz B, Wang W. Event-related brain potentials differentiate priming and recognition to familiar and unfamiliar faces. Electroencephalogr Clin Neurophysiol. 1995;94(1):41–49. | ||
Schweinberger SR, Huddy V, Burton AM. N250r: a face-selective brain response to stimulus repetitions. Neuroreport. 2004;15(9):1501–1505. | ||
Neumann MF, Schweinberger SR. N250r and N400 ERP correlates of immediate famous face repetition are independent of perceptual load. Brain Res. 2008;1239:181–190. | ||
Hanso L, Bachmann T, Murd C. Tolerance of the ERP signatures of unfamiliar versus familiar face perception to spatial quantization of facial images. Psychology. 2010(1):199–208. | ||
Brown GC. Vision and quality-of-life. Trans Am Ophthalmol Soc. 1999;97:473–511. | ||
McClure ME, Hart PM, Jackson AJ, Stevenson MR, Chakravarthy U. Macular degeneration: do conventional measurements of impaired visual function equate with visual disability? Br J Ophthalmol. 2000;84(3):244–250. | ||
Hirneiss C. The impact of a better-seeing eye and a worse-seeing eye on vision-related quality of life. Clin Ophthalmol. 2014;8:1703–1709. |
 © 2017 The Author(s). This work is published and licensed by Dove Medical Press Limited. The
full terms of this license are available at https://www.dovepress.com/terms
and incorporate the Creative Commons Attribution
- Non Commercial (unported, 3.0) License.
By accessing the work you hereby accept the Terms. Non-commercial uses of the work are permitted
without any further permission from Dove Medical Press Limited, provided the work is properly
attributed. For permission for commercial use of this work, please see paragraphs 4.2 and 5 of our Terms.
© 2017 The Author(s). This work is published and licensed by Dove Medical Press Limited. The
full terms of this license are available at https://www.dovepress.com/terms
and incorporate the Creative Commons Attribution
- Non Commercial (unported, 3.0) License.
By accessing the work you hereby accept the Terms. Non-commercial uses of the work are permitted
without any further permission from Dove Medical Press Limited, provided the work is properly
attributed. For permission for commercial use of this work, please see paragraphs 4.2 and 5 of our Terms.