Back to Journals » Clinical Interventions in Aging » Volume 13
Twenty-four-hour systolic blood pressure variability and renal function decline in elderly male hypertensive patients with well-controlled blood pressure
Authors Wang X, Wang F, Chen M, Wang X, Zheng J, Qin A
Received 6 January 2018
Accepted for publication 22 February 2018
Published 4 April 2018 Volume 2018:13 Pages 533—540
DOI https://doi.org/10.2147/CIA.S161752
Checked for plagiarism Yes
Review by Single anonymous peer review
Peer reviewer comments 2
Editor who approved publication: Dr Zhi-Ying Wu
Xi Wang, Fan Wang, Minzhi Chen, Xiaona Wang, Jin Zheng, Aimei Qin
Department of Geriatric Cardiology, Chinese PLA General Hospital, Beijing, China
Purpose: Increased variability in blood pressure (BP) is known to be closely associated with the development, progression and severity of renal damage in patients with chronic kidney disease. However, little is known about the association of BP variability (BPV) with the decline of renal function in elderly hypertensive patients with well-controlled BP. We, therefore, aimed to investigate the association between BPV and glomerular filtration rate in hypertensive elderly (age >60 years) and very elderly (age >80 years) male patients with BP controlled within the normal range by antihypertensive therapy.
Patients and methods: This study involved 484 hospitalized elderly male hypertensive patients with BP controlled within the normal range by antihypertensive therapy. BPV was defined as the SD from mean BP over a 24 h period. Renal function was estimated by estimated glomerular filtration rate (eGFR) which was calculated by the Chinese modified Modification of Diet in Renal Disease Equation. Participants were divided into three groups according to their eGFR data. Multivariate linear regression was then used to analyze the correlation between eGFR and BPV.
Results: The 24 h systolic BP (SBP) variability increased as eGFR decreased. There was no significant difference in 24 h SBP variability when compared between elderly and very elderly hypertensive patients. Multivariate linear regression analysis showed that SBP variability demonstrated a negative linear relationship with eGFR (P<0.05) after adjustment for potential confounding factors.
Conclusion: Among the parameters of 24 h ambulatory BP monitoring, 24 h SBP variability is the only independent risk factor for a decline in renal function in elderly and very elderly male hypertensive patients with well-controlled BP.
Keywords: hypertension, elderly male, blood pressure variability, estimated glomerular filtration rate
Introduction
The prevalence of chronic kidney disease (CKD) or end-stage renal disease is growing rapidly, particularly in the elderly population, and is thus becoming a global economic burden. Impaired renal function is mainly caused by high blood pressure (BP) as a result of contributing factors such as aging, diabetes and atherosclerotic disease.1,2 While the use of antihypertensive drugs can help to control hypertension, hypertensive patients with well-controlled BP still suffer from a decline in renal function.3 Therefore, for hypertensive patients with well-controlled BP, it is important to identify the potential mechanisms involved with BP variability (BPV) and renal decline other than those that are already known, including BP, blood lipids and age.
Ambulatory BP monitoring (ABPM) has been shown to be a better predictor of target organ damage, cardiovascular (CV) risk and clinical outcomes than office BP measurements in the clinic setting.4 BPV can be demonstrated by ABPM, which reflects BP fluctuation within a certain period of time and is usually defined by the standard deviation of BP. Accumulating evidence has also shown that BPV observed during 24 h ABPM was also associated with an increased risk of target organ damage and early atherosclerosis in a manner which was independent of mean BP levels.5,6 Several general population-based studies have reported that measures of 24 h BPV could serve as an independent predictor for CV events and all-cause mortality.7,8 More recently, an increasing body of evidence has shown that increased BPV can predict CV events and all-cause mortality in patients with CKD.9,10 One cross-sectional study has demonstrated an association between short-term BPV and albuminuria in hypertensive patients.11 Therefore, increased BPV is a correlative factor which can be used to predict the development, progression and severity of renal organ damage in patients with hypertension and CKD.12
In the elderly population, the aging process causes a reduction in neurologic function and an increase in vascular stiffness, thus resulting in BPV.13 However, little is known about the association between BPV and the decline in renal function in elderly hypertensive patients with well-controlled BP. Therefore, in this study, we monitored 24 h ABPM and estimated glomerular filtration rate (eGFR) in elderly and very elderly male hypertensive patients with well-controlled BP during a period of hospitalization.
Patients and methods
Study subjects
We enrolled 484 patients who were hospitalized at the Department of Geriatric Cardiology of the Chinese People’s Liberation Army (PLA) General Hospital between January 2014 and December 2016, and met our specific inclusion criteria: 1) male gender and older than 60 years, 2) nonsmoking, 3) diagnosed with essential hypertension in line with the high BP diagnosis standards described in the Chinese Hypertension Prevention and Treatment Guide,14 and 4) receiving antihypertension medication with well-controlled BP over the 3 months prior to hospitalization. The applied standard was that the BP, which was taken twice a day at 9:00 am and 16:00 pm, remained <140/90 mmHg (<150/90 mmHg for very elderly patients) for 3 days after hospitalization.
Our exclusion criteria were as follows: 1) patients with secondary hypertension, 2) patients with atrial fibrillation and those taking antiarrhythmic drugs, 3) patients undergoing hemodialysis, and 4) patients with severe heart and lung dysfunction and patients suffering from mental diseases.
The study protocol was approved by the Ethics Committee of the PLA General Hospital (Beijing, China). All participants provided written informed consent for the study. Prior to wearing a dynamic sphygmomanometer, patients and their carers received training on how to record daily activities.
Clinical data collection
This study adopted a cross-sectional observational design. Patients aged <80 years were defined as elderly patients, while patients aged >80 years were defined as very elderly patients. On the day of hospital admission, information relating to medication use, history of hypertension, diabetes, and coronary heart disease was obtained by self-reporting using a face-to-face counseling method. BP was then measured using a calibrated desktop sphygmomanometer with the participants in the sitting position for at least 5 min. Height and weight were measured and recorded, and then body mass index (BMI) was calculated as the weight in kilograms divided by the height in meters squared (kg/m2). The investigation was completed by physicians in the Department of Geriatric Cardiology of the PLA General Hospital who were trained by the research team.
Twenty-four-hour ABPM
A total of 502 elderly male hypertensive patients underwent 24 h ABPM using a noninvasive portable BP monitor (SpaceLabs 90207 recorder; Spacelabs Healthcare, Snoqualmie, WA, USA) as described previously.15 In brief, monitoring began in the morning 3 days after patients were admitted to our hospital. A BP cuff was fitted onto the participant’s non-dominant arm, with the cuff size being determined by the upper arm circumference. BP was then measured automatically at 30 min intervals during the daytime (from 6:00 am to 10:00 pm) and at 60 min intervals during the nighttime (from 10:00 pm to 6:00 am). There was no limitation for the patients in relation to daily activities, and they were allowed to continue taking their medication. Their 24 h activity was self-recorded during ABPM recording. Sleep and awakening times were obtained from each patient’s self-report. Interactive software was then used to analyze the recordings. Only recordings of good technical quality (≥80% of valid measurements) were included in our final analyses.
Twenty-four-hour ambulatory BP parameters
Mean values of 24 h daytime and nighttime systolic BP (SBP) and diastolic BP (DBP) were calculated for each patient. The 24 h BP loading value was the percentage of the number of occurrences involving SBP >135 mmHg or DBP >85 mmHg during the daytime, and SBP >125 mmHg or DBP >75 mmHg during the nighttime. A reduction of nighttime SBP and DBP refers to the difference between the nighttime mean SBP and DBP when compared with daytime SBP and DBP. SDs for 24 h SBP and DBP were defined as BPV. BP was measured in units of mmHg (1 mmHg=0.133 kPa).
Laboratory measurements
Blood sampling was performed after hospital admission between 7:30 am and 8:30 am after overnight fasting. Serum levels of total cholesterol, triglycerides, high-density lipoprotein cholesterol, plasma glucose, creatinine, and uric acid were measured by a qualified technician using enzymatic assays (Hoffman-La Roche Ltd., Basel, Switzerland) with a full automatic biochemical autoanalyzer (COBAS c6000; Hoffman-La Roche Ltd.). Low-density lipoprotein cholesterol was calculated using the Friedewald formula.16 Renal function was estimated by eGFR which was calculated using the Chinese-modified Modification of Diet in Renal Disease equation as follows:17 eGFR (mL/min/1.73 m2) = 175 × standard creatinine (mg/dL)−1.234 × age (years)−0.179 × (0.79 if female).
Statistical analyses
Continuous normal variables are expressed as mean and SD. Normality of raw data was tested using Kolmogorov–Smirnov criteria. Skewed variables are expressed as medians with quartile range. Categorical variables are expressed as numbers and percentages. Baseline characteristics were grouped separately for age and are presented separately for elderly patients (aged ≤80 years) and very elderly patients (aged >80 years). Differences were compared with the two-sample t-test or a nonparametric test for continuous variables and with the chi-square test for categorical variables. Patients were divided into three groups according to their eGFR: eGFR ≥90 group, eGFR 60–89 group, and eGFR <60 group (mL/min/1.73 m2). Statistical comparison of the three groups was undertaken by one-way analysis of covariance (continuous variables).
Pearson’s correlation analysis was used to analyze the correlations between ABMP parameters and eGFR in the elderly and very elderly groups of patients. Multiple linear regression analysis was applied to evaluate the independent correlates between ABMP parameters (the independent variable) and eGFR (the dependent variable), after adjusting several potential confounders (covariates). Data entry and management were undertaken with a Microsoft Excel (Microsoft, Seattle, WA, USA) spreadsheet. P<0.05 was considered to be statistically significant.
Results
Patient characteristics
A total of 502 patients were eligible for inclusion in this survey. Of these, the APBM parameters of 18 patients were not completely recorded, and thus, our final analysis involved 484 patients. Patients were aged between 60 and 103 years, with the average age being 79.85±10.17 years; 207 of these patients were <80 years old and 277 were ≥80 years old.
The characteristics of these patients are shown in Table 1. Patients were grouped according to age and defined as either elderly or very elderly. Analysis revealed the percentage of diabetes and coronary artery disease was higher in the very elderly patients than in the elderly patients (P<0.001). The elderly patients had higher levels of total cholesterol (P=0.013), low-density lipoprotein cholesterol (P<0.001), and 24 h mean DBP (P=0.006), and a decrease of nighttime SBP (P<0.001) and nighttime DBP (P=0.006) than the very elderly patients. The levels of serum uric acid, nighttime mean SBP and 24 h SBP loading value were lower in the elderly patients than those in the very elderly patients (P<0.05). eGFR was lower in the very elderly patients than in the elderly patients (P<0.001). However, there were no significant differences between the two groups in terms of either 24 h SBP variability or DBP variability.
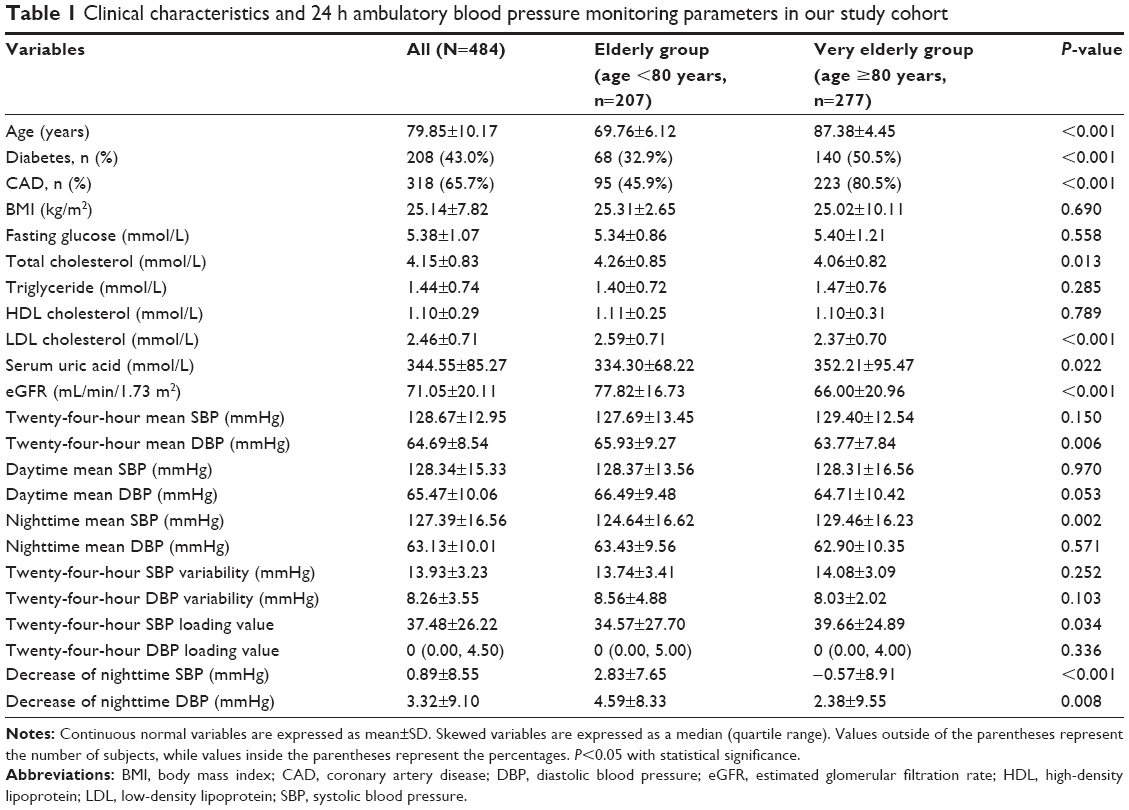 | Table 1 Clinical characteristics and 24 h ambulatory blood pressure monitoring parameters in our study cohort |
A comparison of 24 h ABPM parameters in patients with different eGFRs
The 24 h ABPM data are listed in Table 2. Patients were divided into three groups based on their eGFR: eGFR ≥90 group, 60≤eGFR<89 group, and eGFR <60 group (eGFR unit: mL/min/1.73 m2). Analysis showed that compared with the eGFR ≥90 group, both the 60≤eGFR<89 group and the eGFR <60 group had different daytime and nighttime mean SBP, 24 h SBP variability, 24 h SBP loading value, and reduction in nighttime BP. As eGFR reduced, the level of nighttime mean SBP, 24 h SBP variability and 24 h SBP loading increased (P<0.05), while the level of nighttime SBP and DBP reduced (P<0.05). However, there were no significant differences among the three groups in terms of 24 h mean SBP and DBP, daytime and nighttime mean DBP, 24 h DBP loading value, or 24 h DBP variability.
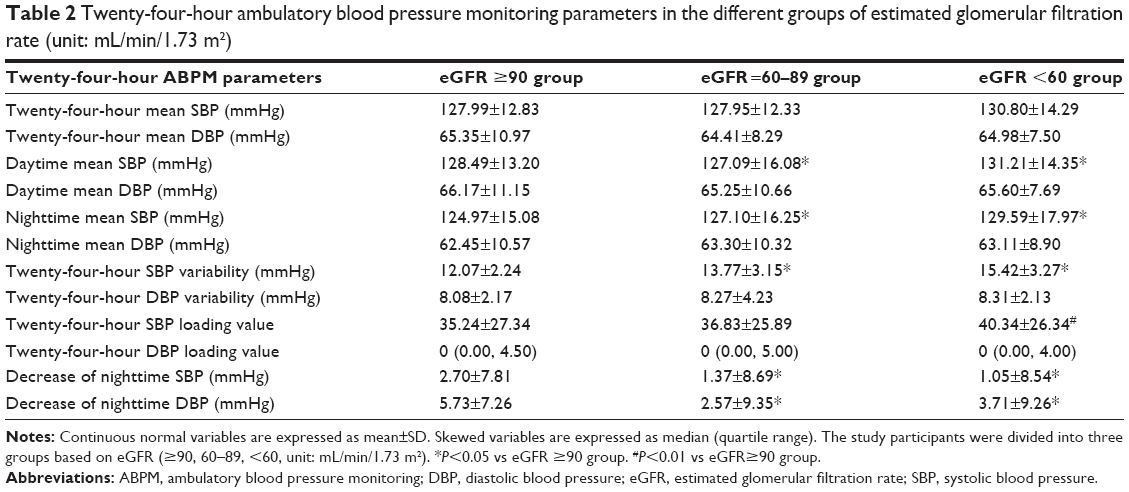 | Table 2 Twenty-four-hour ambulatory blood pressure monitoring parameters in the different groups of estimated glomerular filtration rate (unit: mL/min/1.73 m2) |
Association between 24 h SBP variability and eGFR in elderly and very elderly patients
Pearson’s correlation analysis was performed using eGFR as the dependent variable and ABPM parameters as the independent variable. This showed that 24 h SBP variability was related to eGFR in elderly and very elderly male hypertensive patients with well-controlled BP by antihypertension therapy (P<0.05; Figures 1 and 2).
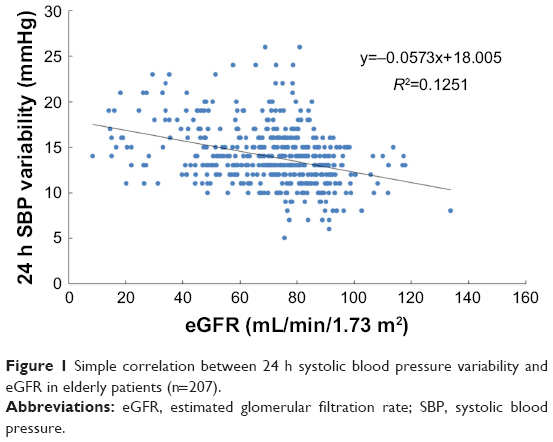 | Figure 1 Simple correlation between 24 h systolic blood pressure variability and eGFR in elderly patients (n=207). |
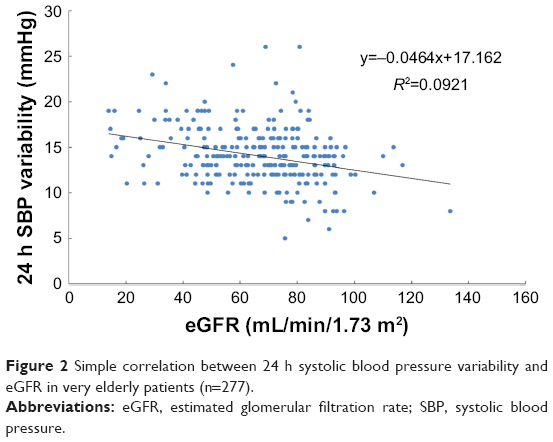 | Figure 2 Simple correlation between 24 h systolic blood pressure variability and eGFR in very elderly patients (n=277). |
To determine whether 24 h SBP variability could independently be correlated with the reduction of eGFR in elderly male hypertensive patients with well-controlled BP, we included all clinical variables and ABPM parameters in multiple linear regression analysis using eGFR as the dependent variable (the standards for the candidate variable and rejection variable were both set as 0.05). Results showed that 24 h SBP variability and the level of uric acid were independently and inversely associated with eGFR in elderly and very elderly male hypertensive patients with well-controlled BP. Furthermore, age and BMI were independently and inversely associated with eGFR in very elderly male hypertensive patients with well-controlled BP (Table 3).
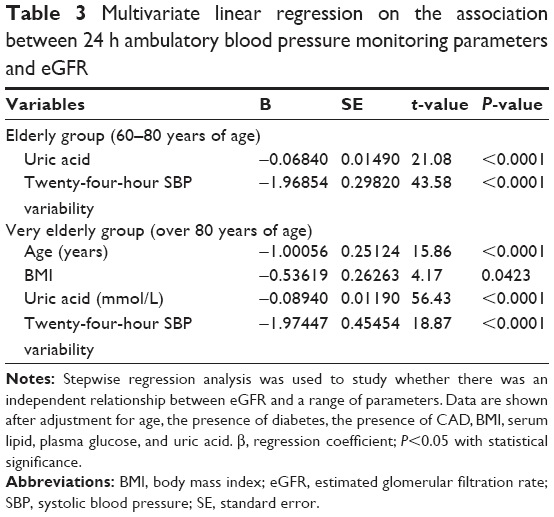 | Table 3 Multivariate linear regression on the association between 24 h ambulatory blood pressure monitoring parameters and eGFR |
Discussion
The main finding of this retrospective study confirmed that among the different parameters of 24 h ABPM, 24 h SBP variability was the only independent variable associated with the decline in renal function in elderly and very elderly hypertensive male patients with well-controlled BP. An association between renal function decline with daytime SBP and 24 h DBP loading value was observed only in univariate analyses carried out on the group of elderly patients, which lost statistical significance after taking into account the effect of some covariates in multiple regression analyses. To the best of our knowledge, this study was the first to investigate the relationship between BPV and renal function in elderly and very elderly hypertensive patients with well-controlled BP.
BPV, which refers to the degree of BP fluctuation during a certain period of time, is usually presented by the SD or coefficient of variation (SD/mean) of the BP taken during a particular time period. Short-term BPV can be derived from 24 h ABPM. However, we know very little about the specific mechanisms underlying BPV, although there is some evidence to suggest that environmental stimuli, behavioral factors, and neural, reflex, and humoral factors may be involved.18 It has been reported that autonomic dysfunction and artery stiffness represent the two main causes for increased BPV.19,20 As these two factors change with age, BPV is understandably higher in the elderly population compared with that in the younger population. In this research, we showed that there was no significant difference in BPV when comparing an elderly group of patients and a very elderly group of patients. This finding could be due to the low number of participants, which is the hurdle for achieving statistical significance; on the other hand, BPV influenced by a complex range of factors and limited daily activity could reduce BPV in the very elderly population, particularly when these patients are hospitalized.
Previous research has shown that increased BPV is an independent predictor for CV events, especially for stroke in the general population and patients in the early stages of hypertension.21,22 A combination of retrospective and prospective research studies has also demonstrated that 24 h BPV can predict end-organ damage, such as an increase in the left ventricular mass index and the thickness of the intima–media wall.23,24 Several studies have also shown that alterations in BPV may predict the development and progression of renal damage in a manner which is independent of mean BP levels.25,26 Increased short-term BPV is positively correlated with impaired renal function when assessed by microalbuminuria, even after adjusting for baseline characteristics and ABPM parameters in non-treated essential hypertensives.15 This study showed that in elderly and very elderly hypertensive patients with well-controlled BP by medication, only 24 h SBP variability was independently associated with eGFR; this relationship was not observed for other ABPM parameters. Our results thus indicate that an increase in 24 h SBP variability could be the main causative factor that leads to a decline in renal function in elderly male hypertensive patients with well-controlled BP.
However, the exact mechanisms underlying the link between BPV and renal function are, as yet, unclear. Several potential mechanisms may explain this link. First, an increase in BPV could lead to vascular injury and endothelial dysfunction. One study showed that 24 h BPV was inversely associated with CD62+ endothelial microparticles and positively associated with nitroglycerin-mediated dilation.27 Ozkayar et al28 identified a significant negative correlation between 24 h BPV and the proportion of flow-mediated dilatation, which is a commonly used parameter for assessing endothelial dysfunction. A prospective cohort study evaluated the predictive value of BPV for arteriovenous fistulae dysfunction and found that an increase in SBP variability could aggravate venous wall inflammation and may play a role in arteriovenous fistulae dysfunction.29 Second, an increase in BPV can result in artery stiffness, which can, in turn, lead to a decline in renal function. Ishikura et al3 reported a relationship between short-term BPV and arterial stiffness in patients with hypertension and diabetes. The carotid–femoral pulse wave velocity, which is a prognostic measurement of arterial stiffness, is high in CKD and end-stage renal disease patients and renal artery stiffness directly leads to renal dysfunction in these patients.30 Third, BPV and the local kidney renin–angiotensin system (RAS) could interact. For example, Ozkayar et al31 identified a relationship between local RAS activation in the kidneys and an increase in BPV in hypertensive patients. The activation of RAS may play a role in the development of hypertension and renal dysfunction. In other words, BPV and renal function exhibit a pathophysiological correlation.
BPV includes both short-term and long-term variability of the BP. The predictive value of short-term BPV has been established by a number of studies. Recent retrospective trials, and general population-based studies, have shown that long-term BPV (ie, “visit-to-visit” variability) is also a powerful predictor of stroke, CV events, and all-cause mortality, in a manner which is independent of mean BP.32,33 A very recent study, with a large sample size of 2,464 subjects, confirmed a significant positive correlation between visit-to-visit variability and short-term SBP variability calculated using a variety of methods; furthermore, visit-to-visit variability and short-term BPV calculated using different methods were all negatively correlated with eGFR.34 This study used short-term variability derived from 24 h ABPM, especially 24 h ABPM during hospitalization; consequently, our research findings are objective and significant.
In addition, our current research demonstrated that uric acid level was independently and inversely associated with eGFR in elderly and very elderly male hypertensive patients with well-controlled BP. Furthermore, age and BMI were independently and inversely associated with eGFR in very elderly male hypertensive patients with well-controlled BP. These results relating to a relationship between eGFR and both uric acid and age are consistent with earlier reports.35 However, BMI may represent a controversial variable because some studies have failed to find an association with eGFR.36
Our current study has several limitations which need to be considered. First, this study featured a small sample size. Although we found that among the parameters of 24 h ABPM, 24 h SBP variability was the only independent factor associated with a decline in renal function, this was derived from a small sample size. Further studies, using a larger sample size, are now needed to confirm our results. Another limitation of this study was that all of our subjects were male. Our department only serves patients who are ex-military and most of the patients in this specific group tend to be male. As a consequence, our study only involved male patients. Finally, this was a cross-sectional study, and a prospective study is now needed to confirm the presence of a true association.
Conclusion
In conclusion, our results indicated that among the parameters involved with 24 h ABPM, 24 h SBP variability was the only independent risk factor for a decline in renal function in elderly and very elderly male hypertensive patients with well-controlled BP. Further large and well-conducted studies are now required to provide more definitive evidence.
Acknowledgments
We thank colleagues at the Department of Laboratory Medicine, PLA General Hospital, for their help with biochemical measurements. We are also grateful to all study participants for their participation in the study. This research is supported by a grant from the National Nature Science Foundation of China (81500316) and a grant from the Open Project Program of the State Key Laboratory of Proteomics (SKLP-O201508) to FW.
Author contributions
All authors contributed to the intellectual development of this paper. FW designed the study; MC and AQ participated in acquisition of data; FW and JZ researched and evaluated the literature; XNW undertook the statistical analysis; XW wrote the first draft of the manuscript. All authors contributed toward data analysis, drafting and revising the paper and agree to be accountable for all aspects of the work.
Disclosure
The authors report no conflicts of interest in this work.
References
Hamrahian SM. Management of hypertension in patients with chronic kidney disease. Curr Hypertens Rep. 2017;19:43. | ||
Singh TK, Arya V, Navaratnarajah N. Chronic kidney disease and cardiovascular disease: a focus on primary care. Cardiovasc Hematol Disord Drug Targets. 2014;14:212–218. | ||
Ishikura K, Obara T, Kikuya M, et al. J-HOME-Morning Study Group. Home blood pressure level and decline in renal function among treated hypertensive patients: the J-HOME-Morning Study. Hypertens Res. 2016;39:107–112. | ||
Pickering TG, Shimbo D, Haas D. Ambulatory blood-pressure monitoring. N Engl J Med. 2006;354:2368–2374. | ||
Veerabhadrappa P, Diaz KM, Feairheller DL, et al. Enhanced blood pressure variability in a high cardiovascular risk group of African Americans: FIT4 Life Study. J Am Soc Hypertens. 2010;4:187–195. | ||
Wittke EI, Fuchs SC, Moreira LB, Foppa M, Fuchs FD, Gus M. Blood pressure variability in controlled and uncontrolled blood pressure and its association with left ventricular hypertrophy and diastolic function. J Hum Hypertens. 2016;30:483–487. | ||
Hansen TW, Thijs L, Li Y, et al. Prognostic value of reading-to-reading blood pressure variability over 24 hours in 8938 subjects from 11 populations. Hypertension. 2010;55:1049–1057. | ||
Floras JS. Blood pressure variability: a novel and important risk factor. Can J Cardiol. 2013;29:557–563. | ||
Mallamaci F, Minutolo R, Leonardis D, et al. Long-term visit-to-visit office blood pressure variability increases the risk of adverse cardiovascular outcomes in patients with chronic kidney disease. Kidney Int. 2013;84:381–389. | ||
McMullan CJ, Bakris GL, Phillips RA, Forman JP. Association of BP variability with mortality among African Americans with CKD. Clin J Am Soc Nephrol. 2013;8:731–738. | ||
Yokota K, Fukuda M, Matsui Y, Hoshide S, Shimada K, Kario K. Impact of visit-to-visit variability of blood pressure on deterioration of renal function in patients with non-diabetic chronic kidney disease. Hypertens Res. 2013;36:151–157. | ||
Parati G, Ochoa JE, Bilo G. Blood pressure variability, cardiovascular risk, and risk for renal disease progression. Curr Hypertens Rep. 2012;14:421–431. | ||
McDonald C, Pearce MS, Wincenciak J, Kerr SR, Newton JL. Ambulatory blood pressure variability increases over a 10-year follow-up in community-dwelling older people. Am J Hypertens. 2016;29:560–567. | ||
Jin CN, Yu CM, Sun JP, et al. The healthcare burden of hypertension in Asia. Heart Asia. 2013;5:238–243. | ||
Mulè G, Riccobene R, Castiglia A, et al. Relationships between mild hyperuricaemia and aortic stiffness in untreated hypertensive patients. Nutr Metab Cardiovasc Dis. 2014;24:744–750. | ||
Martins J, Olorunju SA, Murray LM, Pillay TS. Comparison of equations for the calculation of LDL-cholesterol in hospitalized patients. Clin Chim Acta. 2015;444:137–142. | ||
Wang F, Zheng J, Ye P, et al. Association of high-density lipoprotein cholesterol with the estimated glomerular filtration rate in a community-based population. PLoS One. 2013;8:e79738. | ||
Barbic F, Heusser K, Marchi A, et al. Cardiovascular parameters and neural sympathetic discharge variability before orthostatic syncope: role of sympathetic baroreflex control to the vessels. Physiol Meas. 2015;36:633–641. | ||
Sueta D, Koibuchi N, Hasegawa Y, et al. Blood pressure variability, impaired autonomic function and vascular senescence in aged spontaneously hypertensive rats are ameliorated by angiotensin blockade. Atherosclerosis. 2014;236:101–107. | ||
Schillaci G, Bilo G, Pucci G, et al. Relationship between short-term blood pressure variability and large-artery stiffness in human hypertension: findings from 2 large databases. Hypertension. 2012;60:369–377. | ||
Suchy-Dicey AM, Wallace ER, Mitchell SV, et al. Blood pressure variability and the risk of all-cause mortality, incident myocardial infarction, and incident stroke in the cardiovascular health study. Am J Hypertens. 2013;26:1210–1217. | ||
Pierdomenico SD, Di Nicola M, Esposito AL, et al. Prognostic value of different indices of blood pressure variability in hypertensive patients. Am J Hypertens. 2009;22:842–847. | ||
Ciobanu AO, Gherghinescu CL, Dulgheru R, et al. The impact of blood pressure variability on subclinical ventricular, renal and vascular dysfunction, in patients with hypertension and diabetes. Maedica (Buchar). 2013;8:129–136. | ||
Xiong H, Wu D, Tian X, et al. The relationship between the 24 h blood pressure variability and carotid intima-media thickness: a compared study. Comput Math Methods Med. 2014;2014:303159. | ||
Leoncini G, Viazzi F, Storace G, Deferrari G, Pontremoli R. Blood pressure variability and multiple organ damage in primary hypertension. J Hum Hypertens. 2013;27:663–670. | ||
Kario K. Proposal of a new strategy for ambulatory blood pressure profile-based management of resistant hypertension in the era of renal denervation. Hypertens Res. 2013;36:478–484. | ||
Diaz KM, Veerabhadrappa P, Kashem MA, et al. Visit-to-visit and 24-h blood pressure variability: association with endothelial and smooth muscle function in African Americans. J Hum Hypertens. 2013;27:671–677. | ||
Ozkayar N, Altun B, Yildirim T, et al. Blood pressure measurements, blood pressure variability and endothelial function in renal transplant recipients. Clin Exp Hypertens. 2014;36:392–397. | ||
Cheng Y, Zhang F, Zhu J, et al. Influence of blood pressure variability on the life of arteriovenous fistulae in maintenance hemodialysis patients. Clin Hemorheol Microcirc. 2016;62:129–137. | ||
Sedaghat S, Mattace-Raso FU, Hoorn EJ, et al. Arterial stiffness and decline in kidney function. Clin J Am Soc Nephrol. 2015;10:2190–2197. | ||
Ozkayar N, Dede F, Akyel F, et al. Relationship between blood pressure variability and renal activity of the renin–angiotensin system. J Hum Hypertens. 2016;30:297–302. | ||
Ohkuma T, Woodward M, Jun M, et al. Prognostic value of variability in systolic blood pressure related to vascular events and premature death in type 2 diabetes mellitus: the ADVANCE-ON study. Hypertension. 2017;70:461–468. | ||
Gosmanova EO, Mikkelsen MK, Molnar MZ, et al. Association of systolic blood pressure variability with mortality, coronary heart disease, stroke, and renal disease. J Am Coll Cardiol. 2016;68:1375–1386. | ||
Wang J, Jiang B, Song L, et al. Correlation between visit-to-visit and short-term blood pressure variability calculated using different methods and glomerular filtration rate. J Hum Hypertens. 2017;31:132–137. | ||
Kuwabara M, Niwa K, Nishi Y, et al. Relationship between serum uric acid levels and hypertension among Japanese individuals not treated for hyperuricemia and hypertension. Hypertens Res. 2014;37:785–789. | ||
Rhee CM, Ahmadi SF, Kalantar-Zadeh K. The dual roles of obesity in chronic kidney disease: a review of the current literature. Curr Opin Nephrol Hypertens. 2016;25:208–216. |
 © 2018 The Author(s). This work is published and licensed by Dove Medical Press Limited. The
full terms of this license are available at https://www.dovepress.com/terms
and incorporate the Creative Commons Attribution
- Non Commercial (unported, 3.0) License.
By accessing the work you hereby accept the Terms. Non-commercial uses of the work are permitted
without any further permission from Dove Medical Press Limited, provided the work is properly
attributed. For permission for commercial use of this work, please see paragraphs 4.2 and 5 of our Terms.
© 2018 The Author(s). This work is published and licensed by Dove Medical Press Limited. The
full terms of this license are available at https://www.dovepress.com/terms
and incorporate the Creative Commons Attribution
- Non Commercial (unported, 3.0) License.
By accessing the work you hereby accept the Terms. Non-commercial uses of the work are permitted
without any further permission from Dove Medical Press Limited, provided the work is properly
attributed. For permission for commercial use of this work, please see paragraphs 4.2 and 5 of our Terms.