Back to Journals » International Journal of Nanomedicine » Volume 11
Toward a general physiologically-based pharmacokinetic model for intravenously injected nanoparticles
Authors Carlander U, Li D ![]() , Jolliet O, Emond C, Johanson G
, Jolliet O, Emond C, Johanson G
Received 13 August 2015
Accepted for publication 10 October 2015
Published 11 February 2016 Volume 2016:11 Pages 625—640
DOI https://doi.org/10.2147/IJN.S94370
Checked for plagiarism Yes
Review by Single anonymous peer review
Peer reviewer comments 2
Editor who approved publication: Dr Thomas Webster
Ulrika Carlander,1 Dingsheng Li,2 Olivier Jolliet,2 Claude Emond,3,4 Gunnar Johanson1
1Institute of Environmental Medicine, Karolinska Institutet, Stockholm, Sweden; 2Department of Environmental Health Sciences, School of Public Health, University of Michigan, Ann Arbor, MI, USA; 3BioSimulation Consulting Inc., Newark, DE, USA; 4Department of Environmental and Occupational Health, School of Public Health, University of Montreal, QC, Canada
Abstract: To assess the potential toxicity of nanoparticles (NPs), information concerning their uptake and disposition (biokinetics) is essential. Experience with industrial chemicals and pharmaceutical drugs reveals that biokinetics can be described and predicted accurately by physiologically-based pharmacokinetic (PBPK) modeling. The nano PBPK models developed to date all concern a single type of NP. Our aim here was to extend a recent model for pegylated polyacrylamide NP in order to develop a more general PBPK model for nondegradable NPs injected intravenously into rats. The same model and physiological parameters were applied to pegylated polyacrylamide, uncoated polyacrylamide, gold, and titanium dioxide NPs, whereas NP-specific parameters were chosen on the basis of the best fit to the experimental time-courses of NP accumulation in various tissues. Our model describes the biokinetic behavior of all four types of NPs adequately, despite extensive differences in this behavior as well as in their physicochemical properties. In addition, this simulation demonstrated that the dose exerts a profound impact on the biokinetics, since saturation of the phagocytic cells at higher doses becomes a major limiting step. The fitted model parameters that were most dependent on NP type included the blood:tissue coefficients of permeability and the rate constant for phagocytic uptake. Since only four types of NPs with several differences in characteristics (dose, size, charge, shape, and surface properties) were used, the relationship between these characteristics and the NP-dependent model parameters could not be elucidated and more experimental data are required in this context. In this connection, intravenous biodistribution studies with associated PBPK analyses would provide the most insight.
Keywords: nondegradable, PBPK, intravenous administration, phagocytosis, rats, nanorods, gold, titanium dioxide, polyacrylamide, polyethylene glycol coating
Introduction
Biokinetics, that is, uptake, biodistribution, and elimination of hazardous agents, including nanoparticles (NPs) as well as xenobiotics, are key determinants of the relationship among external exposure, internal dose, and risk for adverse health effects. Historically, physiologically-based pharmacokinetic (PBPK) models have proven to accurately provide such relationships. Such models employ anatomical features and physiological values, such as the structure of the circulatory system, organ and tissue volumes, tissue partition coefficients, and tissue blood flows, to describe and predict how the substance of interest is deposited in a time-dependent manner within organs and tissues.1,2 They help predict the target dose for different species, estimate variability in populations, simulate scenarios and routes of exposure, and correlate the level of biomarkers to exposure.3–5 Another valuable aspect of PBPK models is their ability to generate hypotheses, aid in the design of biodistribution studies, and identify additional research that is needed.
Due to the differences in the sizes of molecules and NPs, the factors that determine their biokinetic profiles are also likely to differ considerably. Therefore, novel aspects need to be considered when developing PBPK models for NPs. Thus, the blood–tissue exchange of NPs tends to be diffusion-limited in contrast to the flow-limited exchange of small molecules.6 Furthermore, when NPs are injected to blood, they are rapidly taken up by phagocytic cells (PCs) in organs such as liver and spleen to an extent dependent on their size, shape, charge, coating, and state of agglomeration.7–15 All organs contain PCs, but these cells are more abundant in the mononuclear phagocyte system, where they are exposed to blood.
The number of publications describing PBPK models for NPs injected intravenously is increasing rapidly.6,10,16–28 However, a major limitation in this context is that each of these models is applicable only to a single type of NP. Moreover, the early models were similar to those for organic chemicals, that is, phagocytosis was not included, although this process is taken into account by the most recent models.10,17–28 The aim of the current investigation was to extend a model for the PBPK of NPs composed of pegylated polyacrylamide (PAA-PEG) NPs published recently in order to predict the biokinetics of any type of nondegradable NPs injected intravenously.24 The model developed by Li et al is based on the biodistribution of PAA-PEG NPs in rats following a single intravenous dose.24,29 Here, we also incorporate data concerning uncoated polyacrylamide (PAA), gold, and titanium dioxide (TiO2) NPs administered intravenously to rats.29–31
Methods
Collection of published experimental data
Experimental data on the biodistribution of NPs injected intravenously as a single dose into rats were collected from the literature. The inclusion criteria were as follows: 1) The dose and levels in organs had to be reported in comparable quantitative units, so that the amounts in organs could be calculated as a fraction of the dose. 2) The NP should neither be soluble nor degradable (which excludes, for example, silver NPs) and the NP itself or a firmly attached substance had to be monitored (excluding, eg, NPs used as carriers for soluble drugs). 3) The observation period postinjection had to be at least 24 hours, with at least four sampling times. 4) The time-course with respect to blood, liver, spleen, and at least two additional organs or tissues had to be reported. 5) The total recovery in all reported tissues/organs monitored must be at least 25% of the injected dose. Three sufficiently detailed studies, involving four types of NPs, fulfilled these criteria.29–31
Wenger et al utilized nanospheres composed of PAA, either uncoated (PAA) or coated with polyethylene glycol (PAA-PEG) and both labeled in the polymer chain with [14C] to allow quantification of the levels in urine, feces, and ten different tissues and organs.29 The diameter of the uncoated PAA as measured by dynamic light scattering was 31 nm and demonstrated a log-normal distribution, but the charge was not provided. The doses for PAA-PEG and PAA were 7 and 11 mgEq/rat, respectively, and 3–12 sampling time-points were used (Tables S1 and S2). Shinohara et al examined nanospheres of TiO2 with an average size of 63 nm (as measured by dynamic light scattering) and a Z-potential in aqueous disodium phosphate solution of −43 mV, but there is no mention of coating.31 After injection at a concentration of 0.95 mg particles per kg body weight, inductively coupled plasma with a sector field mass spectroscopy was employed to monitor the amount of TiO2 NPs in eight different tissues and organs at five different sampling times (Table S3). Wang et al investigated nanorods of gold capped with cetyltrimethylammonium bromide, 13 nm in diameter and 56 nm long (as determined by transmission electron microscopy) and with a Z-potential in saline of 29 mV.30 After injection at a concentration of 0.56 mg/kg body weight, inductively coupled plasma mass spectroscopy was employed to monitor the amount of gold in nine different tissues and organs at nine different postinjection time-points (Table S4). The characteristics of these different NPs are summarized in Table 1.
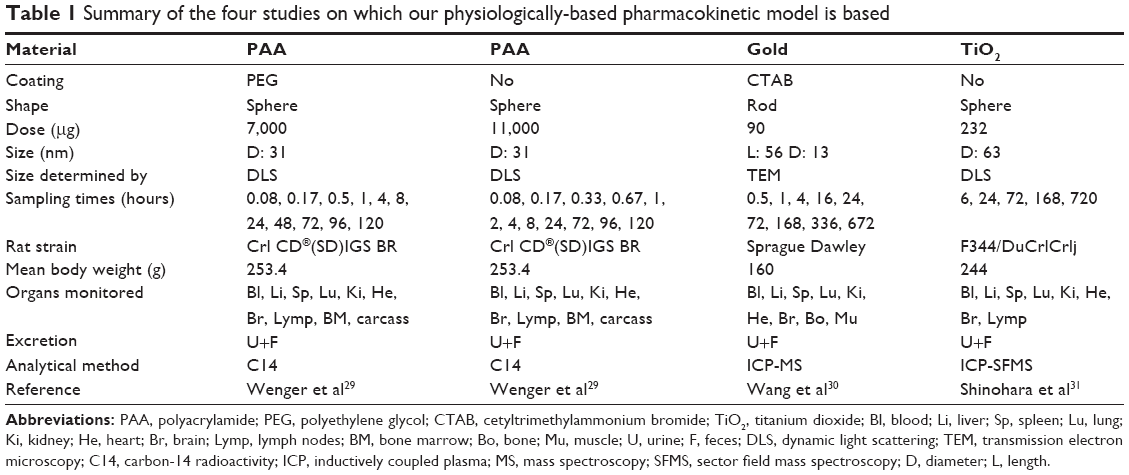 | Table 1 Summary of the four studies on which our physiologically-based pharmacokinetic model is based |
Calculation of tissue content
In the case of TiO2, the background levels in unexposed animals were subtracted from those detected in exposed animals prior to model fitting. Observations below the limit of detection were assigned a value equal to half of this limit. Where necessary, distributions were converted to mass per organ using either dose and biometric data provided in the study, when available, or, otherwise, reference values from the literature.32,33
The PBPK model
A modified version of the PBPK model developed by Li et al was applied.24 In brief, this model involves ten compartments, each divided into subcompartments of blood, tissue, and PCs (Figure 1). The physiological parameters (Table 2) were from the same as those used by Li et al.24 The following assumptions and modifications of the model were made.
 | Figure 1 Schematic illustration of our physiologically-based pharmacokinetic model. |
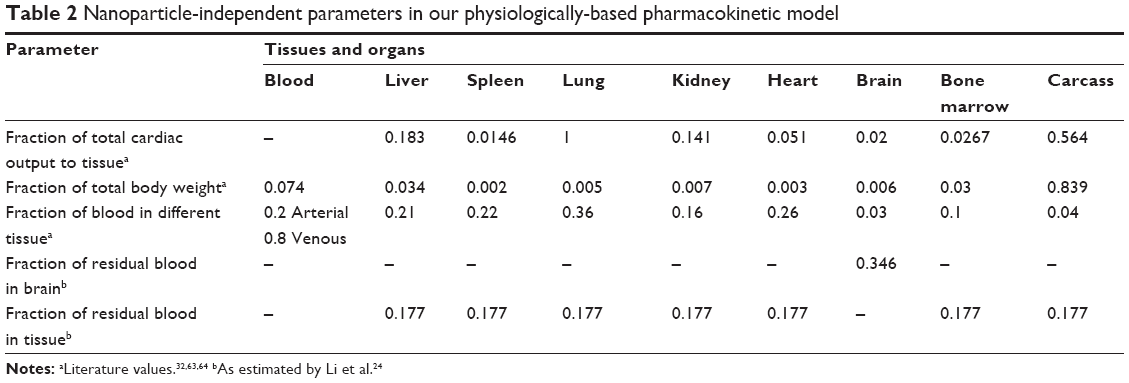 | Table 2 Nanoparticle-independent parameters in our physiologically-based pharmacokinetic model |
Since gold and TiO2 NPs have been shown to be taken up into the brain, this tissue was assigned a low permeability (coefficient of permeability from blood to brain [Xbrain]), in contrast to Li’s model.34–38
We tested three sets of blood–organ coefficients of permeability. The first set involved the same grouping as in the Li model, that is, all organs other than brain were assigned a high coefficient of permeability (Xfast) and carcass (Xrest) assumed to exhibit a medium permeability.24 In the second set, Xfast was reserved for liver and spleen, whereas bone marrow, heart, lung, and kidney were assigned Xrest. These assignments were based on the fact that the PCs in liver and spleen are in direct contact with blood to a much greater extent than those in other compartments.8,9 In the third set, in addition to liver and spleen, Xfast was also used for bone marrow, which contains sinusoidal reticuloendothelial blood capillaries with phagocytic capacity and therefore more ready access to NPs in blood.9
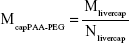
In the Li model, the maximal phagocytic capacity per gram tissue (Mtissuecap) was expressed as the product of the capacity per PC (maximal uptake capacity per phagocytic cell [Mcapi], a value that is NP-specific and tissue-independent) and the number of PCs per gram tissue (Ntissue, NP-independent, tissue-dependent), resulting in one additional parameter (Mcapi) for each of the four different types of NP.24 Here, the initial value of McapPAA-PEG (prior to reoptimization) was calculated utilizing the uptake capacity in liver (Mlivercap) reported by Li et al and the number of PCs per gram liver (Nliver) described by Alpini et al, according to Equation 1:24,39
|
|
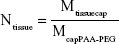
The initial Ntissue values for the other tissues were then calculated by dividing Li’s (Mtissuecap) values by this with McapPAA-PEG (Equation 2):
|
|
The physiological parameters (organ weights, fraction of blood in organs, and fractional blood flow to organs) for the PBPK model were calculated by normalizing the rat values provided by Brown et al to the mean body weights of the animal used in the individual studies.32 In their study on gold nanorods, Wang et al did not report body weights and, moreover, their rats were 4 weeks of age at the start and 8 weeks at the end of the experiment.30 Since our model does not take growth into account, we assumed that these rats weighed the same as 6-week-old animals according to Mirfazaelian et al.40
In analyzing the feces, a time delay was added to account for the transit time in the gastrointestinal tract. This delay was set to 8 hours for the PAA-PEG and PAA NPs and 4 hours for the gold nanorods on the basis of observations by Wenger et al and Wang et al, respectively.29,30 Fecal and urinary excretion of the TiO2 NPs were set to zero, in accordance with the observations by Shinohara et al.31
Optimization of the model
Prior to formal estimation of the parameters, optimization was performed for PAA, gold, and TiO2 NPs by visual comparison with the experimental data in order to identify plausible initial conditions. In the case of PAA-PEG, the parameters reported by Li et al were used as the initial values.24 The model was then run simultaneously with the data sets for all four NPs employing the same number of PCs in each tissue, Ntissue, in all four cases. The NP-specific parameters optimized were as follows: the clearance to feces (rate of clearance in feces [CLf]) and urine (rate of clearance in urine [CLu]), the rates of uptake by PCs in the spleen (rate constant for uptake by PCs in the spleen [ksab0]) and other organs (rate constant for uptake by PCs [kab0]), the blood:tissue partition coefficient (P), maximal uptake per PC (Mcapi), and the three coefficients for permeability between blood and tissues (Xfast, Xrest, and Xbrain).
Curve fitting was performed with the acslX Libero™ software (v. 3.0.2.1, The AEgis Technologies Group, Inc., Orlando, Florida) utilizing the CVODE algorithm. The use of the Nedler Mead procedure for optimization proved to be most stable and provided the best overall fit of the various approaches in this software. Different weights (acslX Libero™ heteroscedasticity parameters 0, 1, and 2) were tested in the least square regressions to take into account the heteroscedastic nature of the data. Based on visual inspection of time-courses and information on log likelihood values, the weighting was set to 1 for all four NPs.
Sensitivity analyses
To identify the most influential model parameters, local sensitivity analyses were performed in the acslX Libero™ and Berkeley Madonna™ software with the fourth order Runge–Kutta integration algorithm. Normalized (relative) sensitivity coefficients (SAs) were calculated for all parameters (p) and compartments as shown in Equation 3:
|
|
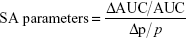
where AUC is the area under the mass–time curve in the compartment, with ΔAUC reflecting the change associated with a 1% change in p (Δp/p=0.01). These SAs were calculated 10 hours after injection, as well as at the last postinjection time-point analyzed (Tables 3 and S5–S8).
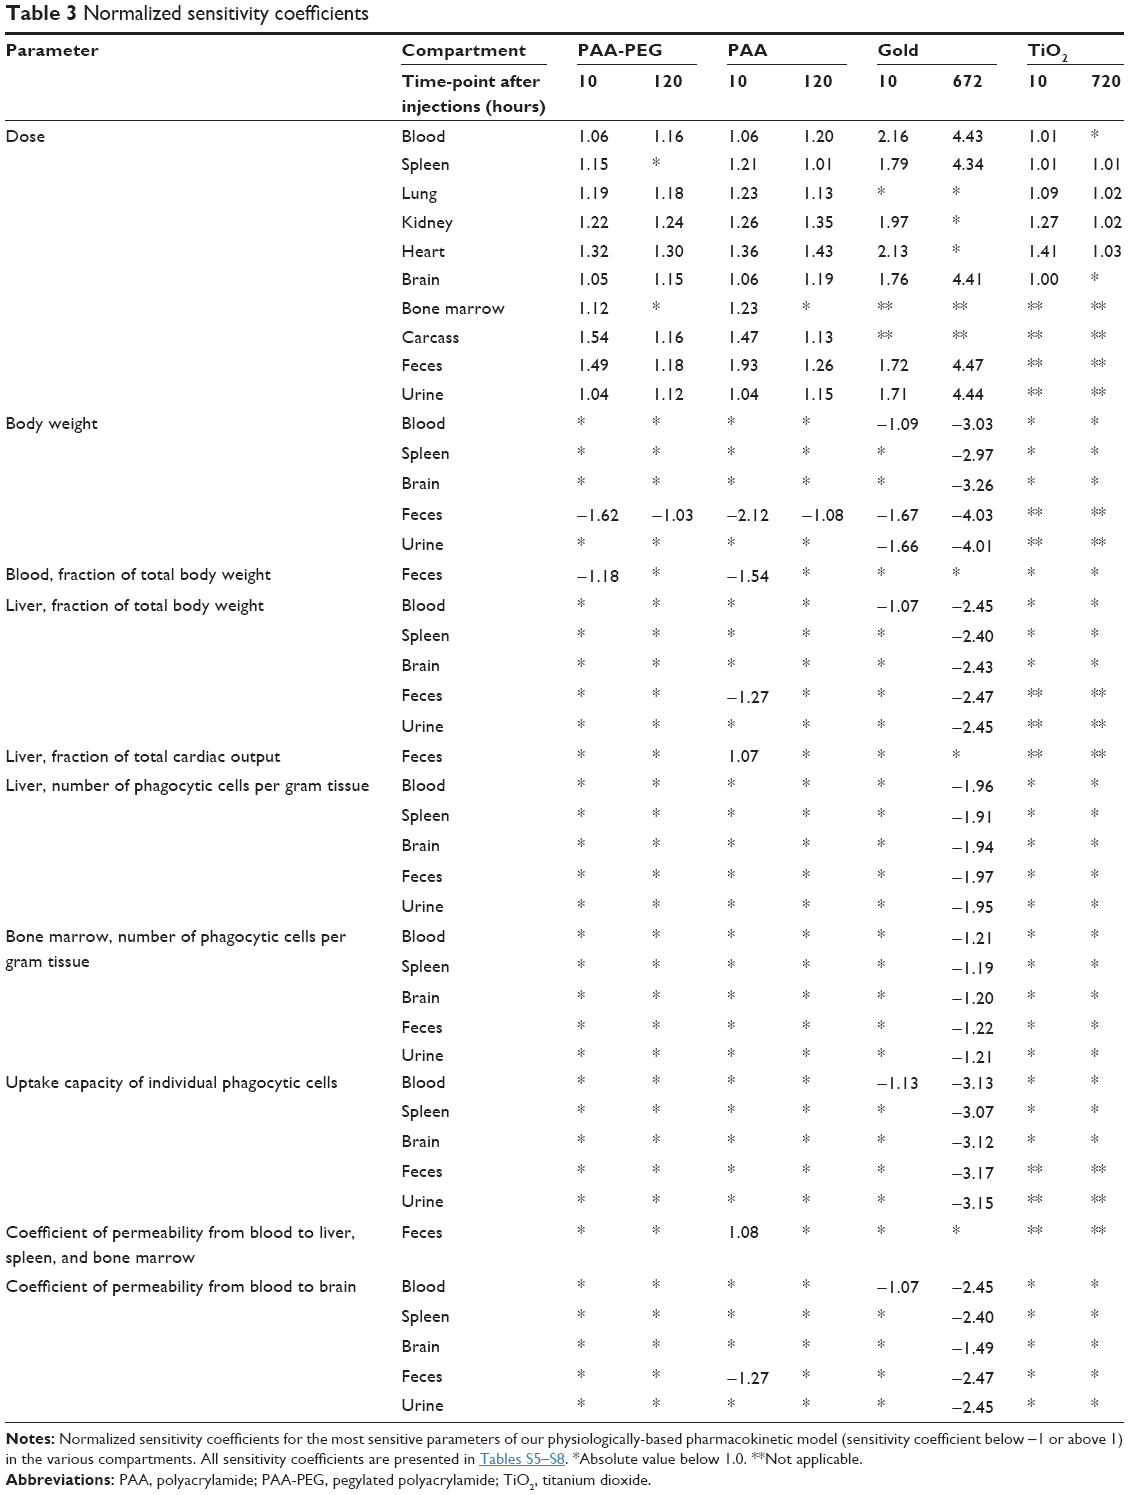 | Table 3 Normalized sensitivity coefficients |
Goodness of fit
The goodness of fit was optimized by visual comparison of the experimental and predicted time-courses for the amounts of NP in the various tissues (Figures 2–5 and Figures S1–S4). This assessment was followed by determination of the goodness of fit for all experimental and predicted data points (Table 4) by comparing log likelihood values (acslX Libero™), R2 values (linear regression analyses of log values), and PBPK indices (using log values).41
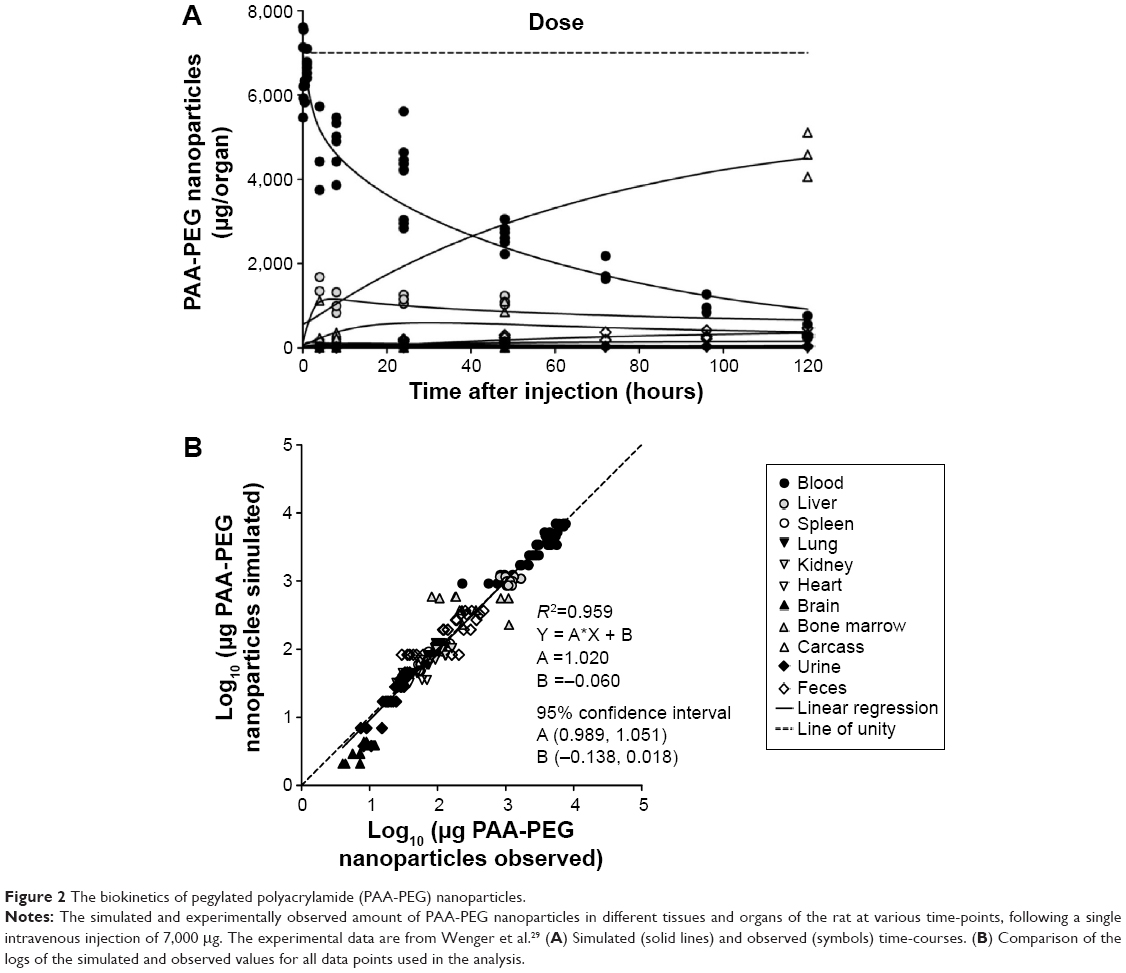 | Figure 2 The biokinetics of pegylated polyacrylamide (PAA-PEG) nanoparticles. |
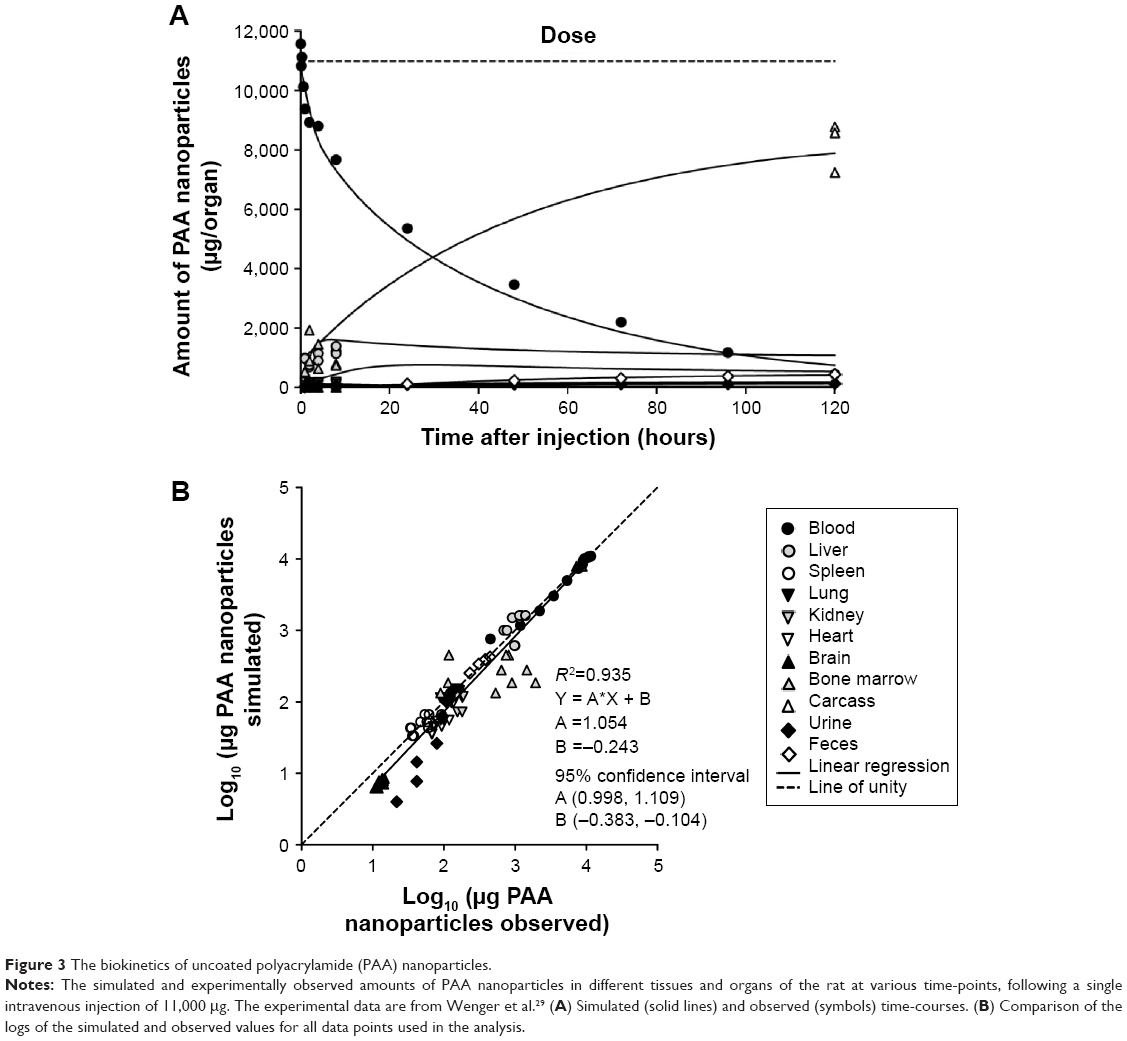 | Figure 3 The biokinetics of uncoated polyacrylamide (PAA) nanoparticles. |
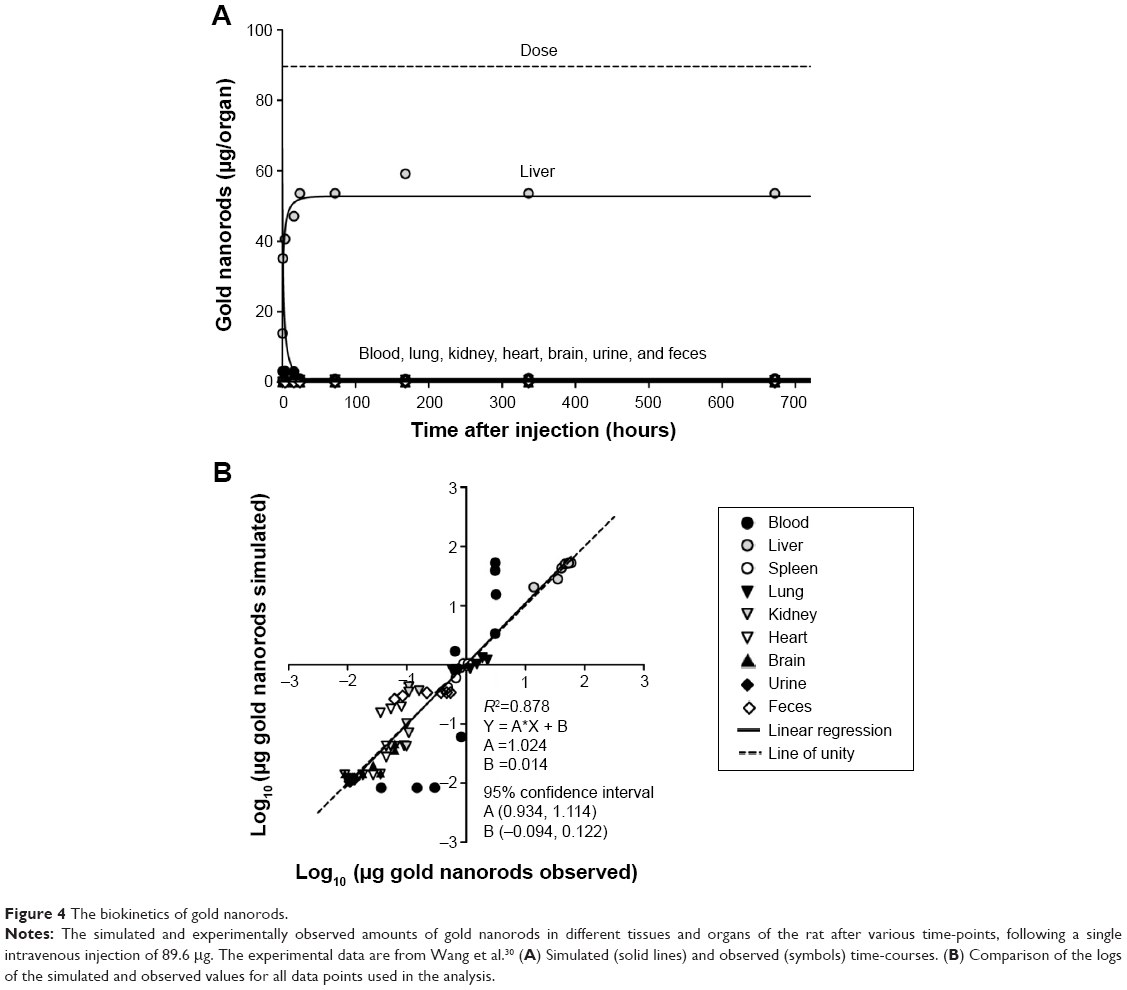 | Figure 4 The biokinetics of gold nanorods. |
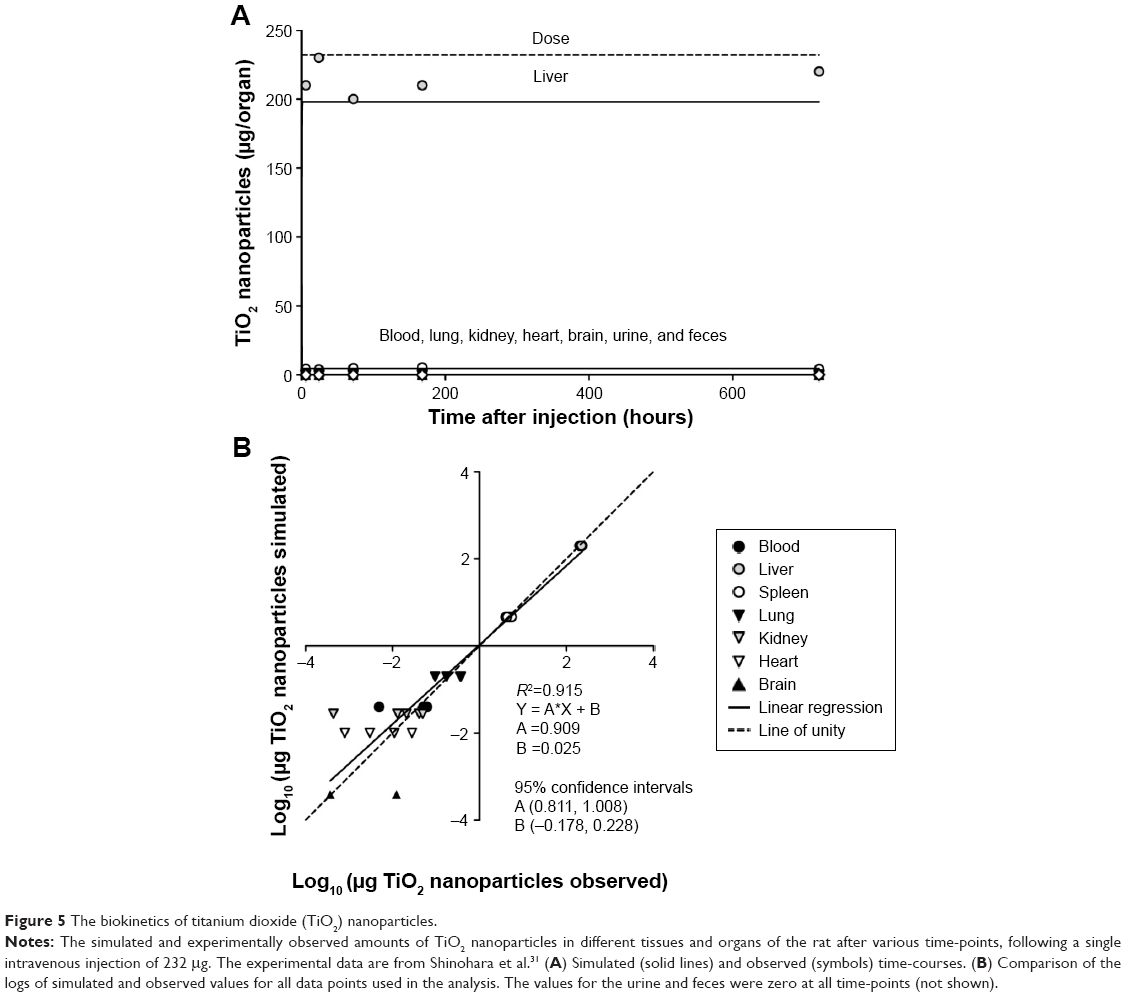 | Figure 5 The biokinetics of titanium dioxide (TiO2) nanoparticles. |
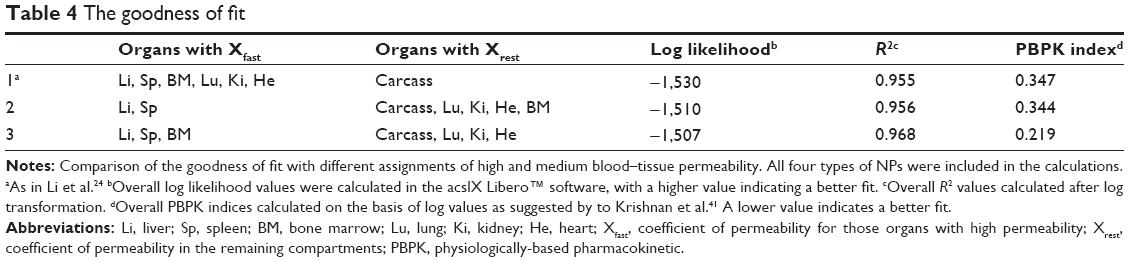 | Table 4 The goodness of fit |
Results
To investigate potential differences in the biokinetic profiles of PAA-PEG, PAA, gold, and TiO2 NPs, we applied our modified PBPK model to test three sets of blood–organ coefficients of permeability (see “Methods” section, Table 2, and Figure 1).24 Based on the goodness of fit (the highest R2, lowest log-likelihood value, and lowest PBPK index value, Table 4), the third, that is, the one involving a high coefficient of permeability (Xfast) for liver, spleen, and bone marrow was selected for use.
Adjustment of the NP-specific parameters allowed the model to describe the biokinetic behavior of all four types of NP, despite their widely different physicochemical properties and biokinetic profiles (Figures 2–5 and Figures S1–S4). Accordingly, linear regression analysis revealed good correlations between the predicted and observed amounts (log10 values) in various tissues in all four cases (R2 for PAA-PEG was 0.96, for PAA 0.94, for gold 0.88, and for TiO2 0.91), with slopes and intercepts close to unity and zero, respectively.
PAA-PEG NPs
There was good agreement between the simulated and observed amounts of PAA-PEG NPs in all organs except bone marrow, for which the moderate fit probably reflected the extensive variability in the data observed (Figures 2 and S1). Furthermore, the shapes of the fitted time-courses were almost identical to those of Li et al, which together with our parameter values (with a few exceptions), suggest that our slight modifications exert only a minor impact on the modeled behavior of PAA-PEG NPs.24
Our reoptimized parameter values for PAA-PEG NPs were comparable to those originally reported by Li et al, with the exceptions of clearance in the urine and the numbers of PCs per gram blood, lung, kidney, and heart (Tables 5 and 6 and Table S9).24 Although the clearance in urine was twofold lower here, urinary excretion is minor and the amount of PAA-PEG in blood was only marginally affected. The numbers of PCs per gram tissue here are eightfold lower in the case of blood, threefold lower for lung, fourfold lower for kidney, and 24-fold lower in the case of heart.24 These differences reflect optimization against a richer set of data, that is, four rather than one type of NP.24 Thus, these changes are primarily a result of the data driven by the gold and TiO2 NPs (with normalized SAs of as much as 0.99 and 0.46, respectively), whereas the biokinetic profiles of PAA-PEG and PAA are insensitive (normalized SAs of as much as 0.13 and 0.26, respectively) (Tables S5–S8).
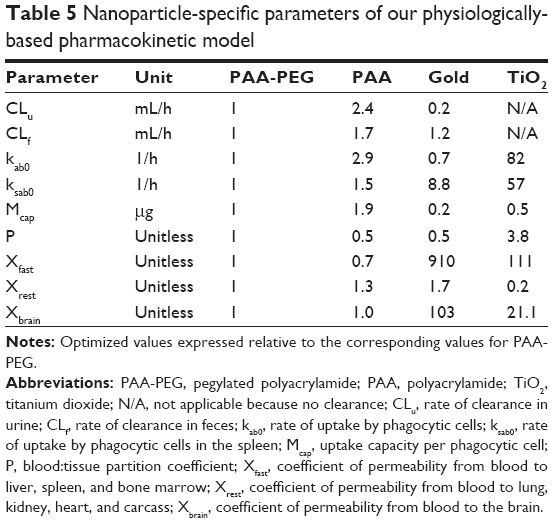 | Table 5 Nanoparticle-specific parameters of our physiologically-based pharmacokinetic model |
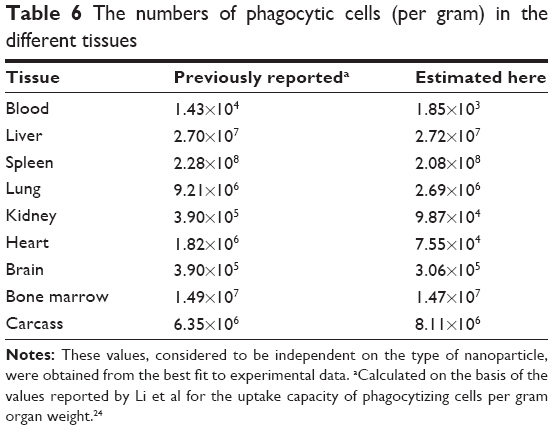 | Table 6 The numbers of phagocytic cells (per gram) in the different tissues |
The PCs in lung, kidney, and heart became saturated with PAA-PEG NPs (Figure 6 and dotted curves in Figure S1), within less than 0.5 hours, whereas for other organs with higher capacity for uptake and/or lower blood flow, saturation process took longer – approximately 3 hours in liver, 9 hours in bone marrow, and 110 hours in carcass, and splenic PCs were not saturated even 120 hours after injection. At the end of the follow-up period, the simulated amount of PAA-PEG present in PCs was 71% of the dose injected (Table S10).
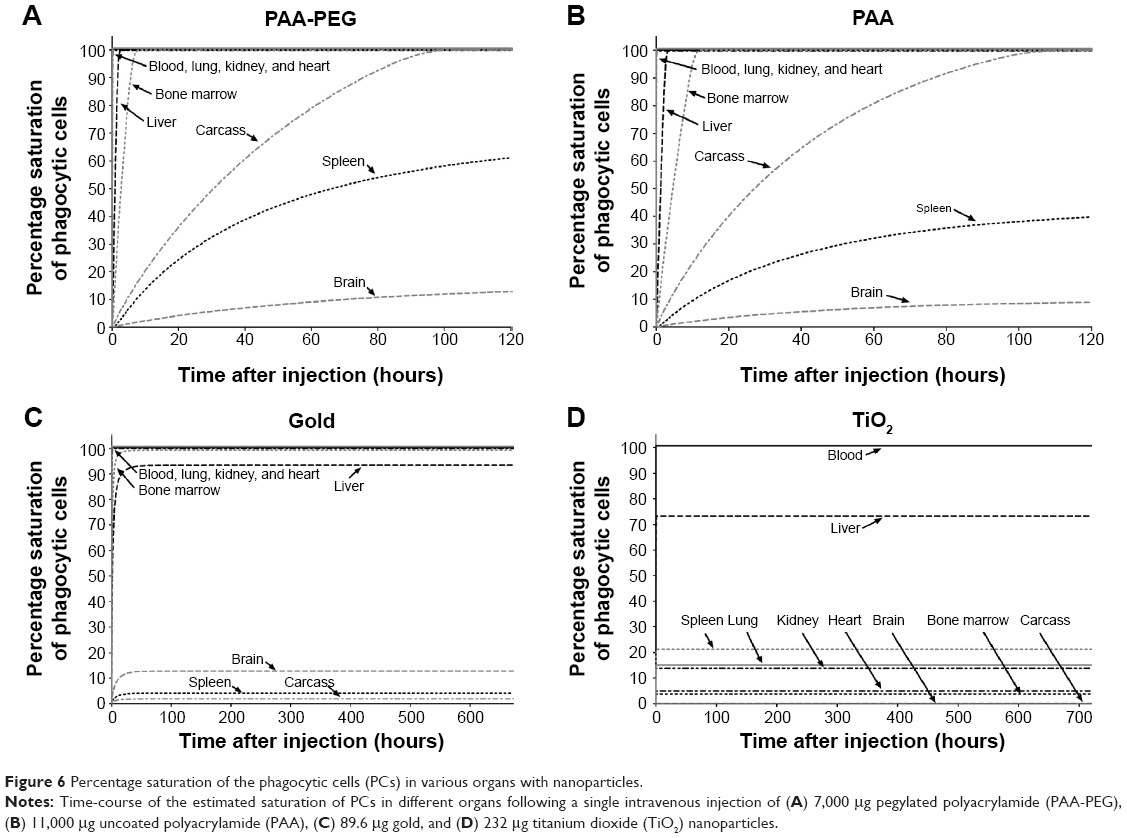 | Figure 6 Percentage saturation of the phagocytic cells (PCs) in various organs with nanoparticles. |
NPs of uncoated PAA
In general, agreement between the observed and simulated biodistribution of uncoated PAA NPs was good or reasonable for all compartments, except urine and bone marrow (Figures 3 and S2). In the case of urine (Figure S2J), the model did not predict the rapid initial clearance observed, which as discussed by Wenger et al may be due to renal glomerular filtration of smaller NPs.29 The extensive variability in values observed for bone marrow (Figure S2H), as also seen with the PAA-PEG NPs, precluded comparisons with the simulated values.
The sensitivity analysis (Tables 3 and S6) indicated that the time-courses for most tissues were relatively insensitive to alterations in the model parameters. The only exceptions (defined as exhibiting a normalized SA below −1.5 or above 1.5) were the dose, body weight, and weight of blood, which affected fecal excretion at 10 hours only (Table 3).
With respect to NP-specific parameters (Tables 5 and S9), the maximal phagocytic capacity (McapPAA) and urinary (CLu) and fecal (CLf) clearances were approximately doubled, while the rate of phagocytic uptake in the spleen (ksab0) was 1.5-fold higher and that in other organs 2.9-fold higher (kab0), than with PAA-PEG. Furthermore, urinary clearance (CLu) was twice as rapid. In contrast, P was only 50% of the corresponding value for PAA-PEG. These changes were reflected in a more rapid decline in blood levels (initial halftime of 19 versus 22 hours for PAA-PEG), lower level in blood at 120 hours after injection, and more extensive urinary and fecal excretion.
In general, the time-courses for the phagocytosis of PAA (Figures 6 and S2) and PAA-PEG NPs (Figures 6 and S1) were similar. Accordingly, the PCs in lung, kidney, and heart became rapidly saturated with both PAA and PAA-PEG NPs, whereas this process took longer time for organs with a high capacity for uptake of NPs and/or relatively low blood flow, that is, liver, spleen, bone marrow, and carcass. As in the case of PAA-PEG, most of the dose of PAA injected was localized in PCs at the end of the follow-up period (71% versus 84% for PAA) (Table S10).
Gold nanorods
The biokinetic profiles of the gold nanorods (Figures 4 and S3) differed considerably from those of PAA and PAA-PEG, but showed reasonable agreement with values reported by Wang et al for most organs, as indicated by an overall R2 value of 0.878 (Figure 4B).30 The deviations were underestimation of the amount in blood and kidney (Figure S3A and E) and overestimation of that in heart (Figure S3F).
The sensitivity analyses (Tables 3 and S7) indicated that the amounts in the different compartments were influenced by several parameters, especially at the end of the 672 hours of observation. The most influential parameter was the dose (normalized SAs of 1.5–4.5 for several compartments).
The NP-specific parameters for the gold nanorods deviated strongly from those obtained for PAA-PEG and PAA NPs (Tables 5 and S9). Thus, urinary clearance (CLu), the rate of uptake (kab0), and maximal uptake (McapGold) by PCs were all attenuated, whereas the rate of uptake by splenic PCs (ksab0) and the coefficients of permeability were substantially higher, more than 100-fold in the case of Xfast and Xbrain.
As with PAA-PEG and PAA NPs, the gold nanorods were distributed to organs and phagocytized, but the changes in model parameters resulted in pronounced differences in biodistribution (Figure 6, Table S11, and Figures S1–S3). Thus, the gold nanorods were distributed more extensively to liver (59% of the injected dose) and bone marrow (30% of the injected dose) and less so to carcass (8.7% of the injected dose). Due to their much lower dose compared to those of other NPs, virtually all of the nanorods (99.6%) were phagocytized (Table S10). Moreover, both the model and experimental observations revealed a very rapid initial drop in blood levels.
Titanium dioxide
In general, agreement between the observed and simulated time-courses for the accumulation of TiO2 in the various organs was reasonable (Figures 5 and S4). However, as in the case of the gold nanorods, our model did not adequately describe the slow long-term decrease in organs containing relatively low amounts of TiO2 such as lung and kidney. The sensitivity analysis (Tables 3 and S8) did not indicate any pronounced sensitivity, with no normalized SAs below −1.5 or above +1.5.
Most of the NP-specific parameters for TiO2 NPs were dramatically different from corresponding values for PAA-PEG (Tables 5 and S9). Thus, the rates of uptake (kab0 and ksab0) and the permeability of liver, spleen, and bone marrow (Xfast) and brain (Xbrain) were 20–110-fold higher, whereas the maximal phagocytic capacity (McapTiO2) and permeability of lung, kidney, heart, and carcass (Xrest) were ~2–5-fold lower. In addition, the partition coefficient rose fourfold. Furthermore, there was no urinary (CLu) or fecal (CLf) clearance.
The changes in model parameters were due to rapid distribution from blood into tissue compartments and negligible urinary and fecal excretion. The model indicated that within 3 hours after injection, the simulated amount of TiO2 NPs in liver approached its maximum (86% of the total dose injected) (Figures 5 and S4B). Initial disappearance from blood occurred with a halftime of 6 minutes, that is, ~200-fold more rapidly than in the case of PAA-PEG NPs. Because of the low dose administered, the PCs in most organs were far from saturated with TiO2 NPs (Figure 6). Moreover, the biokinetic profile was similar to that of gold nanorods, with most pronounced accumulation in liver followed by bone marrow (Figures 6, S4, and Table S11), and 100% of the dose injected rapidly being taken up by PCs and retained throughout the observation period (Figure 6 and Table S10).
Discussion
A further development of a model initially optimized for PAA-PEG NPs, our PBPK model accurately describes the biokinetic profiles of four different types of NPs, despite differences in composition (PAA-PEG, PAA, gold, and TiO2), dose, and size, as indicated by good correlations between the simulated and observed amounts in most of the organs and tissues investigated (Figures 2–4). This suggests that our model can also describe the biokinetics of other nondegradable NPs injected intravenously. The large differences in certain parameters (discussed further below) indicate that these biokinetics are highly dependent on properties of the NPs, as shown in numerous experimental studies.7,16,42 A better understanding of the relationship between biokinetic parameters and NP properties requires experiments involving different doses and properties such as size, size distribution, charge, shape, agglomeration, and surface characteristics.
An important aspect of our model is uptake of NPs by PCs and subsequent saturation of these cells. NPs injected into the bloodstream are taken up by PCs, especially those located in the organs of the mononuclear phagocyte system, such as liver, spleen, and bone marrow.7–9 Our model confirms this pattern.
In addition, high intravenous doses of NPs are known to saturate liver and thereby modify biokinetics.43,44 When liver becomes saturated, NPs are taken up by other organs, such as kidneys, bone marrow, and lungs instead, as indicated by our simulations on PAA-PEG and PAA NPs.
In terms of mass, the doses of PAA-PEG and PAA NPs employed were 30–123-fold higher than those of gold and TiO2 and in terms of NP number or total surface area, 1,300–2,400-fold higher (Table S12). The doses of gold and TiO2 NPs were too low to saturate the hepatic PCs, as a result of which most of these NPs were captured by liver.
In summary, the widely different biokinetic profiles of our four different types of NPs can be described well by incorporating saturable phagocytosis into the model. One consequence of this saturable process is that the biokinetic profile may shift as the dose increases (Figure 7). This hypothesis should be tested in experiments involving different doses of one type of NP.
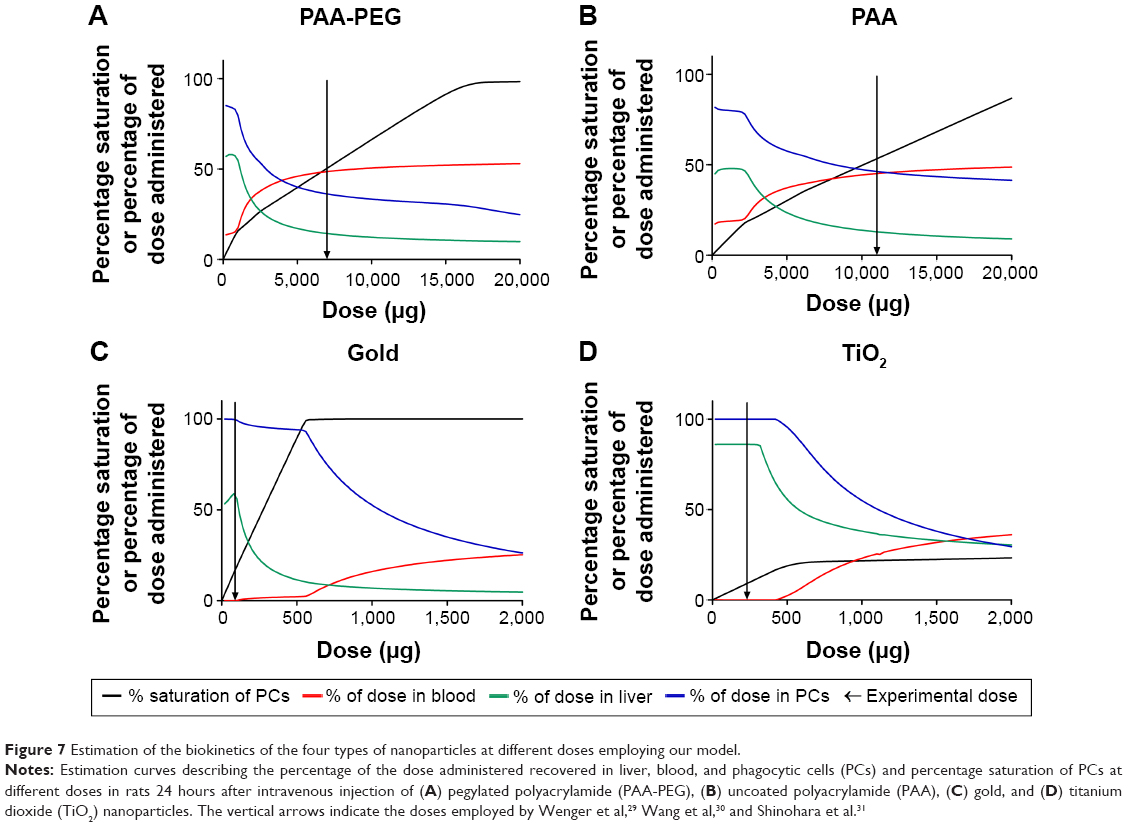 | Figure 7 Estimation of the biokinetics of the four types of nanoparticles at different doses employing our model. |
Our model assumes that all PCs behave in the same manner, whereas in reality, PCs are quite heterogeneous and may differ substantially among organs, species, and conditions of health.45 A second potential oversimplification is our assumption of a single mechanism for phagocytosis of NPs, although several endocytotic pathways exist and in vitro uptake capacity varies among PCs and endocytosis depends on the properties of the NPs, as well as the corona formation.46–50
Maximal phagocytic uptake is often reported either as the number or amount of NPs per phagocyte. In spite of our simplifications, the maximal uptake capacities of 2,000–300,000 NPs or 0.4–5 pg per PC estimated by our model are in the same range as those observed in vitro (Table S13). For example, Alkilany and Murphy reported an uptake of 45–150,000 gold NPs per cell and Ferrari et al detected 100–10,000,000 polymeric NPs per 4T1 cell, depending on the cell line, composition, size, charge, coating, and dose of the NPs.51,52 Although the nano PBPK models developed by Bachler et al and Lin et al also incorporate phagocytosis, their findings cannot be readily compared to our own because of major differences in the organs monitored, organs with/without PCs, PC saturation, translocation from blood to PCs (serial/parallel), blood:tissue partitioning, and so on.23,25,28
Several models for cellular NP uptake in vitro have been proposed, some of which suggest that the NPs are adsorbed to the cell surface prior to endocytosis.16,46–48 According to these models, the rate of this is faster than the rate of endocytosis, which depends on the accessibility and recirculation of appropriate receptors. Reported rates of endocytosis vary by more than three orders of magnitude and, in addition, adsorption can occur more than three orders of magnitude more rapidly than endocytosis itself.53
Our simulations suggest a 100-fold difference in the rate of phagocytic uptake, with gold and TiO2 NPs representing the extremes. Our estimated rate for phagocytic uptake of gold nanorods is approximately four orders of magnitude higher than the rate of endocytosis and approximately twofold lower than the rate of adsorption, reported by Jin et al, for 50 nm gold NPs.53 As in the case of maximal phagocytic capacity, our present estimates cannot readily be compared with those obtained from other nano PBPK models.
Here, the uptake rate was independent of time and became slower and slower as the PCs become saturated. In contrast, the model developed by Lin et al describes the rate of uptake as a function of time with the Hill equation.25 On the other hand, the model developed by Bachler et al employs an uptake rate that is independent of both time and concentration, that is, with no saturation of the PCs.23,28
The slower uptake for PAA-PEG than PAA into PCs was expected since the polyethylene glycol coating reduces the attachment of proteins and formation of corona, thereby attenuating and delaying recognition and uptake.7,54 Corona formation, which is, complex and dynamic, may affect phagocytosis and partitioning, and consequently biodistribution.55–57 Such dynamic changes are not taken into account by any nano PBPK model of which we are aware, including our own. However, several investigators have emphasized the importance of corona dynamics and this aspect of modeling needs to be explored further, especially in relationship to alterations in NP partitioning between blood and tissues and the rate of phagocytic uptake with time.21,23,57
The incorporation of partition coefficients (sometimes referred to as distribution coefficients) into our model can be questioned since, in contrast to small, nonionized molecules, NPs form thermodynamically unstable, nonheterogenous suspensions so that partitioning equilibrium may not be attained.58 Thus, NPs tend to agglomerate/aggregate, conditions in the body may cause a corona to change with time, and most preparations contain NPs with a range of sizes.55–57 Accordingly, partition coefficients, like any other NP-specific model parameter, represent averages that together hopefully yield the most accurate prediction of average NP biokinetic behavior.
Utilization of average or “lumped” model parameters is hardly unique to nano PBPK models. For example, such models for lipophilic chemicals routinely consider fat as a single compartment, in spite of the well-known fact that the various fat depots differ with respect to vascular perfusion.59 In any case, most, if not all, investigators incorporate partition coefficients into their nano PBPK models.10,17–22,24–27 Here, we found that at least in the case of PAA-PEG, PAA, and gold NPs, the biokinetics cannot be accurately described without introducing a P factor and a similar conclusion was reached by Lin et al.25
The exchange of NPs between blood and organs is strongly influenced by the ability to cross the endothelium. This endothelial permeability varies between organs as a result of differences in the degree of fenestration, as well as phagocytic capacity. Moreover, liver and bone marrow contain a special type of sinusoidal reticuloendothelial capillaries with open pores and phagocytic properties that allow easier access for circulating NPs.9
To account for such differences, we grouped the organ compartments into three sets with high permeability (Xfast), medium (Xrest), or low permeability of the blood–brain barrier (Xbrain). We tested three likely groupings, and the third of these exhibited the best goodness of fit, that is, high permeability for liver, spleen, and bone marrow; medium permeability for the rest of organs except the brain; and low permeability for the brain (Table 4). This grouping appears appropriate from an anatomical point of view as well because of those sinusoidal reticuloendothelial capillaries in liver and bone marrow and the fact that endothelial PCs in liver and spleen are in direct contact with blood.
Obviously, the permeability of NPs depends not only on endothelial structure, but also on their properties, including size, shape, surface coating, and degree of agglomeration.60–62 Indeed, the varying coefficients of permeability obtained for our four types of NPs may reflect such differences. A better understanding of the relationship between the properties of NPs and endothelial permeability is clearly needed. Such insight might be obtained from systematic biodistribution studies on different NPs performed in vivo and/or with isolated, perfused organs.
Since gold and TiO2 NPs are known to be taken up into the brain, we modified Li’s model to allow such translocation.24,30–38 This modification exerted only a limited impact on the biokinetics of PAA-PEG and PAA NPs since most of these NPs in the brain were in residual blood. However, in contrast, the amounts of gold and TiO2 NPs in the brain cannot be explained by differences in the content of residual blood, which lends support to a permeability greater than zero.
The local sensitivity analyses revealed substantial differences between the four types of NPs with respect to sensitivity to the model parameters due to differences in dose that resulted in varying degrees of PC saturation. For example, the PCs in all tissues except the spleen and carcass rapidly become saturated with PAA and PAA-PEG NPs and, furthermore, carcass contains large amounts of PCs. As a consequence, the parameters to which the NPs are most sensitive are those that determine the tissue partitioning and accumulation in carcass.
Extension of the PBPK model to gold and TiO2 NPs revealed some novel insights on biokinetic behavior, especially since these were followed-up for a longer period after injection (gold 672 hours, TiO2 720 hours) than was the case for the PAA and PAA-PEG NPs (120 hours). Thus, the amounts of gold and TiO2 NPs observed in organs with low contents, such as lung and kidney, decreased slowly with time, which the model failed to predict. This indicates the occurrence of additional processes, such as degradation, dissolution, or removal via the lymphatic system, that are not presently included in any PBPK model for nondegradable NPs published, including our own. To more accurately take such processes into consideration, longer follow-up times are required.
Conclusion
Our present simulations indicate that a slightly modified version of the nano PBPK model developed by Li et al for PAA-PEG also accurately describes the biokinetics of other nondegradable NPs injected intravenously, an advantageous advance for risk assessment.24 On the basis of these simulations, we conclude that phagocytosis must be incorporated into nano PBPK models, dose exerts a profound impact on the biokinetics, and additional information concerning the permeability of NPs in different organs is required. To enhance our understanding of the relationship between the properties and biokinetics of NPs, intravenous biodistribution studies with associated PBPK analyses are also necessary. Such studies should preferably involve: 1) extensive characterization of the NPs (size, size distribution, integrity, etc), 2) monitoring of several organs at several time-points, 3) frequent sampling immediately after dosing, 4) long follow-ups, 5) determination of the mass balance (total recovery), and 6) a detailed description of the analytical procedures employed (specificity, limits of detection, background levels, etc).
Acknowledgments
We would like to thank Professor Joseph W DePierre for his support with linguistic improvements. The study was financed by the Swedish Research Council for Health, Working Life and Welfare (Forte, grant No 2010-0702), Sweden, the NANoREG project of the European Union Seventh Framework Programme (grant No 310584), and the US Environmental Protection Agency under EPA STAR Program (grant No RD-83486001).
Author contributions
All authors contributed toward data analysis, drafting and critically revising the paper and agree to be accountable for all aspects of the work.
Disclosure
The authors report no conflicts of interest in this work.
References
Johanson G. Modeling of disposition. In: Charlene A, McQueen A, editors. Comprehensive Toxicology, Vol. 2. Oxford: Oxford Academic Press; 2014. | ||
Krishnan K, Andersen ME. Quantitative Modeling in Toxicology. 1st ed. New Jersey: John Wiley & Sons Ltd; 2010. | ||
Mork AK, Johanson G. Chemical-specific adjustment factors for intraspecies variability of acetone toxicokinetics using a probabilistic approach. Toxicol Sci. 2010;116(1):336–348. | ||
Andersen ME, Clewell HJ 3rd, Gargas ML, Smith FA, Reitz RH. Physiologically based pharmacokinetics and the risk assessment process for methylene chloride. Toxicol Appl Pharmacol. 1987;87(2):185–205. | ||
Verner MA, McDougall R, Johanson G. Using population physiologically based pharmacokinetic modeling to determine optimal sampling times and to interpret biological exposure markers: the example of occupational exposure to styrene. Toxicol Lett. 2012;213(2):299–304. | ||
Li M, Al-Jamal KT, Kostarelos K, Reineke J. Physiologically based pharmacokinetic modeling of nanoparticles. ACS Nano. 2010;4(11):6303–6317. | ||
Owens DE 3rd, Peppas NA. Opsonization, biodistribution, and pharmacokinetics of polymeric nanoparticles. Int J Pharm. 2006;307(1):93–102. | ||
Saba TM. Physiology and physiopathology of the reticuloendothelial system. Arch Intern Med. 1970;126(6):1031–1052. | ||
Sarin H. Physiologic upper limits of pore size of different blood capillary types and another perspective on the dual pore theory of microvascular permeability. J Angiogenes Res. 2010;2:14. | ||
Lankveld DP, Oomen AG, Krystek P, et al. The kinetics of the tissue distribution of silver nanoparticles of different sizes. Biomaterials. 2010;31(32):8350–8361. | ||
Balogh L, Nigavekar SS, Nair BM, et al. Significant effect of size on the in vivo biodistribution of gold composite nanodevices in mouse tumor models. Nanomedicine. 2007;3(4):281–296. | ||
Huang X, Li L, Liu T, et al. The shape effect of mesoporous silica nanoparticles on biodistribution, clearance, and biocompatibility in vivo. ACS Nano. 2011;5(7):5390–5399. | ||
Hirn S, Semmler-Behnke M, Schleh C, et al. Particle size-dependent and surface charge-dependent biodistribution of gold nanoparticles after intravenous administration. Eur J Pharm Biopharm. 2011;77(3):407–416. | ||
Niidome T, Yamagata M, Okamoto Y, et al. PEG-modified gold nanorods with a stealth character for in vivo applications. J Control Release. 2006;114(3):343–347. | ||
Keene AM, Peters D, Rouse R, Stewart S, Rosen ET, Tyner KM. Tissue and cellular distribution of gold nanoparticles varies based on aggregation/agglomeration status. Nanomedicine(Lond). 2012;7(2):199–209. | ||
Lin Z, Monteiro-Riviere NA, Riviere JE. Pharmacokinetics of metallic nanoparticles. Wiley Interdiscip Rev Nanomed Nanobiotechnol. 2015;7(2):189–217. | ||
Fallon MS, Varshney M, Dennis DM, Chauhan A. A physiologically-based pharmacokinetic model of drug detoxification by nanoparticles. J Pharmacokinet Pharmacodyn. 2004;31(5):381–400. | ||
Lin P, Chen JW, Chang LW, et al. Computational and ultrastructural toxicology of a nanoparticle, Quantum Dot 705, in mice. Environ Sci Technol. 2008;42(16):6264–6270. | ||
Lee HA, Leavens TL, Mason SE, Monteiro-Riviere NA, Riviere JE. Comparison of quantum dot biodistribution with a blood-flow-limited physiologically based pharmacokinetic model. Nano Lett. 2009;9(2):794–799. | ||
Opitz AW, Wickstrom E, Thakur ML, Wagner NJ. Physiologically based pharmacokinetics of molecular imaging nanoparticles for mRNA detection determined in tumor-bearing mice. Oligonucleotides. 2010;20(3):117–125. | ||
Mager DE, Mody V, Xu C, et al. Physiologically based pharmacokinetic model for composite nanodevices: effect of charge and size on in vivo disposition. Pharm Res. 2012;29(9):2534–2542. | ||
Li M, Panagi Z, Avgoustakis K, Reineke J. Physiologically based pharmacokinetic modeling of PLGA nanoparticles with varied mPEG content. Int J Nanomedicine. 2012;7:1345–1356. | ||
Bachler G, von Goetz N, Hungerbuhler K. A physiologically based pharmacokinetic model for ionic silver and silver nanoparticles. Int J Nanomedicine. 2013;8:3365–3382. | ||
Li D, Johanson G, Emond C, Carlander U, Philbert M, Jolliet O. Physiologically based pharmacokinetic modeling of polyethylene glycol-coated polyacrylamide nanoparticles in rats. Nanotoxicology. 2014;8(S1):128–137. | ||
Lin Z, Monteiro-Riviere NA, Riviere JE. A physiologically based pharmacokinetic model for polyethylene glycol-coated gold nanoparticles of different sizes in adult mice. Nanotoxicology. 2015:1–11. | ||
Elgrabli D, Beaudouin R, Jbilou N, et al. Biodistribution and clearance of TiO2 nanoparticles in rats after intravenous injection. PLoS One. 2015;10(4):e0124490. | ||
Gilkey MJ, Krishnan V, Scheetz L, Jia X, Rajasekaran AK, Dhurjati PS. Physiologically based pharmacokinetic modeling of fluorescently labeled block copolymer nanoparticles for controlled drug delivery in leukemia therapy. CPT Pharmacometrics Syst Pharmacol. 2015;4(3): e00013. | ||
Bachler G, von Goetz N, Hungerbuhler K. Using physiologically based pharmacokinetic (PBPK) modeling for dietary risk assessment of titanium dioxide (TiO2) nanoparticles. Nanotoxicology. 2015;9(3):373–380. | ||
Wenger Y, Schneider RJ 2nd, Reddy GR, Kopelman R, Jolliet O, Philbert MA. Tissue distribution and pharmacokinetics of stable polyacrylamide nanoparticles following intravenous injection in the rat. Toxicol Appl Pharmacol. 2011;251(3):181–190. | ||
Wang L, Li YF, Zhou L, et al. Characterization of gold nanorods in vivo by integrated analytical techniques: their uptake, retention, and chemical forms. Anal Bioanal Chem. 2010;396(3):1105–1114. | ||
Shinohara N, Danno N, Ichinose T, et al. Tissue distribution and clearance of intravenously administered titanium dioxide (TiO2) nanoparticles. Nanotoxicology. 2014;8(2):132–141. | ||
Brown RP, Delp MD, Lindstedt SL, Rhomberg LR, Beliles RP. Physiological parameter values for physiologically based pharmacokinetic models. Toxicol Ind Health. 1997;13(4):407–484. | ||
Eriksson E, Royo F, Lyberg K, Carlsson HE, Hau J. Effect of metabolic cage housing on immunoglobulin A and corticosterone excretion in faeces and urine of young male rats. Exp Physiol. 2004;89(4):427–433. | ||
Yokel R, Grulke E, MacPhail R. Metal-based nanoparticle interactions with the nervous system: the challenge of brain entry and the risk of retention in the organism. Wiley Interdiscip Rev. Nanomed Nanobiotechnol. 2013;5(4):346–373. | ||
Frigell J, Garcia I, Gomez-Vallejo V, Llop J, Penades S. (68)Ga-labeled gold glyconanoparticles for exploring blood-brain barrier permeability: preparation, biodistribution studies, and improved brain uptake via neuropeptide conjugation. J Am Chem Soc. 2014;136(1):449–457. | ||
Sonavane G, Tomoda K, Makino K. Biodistribution of colloidal gold nanoparticles after intravenous administration: effect of particle size. Colloids Surf B Biointerfaces. 2008;66(2):274–280. | ||
Kolhar P, Anselmo AC, Gupta V, et al. Using shape effects to target antibody-coated nanoparticles to lung and brain endothelium. Proc Natl Acad Sci U S A. 2013;110(26):10753–10758. | ||
Geraets L, Oomen AG, Krystek P, et al. Tissue distribution and elimination after oral and intravenous administration of different titanium dioxide nanoparticles in rats. Part Fibre Toxicol. 2014;11:30. | ||
Alpini G, Phillips JO, Vroman B, LaRusso NF. Recent advances in the isolation of liver cells. Hepatology. 1994;20(2):494–514. | ||
Mirfazaelian A, Kim KB, Lee S, Kim HJ, Bruckner JV, Fisher JW. Organ growth functions in maturing male Sprague-Dawley rats. J Toxicol Environ Health A. 2007;70(5):429–438. | ||
Krishnan K, Haddad S, Pelekis M. A simple index for representing the discrepancy between simulations of physiological pharmacokinetic models and experimental data. Toxicol Ind Health. 1995;11(4): 413–422. | ||
Khlebtsov N, Dykman L. Biodistribution and toxicity of engineered gold nanoparticles: a review of in vitro and in vivo studies. Chem Soc Rev. 2011;40(3):1647–1671. | ||
Halpern BN, Benacerraf B, Biozzi G. Quantitative study of the granulopectic activity of the reticulo-endothelial system. I. The effect of the ingredients present in India ink and of substances affecting blood clotting in vivo on the fate of carbon particles administered intravenously in rats, mice and rabbits. Br J Exp Pathol. 1953;34(4):426–440. | ||
Panagi Z, Beletsi A, Evangelatos G, Livaniou E, Ithakissios DS, Avgoustakis K. Effect of dose on the biodistribution and pharmacokinetics of PLGA and PLGA-mPEG nanoparticles. Int J Pharmaceut. 2001;221(1–2):143–152. | ||
Gordon S, Taylor PR. Monocyte and macrophage heterogeneity. Nat Rev Immunol. 2005;5(12):953–964. | ||
Sahay G, Alakhova DY, Kabanov AV. Endocytosis of nanomedicines. J Control Release. 2010;145(3):182–195. | ||
Chithrani BD, Ghazani AA, Chan WC. Determining the size and shape dependence of gold nanoparticle uptake into mammalian cells. Nano lett. 2006;6(4):662–668. | ||
Jiang W, Kim BY, Rutka JT, Chan WC. Nanoparticle-mediated cellular response is size-dependent. Nat Nanotechnol. 2008;3(3):145–150. | ||
Luciani N, Gazeau F, Wilhelm C. Reactivity of the monocyte/macrophage system to superparamagnetic anionic nanoparticles. J Mater Chem. 2009;19(35):6373–6380. | ||
Lesniak A, Fenaroli F, Monopoli MP, Aberg C, Dawson KA, Salvati A. Effects of the presence or absence of a protein corona on silica nanoparticle uptake and impact on cells. ACS Nano. 2012;6(7):5845–5857. | ||
Alkilany AM, Murphy CJ. Toxicity and cellular uptake of gold nanoparticles: what we have learned so far? J Nanopart Res. 2010;12(7):2313–2333. | ||
Ferrari R, Lupi M, Colombo C, Morbidelli M, D’Incalci M, Moscatelli D. Investigation of size, surface charge, PEGylation degree and concentration on the cellular uptake of polymer nanoparticles. Colloids Surf B Biointerfaces. 2014;123:639–647. | ||
Jin H, Heller DA, Sharma R, Strano MS. Size-dependent cellular uptake and expulsion of single-walled carbon nanotubes: single particle tracking and a generic uptake model for nanoparticles. ACS Nano. 2009;3(1):149–158. | ||
Gref R, Luck M, Quellec P, et al. ‘Stealth’ corona-core nanoparticles surface modified by polyethylene glycol (PEG): influences of the corona (PEG chain length and surface density) and of the core composition on phagocytic uptake and plasma protein adsorption. Colloids Surf B Biointerfaces. 2000;18(3–4):301–313. | ||
Nel AE, Madler L, Velegol D, et al. Understanding biophysicochemical interactions at the nano-bio interface. Nat Mater. 2009;8(7):543–557. | ||
Lundqvist M, Stigler J, Cedervall T, et al. The evolution of the protein corona around nanoparticles: a test study. ACS Nano. 2011;5(9):7503–7509. | ||
Sahneh FD, Scoglio CM, Monteiro-Riviere NA, Riviere JE. Predicting the impact of biocorona formation kinetics on interspecies extrapolations of nanoparticle biodistribution modeling. Nanomedicine (Lond). 2015;10(1):25–33. | ||
Praetorius A, Tufenkji N, Goss KU, Scheringer M, von der Kammer F, Elimelech M. The road to nowhere: equilibrium partition coefficients for nanoparticles. Environ-Sci Nano. 2014;1(4):317–323. | ||
Johanson G. Modeling of disposition. In: Reference Module in Biomedical Sciences. Elsevier 2015. | ||
Lin IC, Liang M, Liu TY, Monteiro MJ, Toth I. Cellular transport pathways of polymer coated gold nanoparticles. Nanomedicine. 2012;8(1):8–11. | ||
Praetner M, Rehberg M, Bihari P, et al. The contribution of the capillary endothelium to blood clearance and tissue deposition of anionic quantum dots in vivo. Biomaterials. 2010;31(26):6692–6700. | ||
Gratton SE, Ropp PA, Pohlhaus PD, et al. The effect of particle design on cellular internalization pathways. Proc Natl Acad Sci U S A. 2008;105(33):11613–11618. | ||
Bernareggi A, Rowland M. Physiologic modeling of cyclosporin kinetics in rat and man. J Pharmacokinet Biopharm. 1991;19(1):21–50. | ||
Travlos GS. Normal structure, function, and histology of the bone marrow. Toxicol Pathol. 2006;34(5):548–565. |
 © 2016 The Author(s). This work is published and licensed by Dove Medical Press Limited. The
full terms of this license are available at https://www.dovepress.com/terms
and incorporate the Creative Commons Attribution
- Non Commercial (unported, 3.0) License.
By accessing the work you hereby accept the Terms. Non-commercial uses of the work are permitted
without any further permission from Dove Medical Press Limited, provided the work is properly
attributed. For permission for commercial use of this work, please see paragraphs 4.2 and 5 of our Terms.
© 2016 The Author(s). This work is published and licensed by Dove Medical Press Limited. The
full terms of this license are available at https://www.dovepress.com/terms
and incorporate the Creative Commons Attribution
- Non Commercial (unported, 3.0) License.
By accessing the work you hereby accept the Terms. Non-commercial uses of the work are permitted
without any further permission from Dove Medical Press Limited, provided the work is properly
attributed. For permission for commercial use of this work, please see paragraphs 4.2 and 5 of our Terms.