Back to Journals » Patient Preference and Adherence » Volume 10
The Universal Patient Centredness Questionnaire: scaling approaches to reduce positive skew
Authors Bjertnaes O ![]() , Iversen HH
, Iversen HH ![]() , Garratt AM
, Garratt AM
Received 4 July 2016
Accepted for publication 31 August 2016
Published 3 November 2016 Volume 2016:10 Pages 2255—2260
DOI https://doi.org/10.2147/PPA.S116424
Checked for plagiarism Yes
Review by Single anonymous peer review
Peer reviewer comments 2
Editor who approved publication: Dr Johnny Chen
Oyvind Bjertnaes, Hilde Hestad Iversen, Andrew M Garratt
Unit for Patient-Reported Quality, Norwegian Institute of Public Health, Oslo, Norway
Purpose: Surveys of patients’ experiences typically show results that are indicative of positive experiences. Unbalanced response scales have reduced positive skew for responses to items within the Universal Patient Centeredness Questionnaire (UPC-Q). The objective of this study was to compare the unbalanced response scale with another unbalanced approach to scaling to assess whether the positive skew might be further reduced.
Patients and methods: The UPC-Q was included in a patient experience survey conducted at the ward level at six hospitals in Norway in 2015. The postal survey included two reminders to nonrespondents. For patients in the first month of inclusion, UPC-Q items had standard scaling: poor, fairly good, good, very good, and excellent. For patients in the second month, the scaling was more positive: poor, good, very good, exceptionally good, and excellent. The effect of scaling on UPC-Q scores was tested with independent samples t-tests and multilevel linear regression analysis, the latter controlling for the hierarchical structure of data and known predictors of patient-reported experiences.
Results: The response rate was 54.6% (n=4,970). Significantly lower scores were found for all items of the more positively worded scale: UPC-Q total score difference was 7.9 (P<0.001), on a scale from 0 to 100 where 100 is the best possible score. Differences between the four items of the UPC-Q ranged from 7.1 (P<0.001) to 10.4 (P<0.001). Multivariate multilevel regression analysis confirmed the difference between the response groups, after controlling for other background variables; UPC-Q total score difference estimate was 8.3 (P<0.001).
Conclusion: The more positively worded scaling significantly lowered the mean scores, potentially increasing the sensitivity of the UPC-Q to identify differences over time and between providers. However, none of the groups exhibited large positive skew and ceiling effects, implying that such effects might not be a big measurement problem for either scaling format. We recommend using the standard scaling in surveys producing external indicators for inter-provider comparisons. The more positively worded scaling has greater relevance for local measurement work where the results of patient experience surveys have shown large positive skew, and intra-provider comparison is the primary goal.
Keywords: patient centeredness, patient satisfaction, questionnaire, survey
Introduction
The patients’ perspective is gaining more attention in research and quality improvement, increasing the need for valid and reliable instruments for the measurement of patient-reported experiences and outcomes. A common feature of patient-based instruments evaluating health care services is a skew toward positive evaluations,1,2 which has also been observed in service user evaluations in other sectors.3 The reasons for this positivity tendency are complex and multifaceted, and it involves a range of cultural, methodological, and relational factors.3–5 Positive skew casts doubt over the validity of patient evaluations as an indicator of quality and creates measurement challenges when trying to measure differences over time or between providers. In health care evaluation, the dominant paradigm is to ask for patient-reported experiences, not satisfaction, to reduce the amount of positive skew.6,7 The Norwegian national quality indicators that are based on patient experiences with hospitals are less skewed toward positive evaluations than patient satisfaction.8 However, the national measurements also show that most indicators have mean scores >60, on a scale from 0 to 100, thus being skewed toward the positive end of the scale.
There are several approaches to deal with positive skew in this research field. One approach is to treat the dependent variables as categorical variables, that is using only non-parametric statistics when conducting statistical analysis. Another approach is to test alternative response formats to reduce positive skew and improve response distributions, by manipulating the number of response categories9–13 or by manipulating the labels on the response categories. The latter includes research on experience or evaluation versus satisfaction labels14–16 and research on balanced versus unbalanced response scales.17,18 Taken together, the research on response scales to reduce positive skew in patients’ experiences and satisfaction is scarce and heterogeneous, and there is a lack of evidence for one particular method. However, the use of an unbalanced scale with more positive categories than negative has been identified as a promising approach to handle this particular measurement challenge in patient service evaluation work.2,17,18
The Universal Patient Centeredness Questionnaire (UPC-Q) has been tested and validated in three different patient populations in Norway.19 The UPC-Q gives the patient the choice of which service aspects are most important to him/her and then allows them to evaluate the health service on those aspects. As part of validity testing, two different response formats in the form of balanced and unbalanced scales were compared with the latter having significantly lower mean scores for all UPC-Q items.19 However, the unbalanced scale still showed clear indications of positive skew, with mean scores varying from 69.7 to 78.8, on a scale from 0 to 100 where 100 is the best score.19 Thus, we decided to test the unbalanced response scale with another unbalanced approach to scaling. The objective of this study was to compare the two unbalanced response scales to assess whether positive skew and ceiling effects might be further reduced by the new unbalanced scale. Based on the literature, we hypothesized that the more positively worded scaling would significantly lower the mean scores.2,17,18
Patients and methods
Data collection
The UPC-Q was included in a patient experience survey conducted at the ward level at six hospitals in Norway in 2015. The survey was postal with two reminders to non-respondents.
The hospital surveys were approved by the Data Protection Authority for each hospital. According to the joint body of the Norwegian Regional Committees for Medical and Health Research Ethics, research approval is not required for quality assurance projects. The Norwegian Social Science Data Services states that anonymous projects are not subject to notification. Patients were informed that participation was voluntary and they were assured of anonymity. Return of the questionnaire represented patient consent, which is the standard procedure in all patient experience surveys conducted by the Norwegian Institute of Public Health.
Measures
The UPC-Q is a short instrument consisting of three parts.19 First, patients give the three aspects of services that they consider the most important, rate, and weight them for relative importance by giving a fixed number of points. Second, they rate their overall experiences. Third, they make suggestions for improvement. The response scale for rating the first and third parts was originally a balanced 5-point format ranging from “very good” to “very poor”, but an unbalanced scale ranging from “poor” to “excellent” was found to perform better.19
The 5-point rating scales and the UPC-Q total scores are transformed to a scale of 0–100, where 100 is the best possible rating. UPC-Q total scores are based on the first part of the instrument including the three ratings weighted based on the importance patients assigned to each aspect. Missing values are given to patients skipping importance weightings or making an error in the allocation of weighting points.
Intervention
Patients discharged from the hospital wards in a 2-month period were included. For patients in the first month of inclusion, UPC-Q items had the following scaling: poor, fairly good, good, very good, and excellent. For patients in the second month, the scaling was more positive: poor, good, very good, exceptionally good, and excellent.
Statistical analysis
Differences in background variables for the response format respondent groups were tested by chi-square tests. Differences between the two unbalanced response formats for each of the UPC-Q items and UPC-Q scale scores were assessed using independent samples t-tests.
Multilevel linear regression analysis was used to test the effect of response format on UPC-Q scores, controlling for the hierarchical structure of data and known predictors of patient-reported experiences. Patient clustering within wards might inflate t values in ordinary linear regression models and give type I errors, which was the reason for using multilevel regression. The multilevel model divides the total variance into variance at the ward (macro) level versus the patient (micro) level. The wards were included as random intercepts and all variables at the patient level as fixed effects. Variables at the patient level included gender, age, self-perceived health, type of admission (routine vs emergency), and number of admissions in the last 2 years.
SPSS version 15.0 was used for all statistical analyses.
Results
The response rate was 54.6% (n=4,970). The gender and age composition did not differ between the respondents to the two types of scaling (Table 1), but one group reported slightly poorer health.
 | Table 1 Background variables for the two response scale respondent groups |
Patients in the second month responding to the more positively worded scale had significantly lower scores for all items (Table 2). The UPC-Q total score difference was 7.9 (P<0.001), on a scale from 0 to 100 where 100 is the best possible score. Differences between the four items of the UPC-Q ranged from 7.1 on the most important aspect (P<0.001) to 10.4 on the global experience item (P<0.001). The more positively worded scale pulled responses from the second highest category to the middle and second lowest category; the largest differences were the percentage of patients using the second highest category and the difference between the two formats ranging from 15.9% (most important aspect) to 23.6% (global item).
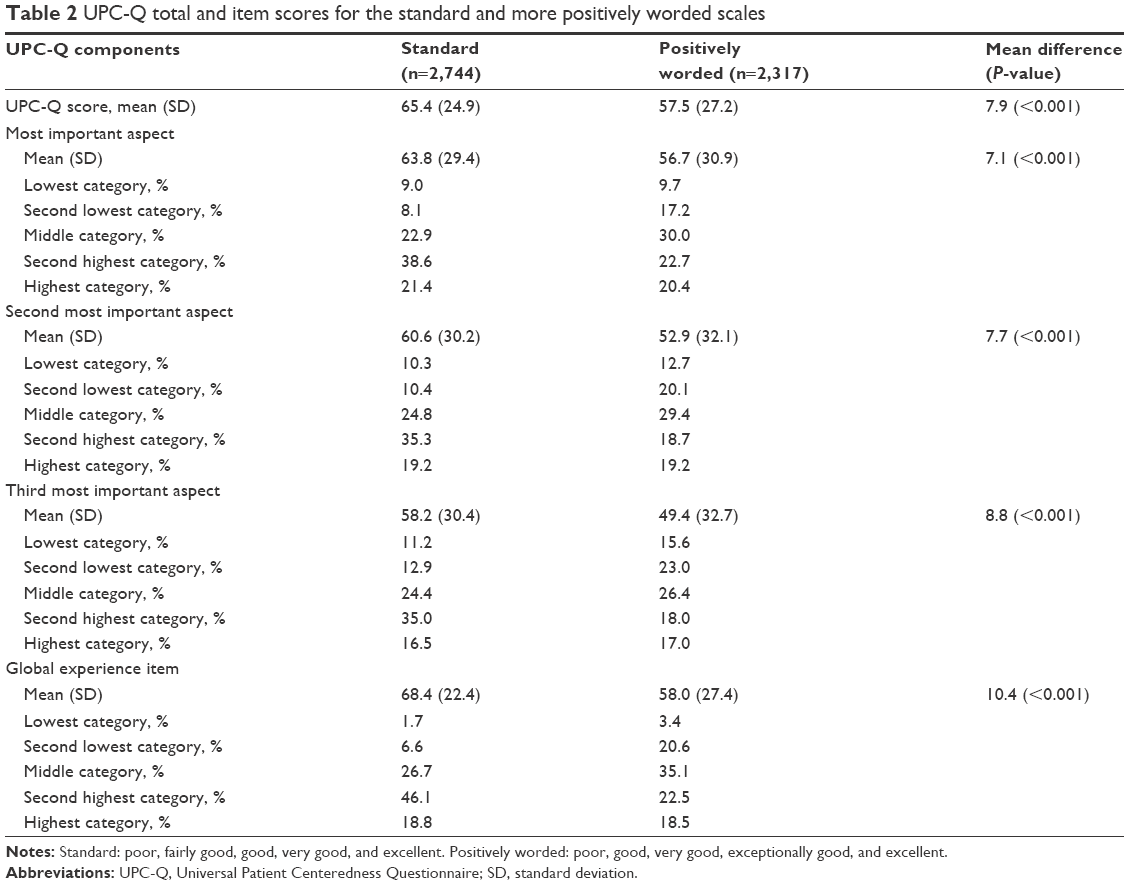 | Table 2 UPC-Q total and item scores for the standard and more positively worded scales |
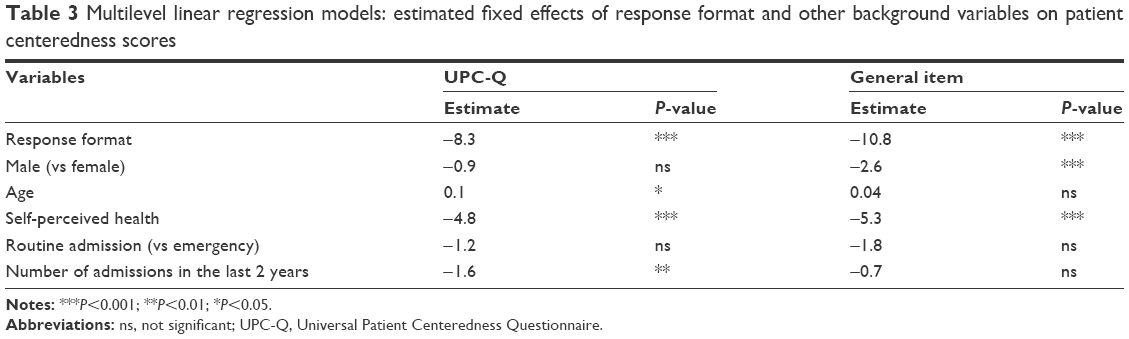
The multilevel regressions showed that scaling had significant effects on the UPC-Q total scores (difference: −8.3) and the general item (difference: −10.8), after controlling for the hierarchical structure of data and patient gender, age, self-perceived health, type of admission, and number of admissions in the last 2 years (Table 3). Self-perceived health was significantly associated with both the UPC-Q total scores and the general item, while gender, age, and number of admissions had one significant association.
 | Table 3 Multilevel linear regression models: estimated fixed effects of response format and other background variables on patient centeredness scores |
Discussion
The more positively worded scaling format significantly lowered the UPC-Q mean scores, with substantial and significant effects also after controlling for the hierarchical structure of data and patient level predictors. The percentage of patients responding in the most positive or negative response category was quite similar for the two formats, indicating that lower mean scores were a result of the more positively worded scaling format pulling a large proportion of responses down from the second highest category.
Too much positive skew challenges validity and leads to measurement problems when trying to measure differences over time or between providers. The dominant paradigm in this field is to ask about patient-reported experiences rather than satisfaction; the aim being to reduce the amount of positive skew and increase the usefulness of data as basis for quality improvement.6,7 The UPC-Q asks the patient to write down the three aspects that are most important to them and then to evaluate their experiences with the health service on those aspects. The results from the validation study supported an unbalanced response scale over a balanced scale,19 while the present study found that a revised unbalanced scale performed better than the unbalanced scale from the validation study. Taken together, these two controlled studies of different response formats indicate that UPC-Q scores might be reduced by up to 15 points on a scale from 0 to 100, purely by replacing the balanced labels with the more positively worded unbalanced scale. This effect is large and much stronger than the average difference between hospitals in Norway on patient-reported experience indicators.20 These findings are in line with the patients’ experiences in the literature, suggesting the use of an unbalanced scale to handle positive skew.17,18 However, none of these studies used a control group from the same providers, making it impossible to compare effect sizes.
The average UPC-Q scores for the unbalanced scale in the validation study varied from 69.7 to 78.8.19 Results for the same scale in the present study varied from 58.2 to 68.4, while those for the more positively worded scale varied from 49.4 to 58.0. None of the scales in the present study exhibited large positive skew and ceiling effects, implying that such effects might not be a big measurement problem for either scaling format. The inclusion of different hospitals accounts for the difference in the scores for the same scaling used in the present study and validation study. The present study included two big hospitals with relatively poor scores on patient experiences compared to the hospitals with more average scores in the validation study. We recommend using the standard unbalanced scale in surveys producing external indicators for inter-provider comparisons. The more positively worded scaling might be used in local measurement work where the results of patient experience surveys have shown large positive skew, and intra-provider comparisons are the primary goal. Furthermore, the more positively worded scale should be considered when data collection is on-site, since on-site surveys are known to produce more favorable evaluations than post-discharge surveys.21–23
The reasons for the positivity tendency in service user evaluations are complex and multifaceted and involve a range of cultural, methodological, and relational factors.3–5 One qualitative study showed that factors such as equity, faith, gratitude, loyalty, and luck prompted positive evaluation.5 Previous studies using cluster analysis and qualitative methods have shown that patients choosing the best response category on patient experiences and satisfaction quite often report negative experiences in the open-ended comment field.24,25 In the present study, the percentage of patients selecting the most favorable response category was almost the same for the types of scaling. In contrast, the controlled experiment from the validation study showed that the unbalanced scale lowered the top box group with 15%–18% compared to the balanced scale.19 Hence, the two unbalanced response scales perform very similar in terms of ceiling effects and much better than the balanced scale from the validation study. Our hypothesis is that the unbalanced scales draw some patients reporting negative experiences in the open-ended comment field25 to the lower categories, four or three, but this is something that needs to be addressed in future research.
This study was subject to limitations. The controlled trial of response scales was only tested among patients from six hospitals, limiting the generalizability outside these hospitals and to other patient populations. However, we are not aware of any specific reasons for lack of generalizability to other patient groups and hospitals, but further research should consider this issue. The survey had substantial nonresponse, leading to further uncertainty about the generalizability of findings. However, we adjusted comparisons for the hierarchical structure of data and the most important patient level predictors, reducing the possibility of nonresponse bias affecting the comparisons between the two groups.
Conclusion
More positively worded scaling significantly lowered the mean scores, potentially increasing the sensitivity of the UPC-Q to identify differences over time and between providers. However, none of the groups exhibited large positive skew and ceiling effects, implying that such effects might not be a big measurement problem for either scaling format. We recommend using the standard scaling in surveys producing external indicators for inter-provider comparisons. The more positively worded scaling might be useful in local measurement work where intra-provider comparison is the primary goal, and the results of patient experiences surveys have shown large positive skew.
Acknowledgments
The authors thank Inger Opedal Paulsrud for administrative tasks and data collection in the patient experience surveys and Tomislav Dimoski for developing the data collection system and for leading and carrying out the technical aspects of the hospital surveys.
Disclosure
The authors report no conflicts of interest in this work.
References
Crow R, Gage H, Hampson S, et al. The measurement of satisfaction with healthcare: implications for practice from a systematic review of the literature. Health Technol Assess. 2002;6(32):1–244. | ||
Streiner DL, Norman GR. Health Measurement Scales – A Practical Guide to Their Development and Use. 4th ed. Oxford: Oxford University Press; 2008. | ||
Peterson RA, Wilson WR. Measuring customer satisfaction: fact and artifact. J Acad Market Sci. 1992;20:61–71. | ||
Williams B, Coyle J, Healy D. The meaning of patient satisfaction: an explanation of high reported levels. Soc Sci Med. 1998;47(9):1351–1359. | ||
Staniszewska SH, Henderson L. Patients’ evaluations of the quality of care: influencing factors and the importance of engagement. J Adv Nurs. 2005;49(5):530–537. | ||
Gerteis M, Edgman-Levitan S, Daley J, et al. Through the Patient’s Eyes: Understanding and Promoting Patient-Centered Care. San Francisco, CA: Jossey-Bass; 1993. | ||
Garratt AM, Solheim E, Danielsen K. National and Cross-National Surveys of Patient Experiences: A Structured Review. Report 7. Oslo: Norwegian Knowledge Centre for the Health Services; 2008. | ||
Bjertnaes OA, Sjetne IS, Iversen HH. Overall patient satisfaction with hospitals: effects of patient-reported experiences and fulfilment of expectations. BMJ Qual Saf. 2012;21(1):39–46. | ||
Ware JE Jr, Hays RD. Methods for measuring patient satisfaction with specific medical encounters. Med Care. 1988;26(4):393–402. | ||
Drake KM, Hargraves JL, Lloyd S, Gallagher PM, Cleary PD. The effect of response scale, administration mode, and format on responses to the CAHPS Clinician and Group survey. Health Serv Res. 2014;49(4):1387–1399. | ||
Voutilainen A, Pitkäaho T, Kvist T, Vehviläinen-Julkunen K. How to ask about patient satisfaction? The visual analogue scale is less vulnerable to confounding factors and ceiling effect than a symmetric Likert scale. J Adv Nurs. 2016;72(4):946–957. | ||
Garratt AM, Helgeland J, Gulbrandsen P. Five-point scales outperform 10-point scales in a randomized comparison of item scaling for the Patient Experiences Questionnaire. J Clin Epidemiol. 2011;64(2):200–207. | ||
Castle NG, Engberg J. Response formats and satisfaction surveys for elders. Gerontologist. 2004;44(3):358–367. | ||
Hendriks AA, Vrielink MR, Smets EM, van Es SQ, De Haes JC. Improving the assessment of (in)patients’ satisfaction with hospital care. Med Care. 2001;39(3):270–283. | ||
Hendriks AA, Vrielink MR, van Es SQ, et al. Assessing inpatients’ satisfaction with hospital care: should we prefer evaluation or satisfaction ratings? Patient Educ Couns. 2004;55(1):142–146. | ||
Meric HJ. The effect of scale form choice on psychometric properties of patient satisfaction measurement. Health Mark Q. 1994;11(3–4):27–39. | ||
Kleefstra SM, Zandbelt LC, de Haes HJ, Kool RB. Trends in patient satisfaction in Dutch university medical centers: room for improvement for all. BMC Health Serv Res. 2015;15:112. | ||
Moret L, Nguyen JM, Pillet N, Falissard B, Lombrail P, Gasquet I. Improvement of psychometric properties of a scale measuring inpatient satisfaction with care: a better response rate and a reduction of the ceiling effect. BMC Health Serv Res. 2007;7:197. | ||
Bjertnaes O, Iversen HH, Holmboe O, et al. The Universal Patient Centeredness Questionnaire (UPC-Q): reliability and validity of a one-page questionnaire following surveys in three patient populations. Patient Relat Outcome Meas. 2016;7:55–62. | ||
Holmboe O, Bjertnaes OA. Inpatients’ Experiences with Somatic Hospitals in 2014. National Results (Pasienters erfaringer med norske sykehus i 2014. Nasjonale resultater). PasOpp-rapport nr. 2-2015. Oslo: Nasjonalt kunnskapssenter for helsetjenesten; 2015. | ||
Anastario MP, Rodriguez HP, Gallagher PM, et al. A randomized trial comparing mail versus in-office distribution of the CAHPS Clinician and Group Survey. Health Serv Res. 2010;45(5 Pt 1):1345–1359. | ||
Burroughs TE, Waterman BM, Gilin D, Adams D, McCollegan J, Cira J. Do on-site patient satisfaction surveys bias results? Jt Comm J Qual Patient Saf. 2005;31(3):158–166. | ||
Gribble RK, Haupt C. Quantitative and qualitative differences between handout and mailed patient satisfaction surveys. Med Care. 2005;43(3):276–281. | ||
Bjertnaes O, Skudal KE, Iversen HH. Classification of patients based on their evaluation of hospital outcomes: cluster analysis following a national survey in Norway. BMC Health Serv Res. 2013;13:73. | ||
Iversen HH, Bjertnæs OA, Skudal KE. Patient evaluation of hospital outcomes: an analysis of open-ended comments from extreme clusters in a national survey. BMJ Open. 2014;4(5):e004848. |
 © 2016 The Author(s). This work is published and licensed by Dove Medical Press Limited. The
full terms of this license are available at https://www.dovepress.com/terms
and incorporate the Creative Commons Attribution
- Non Commercial (unported, 3.0) License.
By accessing the work you hereby accept the Terms. Non-commercial uses of the work are permitted
without any further permission from Dove Medical Press Limited, provided the work is properly
attributed. For permission for commercial use of this work, please see paragraphs 4.2 and 5 of our Terms.
© 2016 The Author(s). This work is published and licensed by Dove Medical Press Limited. The
full terms of this license are available at https://www.dovepress.com/terms
and incorporate the Creative Commons Attribution
- Non Commercial (unported, 3.0) License.
By accessing the work you hereby accept the Terms. Non-commercial uses of the work are permitted
without any further permission from Dove Medical Press Limited, provided the work is properly
attributed. For permission for commercial use of this work, please see paragraphs 4.2 and 5 of our Terms.