Back to Journals » Clinical Interventions in Aging » Volume 16
The Stress Hyperglycemia Ratio is Associated with Hemorrhagic Transformation in Patients with Acute Ischemic Stroke
Authors Yuan C, Chen S, Ruan Y, Liu Y ![]() , Cheng H, Zeng Y, Chen Y, Cheng Q, Huang G, He W, He J
, Cheng H, Zeng Y, Chen Y, Cheng Q, Huang G, He W, He J
Received 2 November 2020
Accepted for publication 5 January 2021
Published 9 March 2021 Volume 2021:16 Pages 431—442
DOI https://doi.org/10.2147/CIA.S280808
Checked for plagiarism Yes
Review by Single anonymous peer review
Peer reviewer comments 3
Editor who approved publication: Dr Zhi-Ying Wu
Chengxiang Yuan,1,* Siyan Chen,1,* Yiting Ruan,1 Yuntao Liu,1 Haoran Cheng,1 Yaying Zeng,1 Yunbin Chen,1 Qianqian Cheng,2 Guiqian Huang,1 Weilei He,1 Jincai He1
1Department of Neurology, The First Affiliated Hospital of Wenzhou Medical University, Wenzhou, 325000, Zhejiang, People’s Republic of China; 2School of Mental Health, Wenzhou Medical University, Wenzhou, 325000, Zhejiang, People’s Republic of China
*These authors contributed equally to this work
Correspondence: Jincai He
Department of Neurology, The First Affiliated Hospital of Wenzhou Medical University, Wenzhou, 325000, Zhejiang Province, People’s Republic of China
Tel/Fax +86 0577 55579363
Email [email protected]
Background: Hemorrhagic transformation (HT) is a severe complication occurring in acute ischemic stroke (AIS) patients. Stress hyperglycemia is frequent in patients with acute illness such as stroke. We aimed to explore the association between stress hyperglycemia and HT in AIS patients.
Methods: A total of 287 consecutive participants with HT and 285 age- and sex-matched stroke patients without HT were enrolled in this study. Baseline glucose and glycated hemoglobin (HbA1c) levels were collected to measure stress hyperglycemia. The stress hyperglycemia ratio (SHR) was calculated by dividing the fasting plasma glucose at admission with HbA1c. HT was diagnosed by follow-up imaging assessment, and was radiologically classified as hemorrhagic infarction type (HI) 1 or 2 or parenchymal hematoma type (PH) 1 or 2.
Results: Univariate analysis showed that SHR is significantly higher among patients with HT than those without HT. Compared to the patients in the lower three quartiles of SHR, the incidence of HT was significantly higher among patients with the highest quartile of SHR in total population, diabetic and non-diabetic population. We also observed that patients with the highest SHR quartile were associated with an increased risk of hemorrhagic transformation after adjusted for potential covariates (68.4% versus 39.1%; adjusted odds ratio, 2.320; 95% confidence interval, 1.207– 4.459; P=0.012).
Conclusion: The stress hyperglycemia ratio, representing the state of stress hyperglycemia, was significantly associated with an increased risk of hemorrhagic transformation in patients with acute ischemic stroke.
Keywords: hyperglycemia, hemorrhagic transformation, acute ischemic stroke, stress hyperglycemia
Introduction
Hemorrhagic transformation (HT) is a frequent complication that occurs after acute ischemic stroke (AIS),1–3 and can cause clinical deterioration with associated poor outcomes, including high mortality and disability rates.1,2,4–6 Considering that early detection and diagnosis of HT can help clinicians to assess the risks, provide appropriate treatment and predict the prognosis and reduce the occurrence of HT, it is necessary for us to explore the risk factors for HT.
Previous studies have identified several risk factors for HT such as old age,7 trial fibrillation,8 hypertension,9 thrombolysis,10 interval between stroke onset and thrombolytic treatment1 and symptom severity.11,12 Actually, hyperglycemia has been established as a factor for HT which can increase the risk of symptomatic intracerebral hemorrhage11 and poor prognosis.13 The presence of persistent hyperglycemia was related to worse outcomes of stroke according to previous study and glucose management at early stage was shown to be safe.14 As is known to us, hyperglycemia dysregulates blood-brain barrier homeostasis by altering cerebral endothelial cell function.15–17 Given that disruption of vascular endothelial cells plays a critical role in the development of HT after cerebral ischemia,18 the presence of hyperglycemia may act as a predictive marker of HT.
Stress hyperglycemia is a common response to physiologically stress when patients suffer from an acute stress, and generally refers to transient hyperglycemia during illness.19,20 No specific guidelines define stress hyperglycemia. Patients are usually classified into three groups as known diabetes, newly diagnosed diabetes, and hospital-related hyperglycemia according to a review written by the Diabetes in Hospitals Writing Committee of the American Diabetes Association (ADA).21 And absolutely hyperglycemia without previous evidence of diabetes was usually the definition of stress hyperglycemia.19,20 Studies previously have shown that acute stress hyperglycemia could act as a predictor of increased risks of in-hospital mortality and poor outcome after ischemic stroke.19,22 However, the effect of stress hyperglycemia on the risk of HT with considering the background glucose level of patients is still unclear.
Glycated hemoglobin (HbA1c) is a well-founded measure of the average glucose concentration which can indicate blood glucose levels over the preceding 2 to 3 months.23 Additionally, HbA1c is usually not easily influenced by temporary changes in glycemia levels.24 Therefore, it can be postulated that glucose/HbA1c ratio could reflect the state of stress hyperglycemia more accurately with considering the background glucose level before the occurrence of HT event.
Therefore, we hypothesized stress hyperglycemia ratio (SHR), measured by glucose/HbA1c ratio, might be associated with HT in patients with AIS.
Materials and Methods
Study Participants
In this retrospective study, consecutive patients between October 2011 and March 2019 from the First Affiliated Hospital of Wenzhou Medical University clinical database of HT were sampled. This study was approved by the Medical Ethics Committee of the First Affiliated Hospital of Wenzhou Medical University. Given the retrospective nature of this study, there was no requirement for informed consent. The study protocol conforms to the ethical guidelines of the Declaration of Helsinki.
The inclusion criteria for the patients screened for enrollment in this study included: (i) patients aged 18 to 90 years; (ii) patients admitted within 7 days after the occurrence of stroke; (iii) patients undergoing magnetic resonance imaging (MRI) or computerized tomography (CT) to confirm the diagnosis of AIS after admission. Patients were, however, excluded if they: (i) were identified with transient ischemic attack (TIA) or hemorrhagic stroke; (ii) received intravenous thrombolytic therapy; (iii) were unable to receive a repeated scan of CT or MRI; or (iv) had severe renal or hepatic disease. Ultimately, 287 participants with diagnosis of HT after AIS were enrolled. Another 285 AIS patients with age-gender matching yet without HT from the stroke unit of our institution were also included using the same inclusion and exclusion criteria. Patients were treated with different level of care wards according to the severity of illness. In severe cases, patients were moved to intensive care unit while the other patients would receive normal level of care.
Data Collection
A complete survey of all patients was performed using a review of the medical records upon admission. Data on patients’ baseline demographic and clinical characteristics including age, gender and BMI were gathered. In addition, we obtained the following vascular risk factors of each subject: previous history of atrial fibrillation, hypertension, diabetes mellitus, dyslipidemia, stroke, smoking status, and alcohol consumption. Laboratory tests [White cell counts, platelets, fibrinogen, creatinine, glucose levels (fasting plasma glucose), HbA1c, total cholesterol] and blood pressure measurements were conducted during the first 24h of hospital admission. Participants were diagnosed as diabetes according to a prior history of diabetes or a HbA1c level of ≥6.5%.25 Stroke etiology classification was assessed according to the TOAST criteria.26 Moreover, we collected information regarding anticoagulant, anti-platelet and lipid-lowering treatments before HT for all patients. The National Institutes of Health Stroke Scale (NIHSS) score27 was evaluated by well-trained neurologists within 24h of admission as well as on a daily basis. Ranging from 0 to 42, score on the NIHSS quantifies the extent of neurological deficits, and more severe neurological deficits were indicated by higher scores.
Assessment of Stress Hyperglycemia
The fasting plasma glucose (FPG) within 2 days after hospitalization were drawn during the morning hours (range: 05:00–9:00) after an overnight fast (at least 8h) to measure FPG and HbA1c. FPG level was measured by hexokinase (HK) method while HbA1c was tested using ion exchange chromatography. The reference intervals based on the manufacturer’s instructions for our laboratory were as follows: glucose levels, 3.9–6.1 mmol/L; HbA1c, 4.2–6.2%. All measurements were conducted by laboratory personnel blinded to the study subjects and baseline characteristics. SHR was defined as the index of glucose/HbA1c ratio, which was calculated according to the following formula: glucose/HbA1c ratio=FPG (mmol/L)/HbA1c (%). Then, patients were divided into 4 groups based on the quartiles of SHR for further comparisons. The index quantifies the extent of stress hyperglycemia with consideration of the background glucose levels.
Definition of HT
In all patients, the diagnosis of HT was confirmed by imaging examinations performed within 24h and 7 days (±2) of stroke onset, which included a brain CT scan and MRI. Furthermore, patients would undergo CT/MRI tests whenever the clinical condition of them appeared worsen to detect the presence of HT promptly. A second CT/MRI test was conducted to confirm that each patient we included underwent HT. Two neurologists on the basis of imaging studies, blinded to the clinical information, independently examined the results of imaging to confirm the diagnosis and subtypes of HT. HT was further classified radiologically according to the recommendations of the European Cooperative Acute Stroke Study as follows:28 (i) Hemorrhagic infarct type 1 (HI-1); (ii) hemorrhagic infarct type 2 (HI-2); (iii) parenchymal hematoma type 1 (PH-1); and (iv) parenchymal hematoma type 2 (PH-2).10,28,29 Examples of HT subtypes are shown in Figure 1.
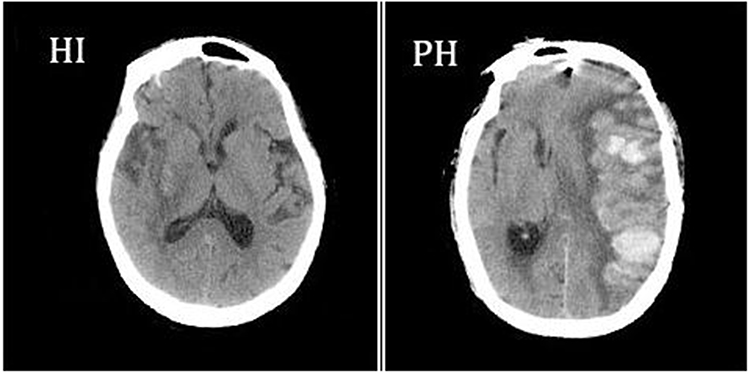 |
Figure 1 Hemorrhagic infarction and parenchymal hemorrhage CT scan examples of hemorrhagic infarction (HI) and parenchymal hemorrhage (PH), according to the European Cooperative Acute Stroke Study II classification28. |
Statistical Analysis
Continuous variables were exhibited as the mean ± standard deviation or median (quartiles), while categorical variables were shown as frequencies (percentage). The normally distributed variables were compared using Student’s t-test and analysis of variance (ANOVA), while the Mann–Whitney U-test and the Kruskal–Wallis test was used for the non-normally distributed variables. Categorical variables were compared using the Chi-square test or Fisher’s exact test. We also performed an additional subgroup analysis regarding non-diabetic population and diabetic population. Confounders associated with HT identified in the univariate analysis were entered into multivariate-adjusted binary logistic regression model to determine whether stress hyperglycemia might be a risk factor for HT. According to the quartiles of SHR, the patients in the lower three quartiles (Q1-3) of SHR, treated as the reference, were compared with the highest SHR quartile (Q4) group. Diabetes was excluded in a set of covariates when analyzing non-diabetic population cohort. Two-tailed values of P < 0.05 were considered statistically significant. The results were expressed as adjusted odds ratios (ORs) with the corresponding 95% confidence intervals (CIs). SPSS for Windows, version 19.0 (SPSS Inc., Chicago, IL, USA) and GraphPad Prism, version 8.0.2 were used for all the statistical analyses.
Results
Study Participants and Baseline Characteristics
A total of 287 consecutive participants with HT and 285 age- and sex-matched stroke patients without HT were enrolled in this study, among which 459 (80.2%) patients had information of both FPG and HbA1c. In this study, 391 (68.4%) subjects were male and 181 (31.6%) were female. The median age of the 572 included patients was 71.0 (range, 25–96). Among the patients diagnosed as hemorrhagic transformation, hemorrhagic infarct type 1 (HI-1) occurred in 58 (21.8%) patients, hemorrhagic infarct type 2 (HI-2) in 85 (32.0%), parenchymal hematoma type 1 (PH-1) in 62 (23.3%), and parenchymal hematoma type 2 (PH-2) in 61 (22.9%). The subcategorization was based on the imaging features.
The demographic, clinical, and laboratory characteristics of the patients included in this analysis are shown in Table 1. Patients with the history of atrial fibrillation and treatment of anticoagulation were more likely to undergo HT, and patients with HT were less likely to receive antiplatelet or lipid-lowering therapies compared to those without HT. Higher baseline white cell counts, fibrinogen, total cholesterol and higher initial NIHSS scores were found in the HT group. In the total population, patients in the HT group had significantly higher glucose levels, while there were no significant differences in the HbA1c levels, compared to those without HT.
 |
Table 1 Baseline Characteristics of the AIS Patients with and without HT |
The median glucose/HbA1c ratio was 0.89 (range, 0.32–2.83). The baseline demography and disease characteristics of the patients by quartiles of glucose/HbA1c ratio are shown in Table 2. In the total population, the glucose levels and the HbA1c levels were significantly higher in the SHR Q4 group [5.0 (1.4) vs 8.2 (4.5), P < 0.001; 5.9 (1.2) vs 6.5 (2.3), P = 0.001; respectively]. However, the glucose levels were higher in the SHR Q4 group while no significant differences were found in the HbA1c levels between the SHR Q4 group and the SHR Q1-3 group in the non-diabetic population [4.7 (0.9) vs 6.5 (0.8), P < 0.001; 5.7 (0.6) vs 5.5 (0.7), P = 0.063; respectively]. The same results were found in the diabetic population [6.3 (1.7) vs 10.4 (4.0), P < 0.001; 7.5 (2.1) vs 7.5 (2.5), P = 0.918; respectively]. Compared to the SHR Q1-3 group, the SHR Q4 group had higher white cell counts as well as higher total cholesterol and higher initial NIHSS scores in total population group and two subgroups. Baseline characteristics of the patients according to the subcategorized groups of HT in the total Population and the diabetic population as well as non-diabetic population were shown in Tables 3 and 4.
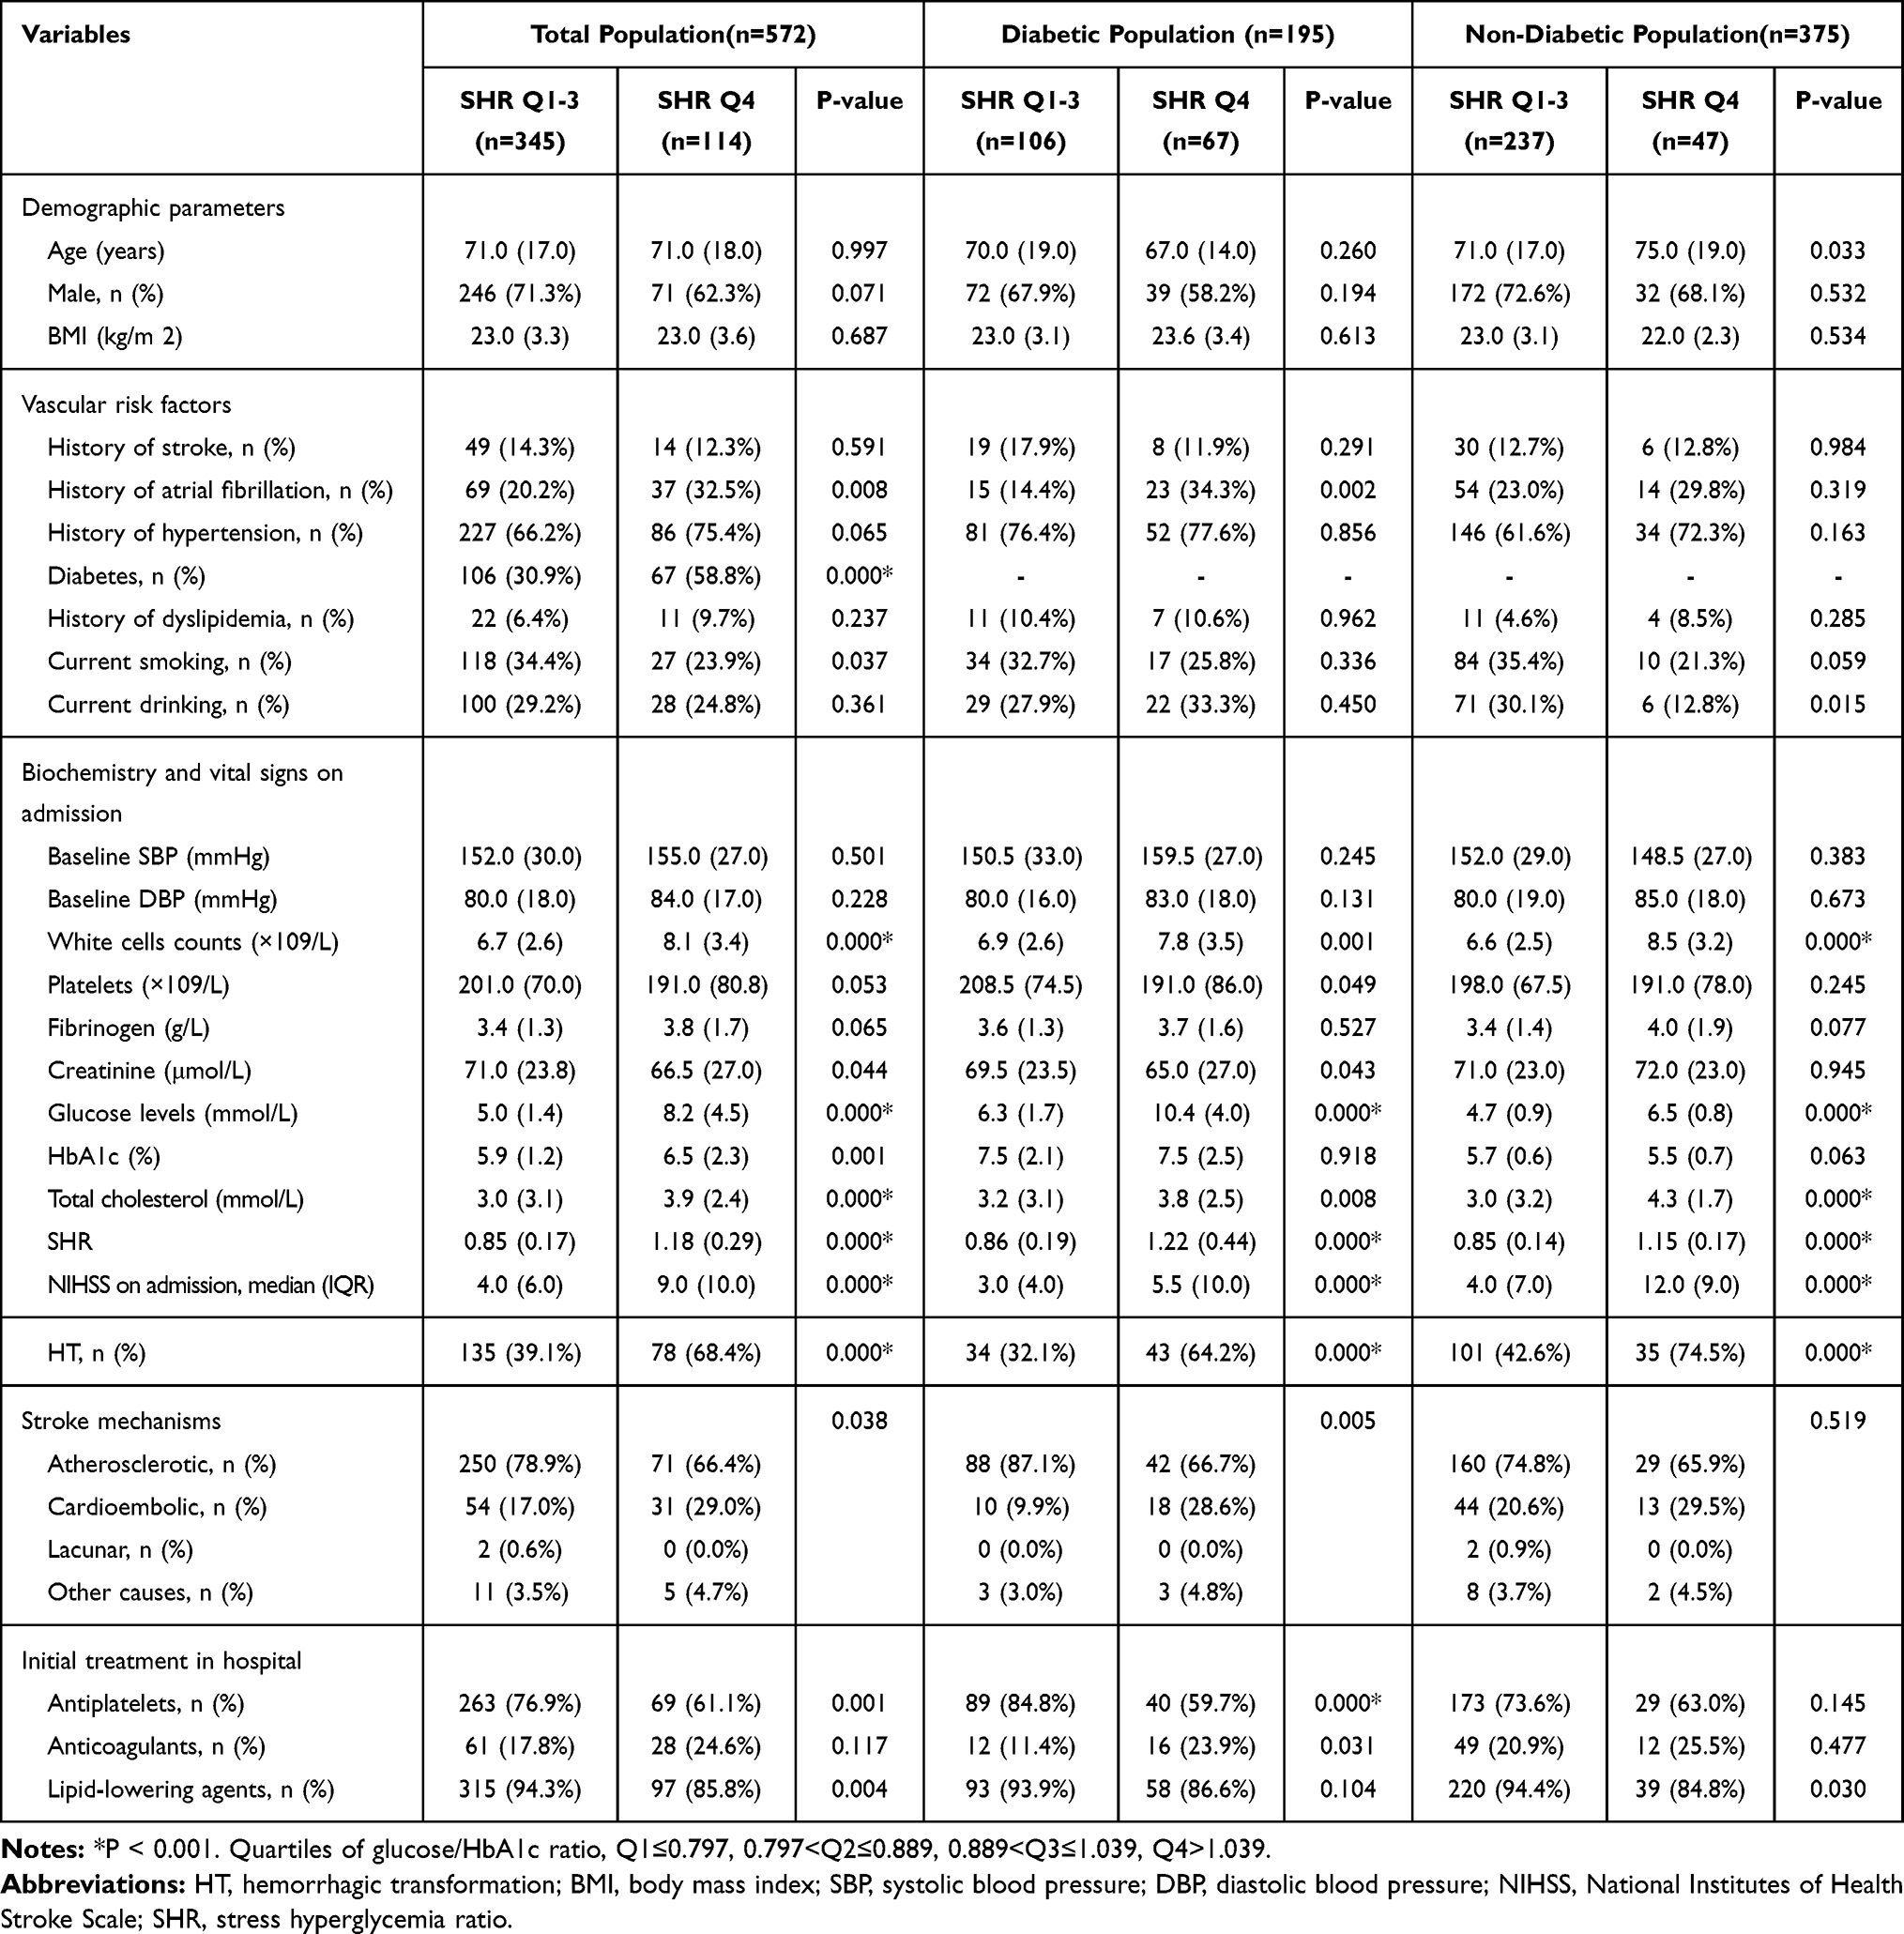 |
Table 2 Baseline Characteristics of the Patients by Quartile of the Stress Hyperglycemia Ratio |
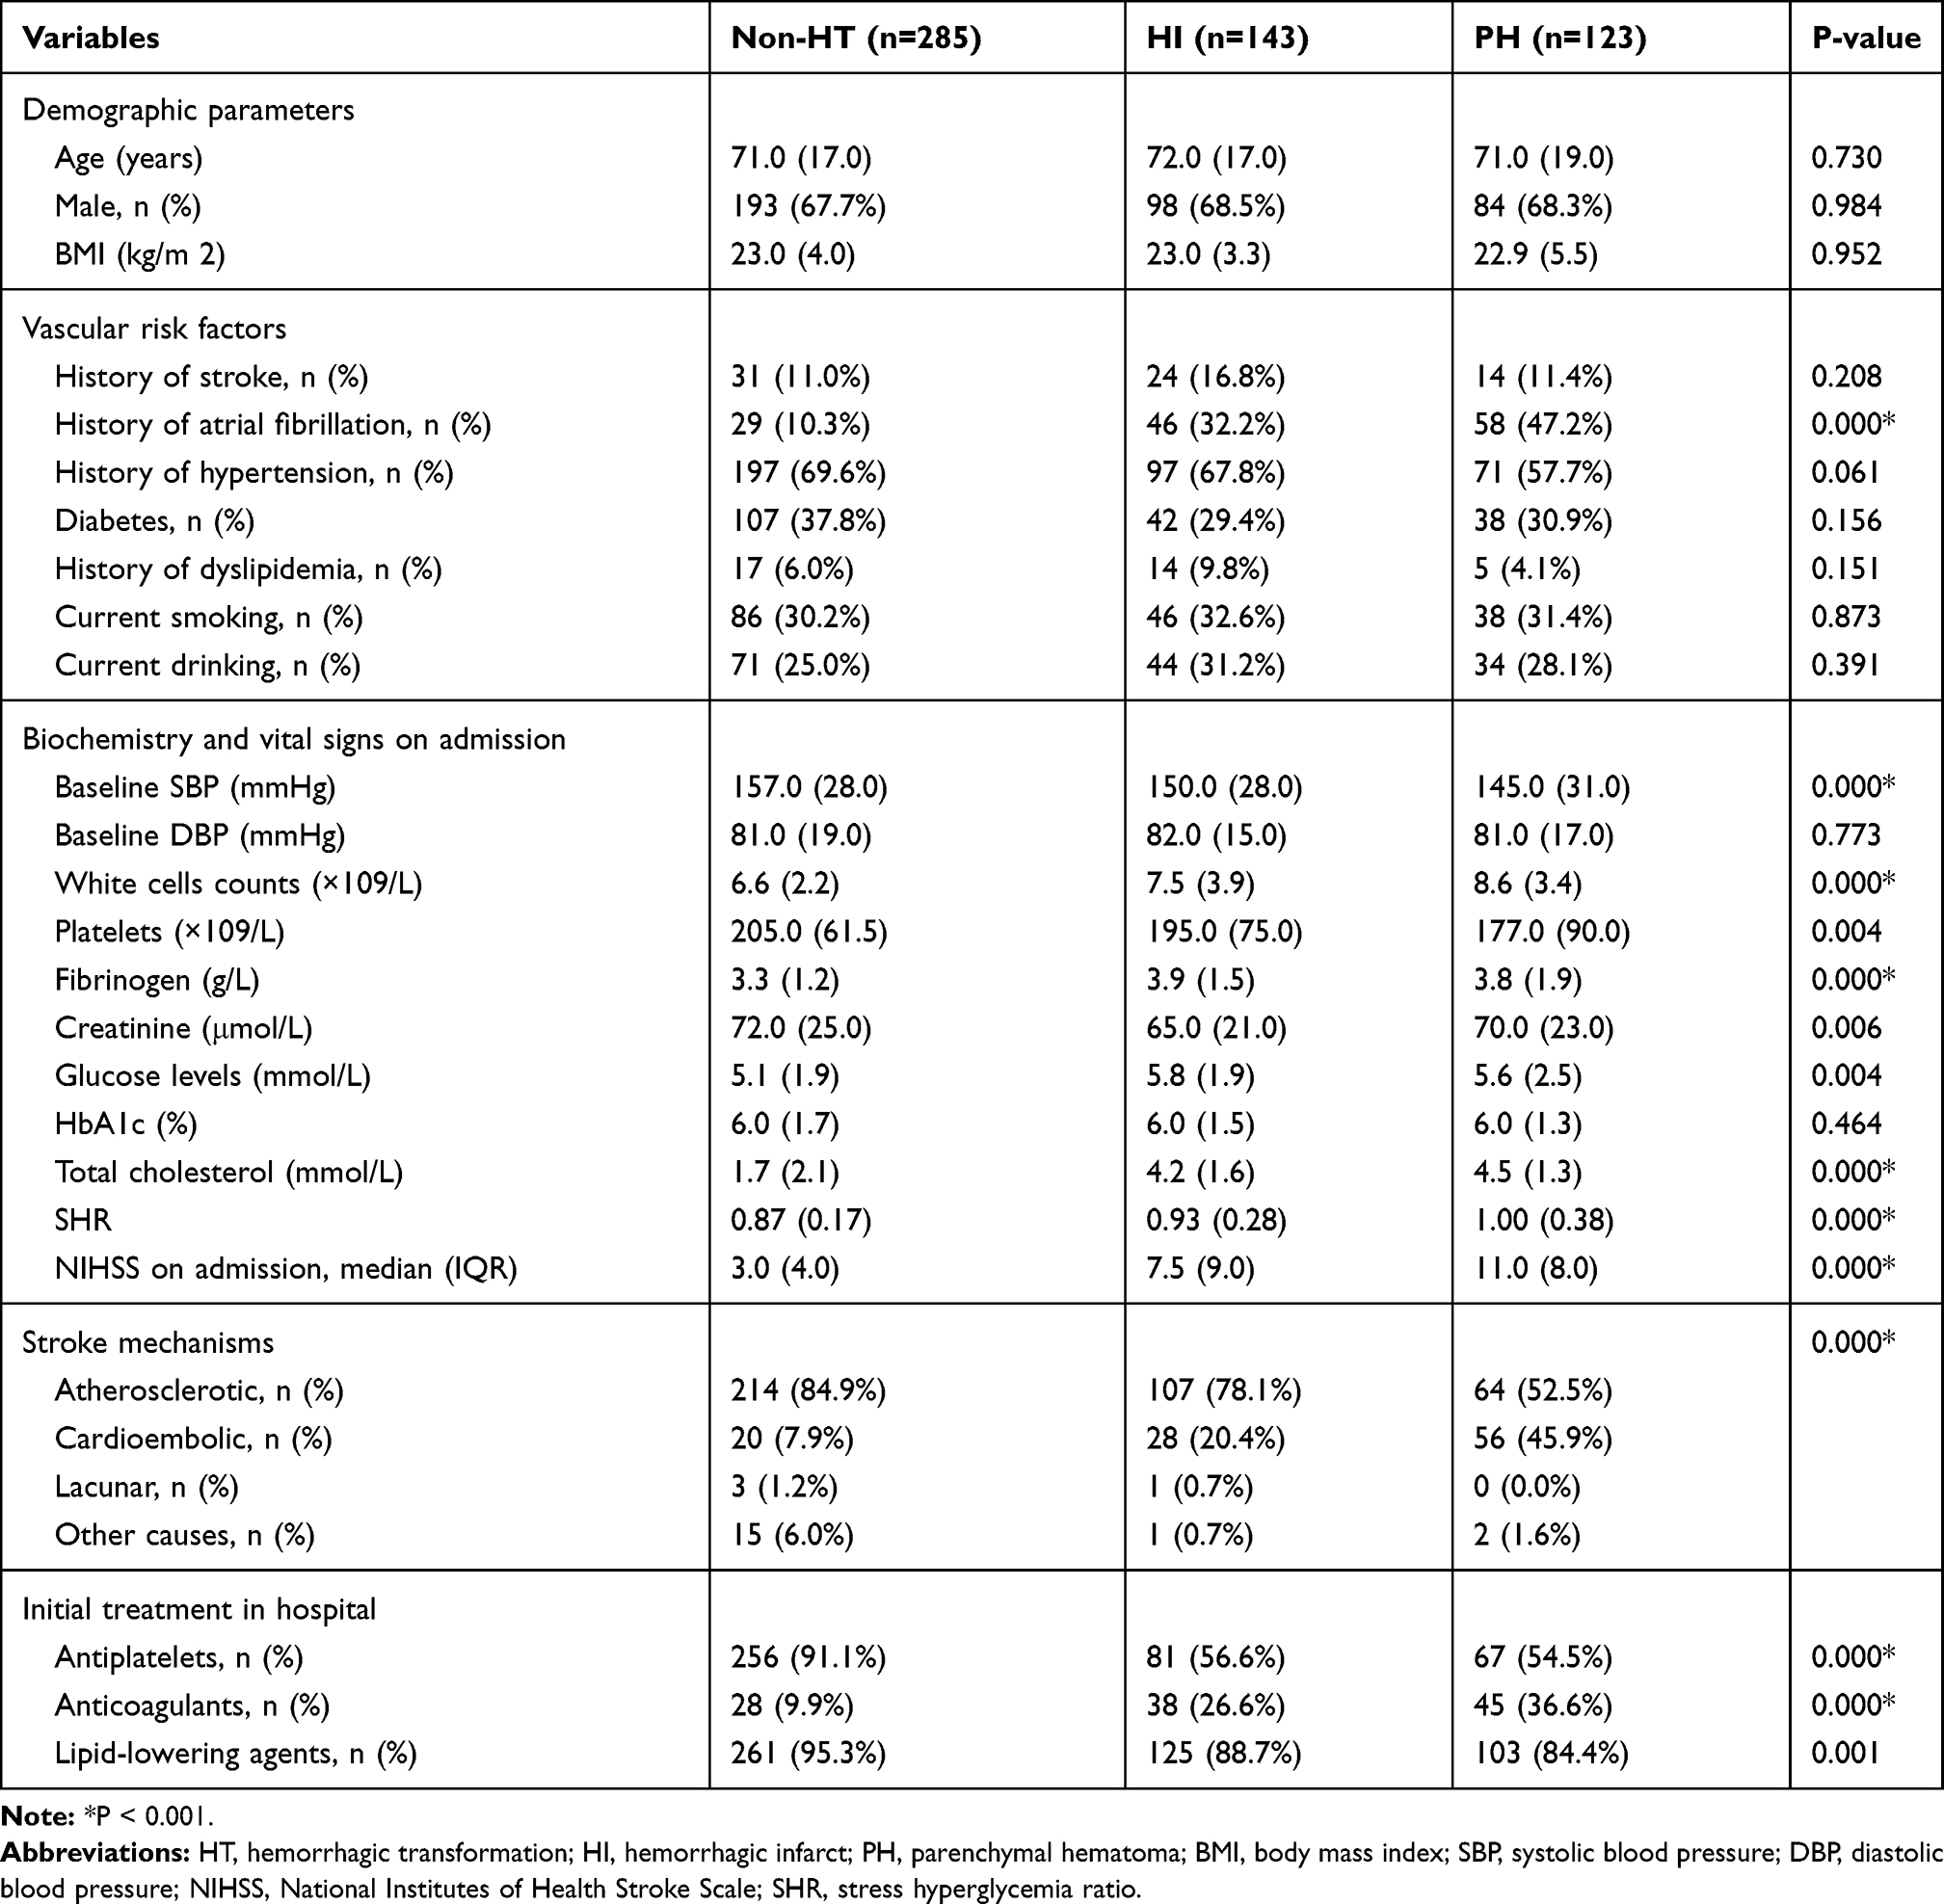 |
Table 3 Baseline Characteristics of the Patients According to the Subcategorized Groups of HT in Total Population |
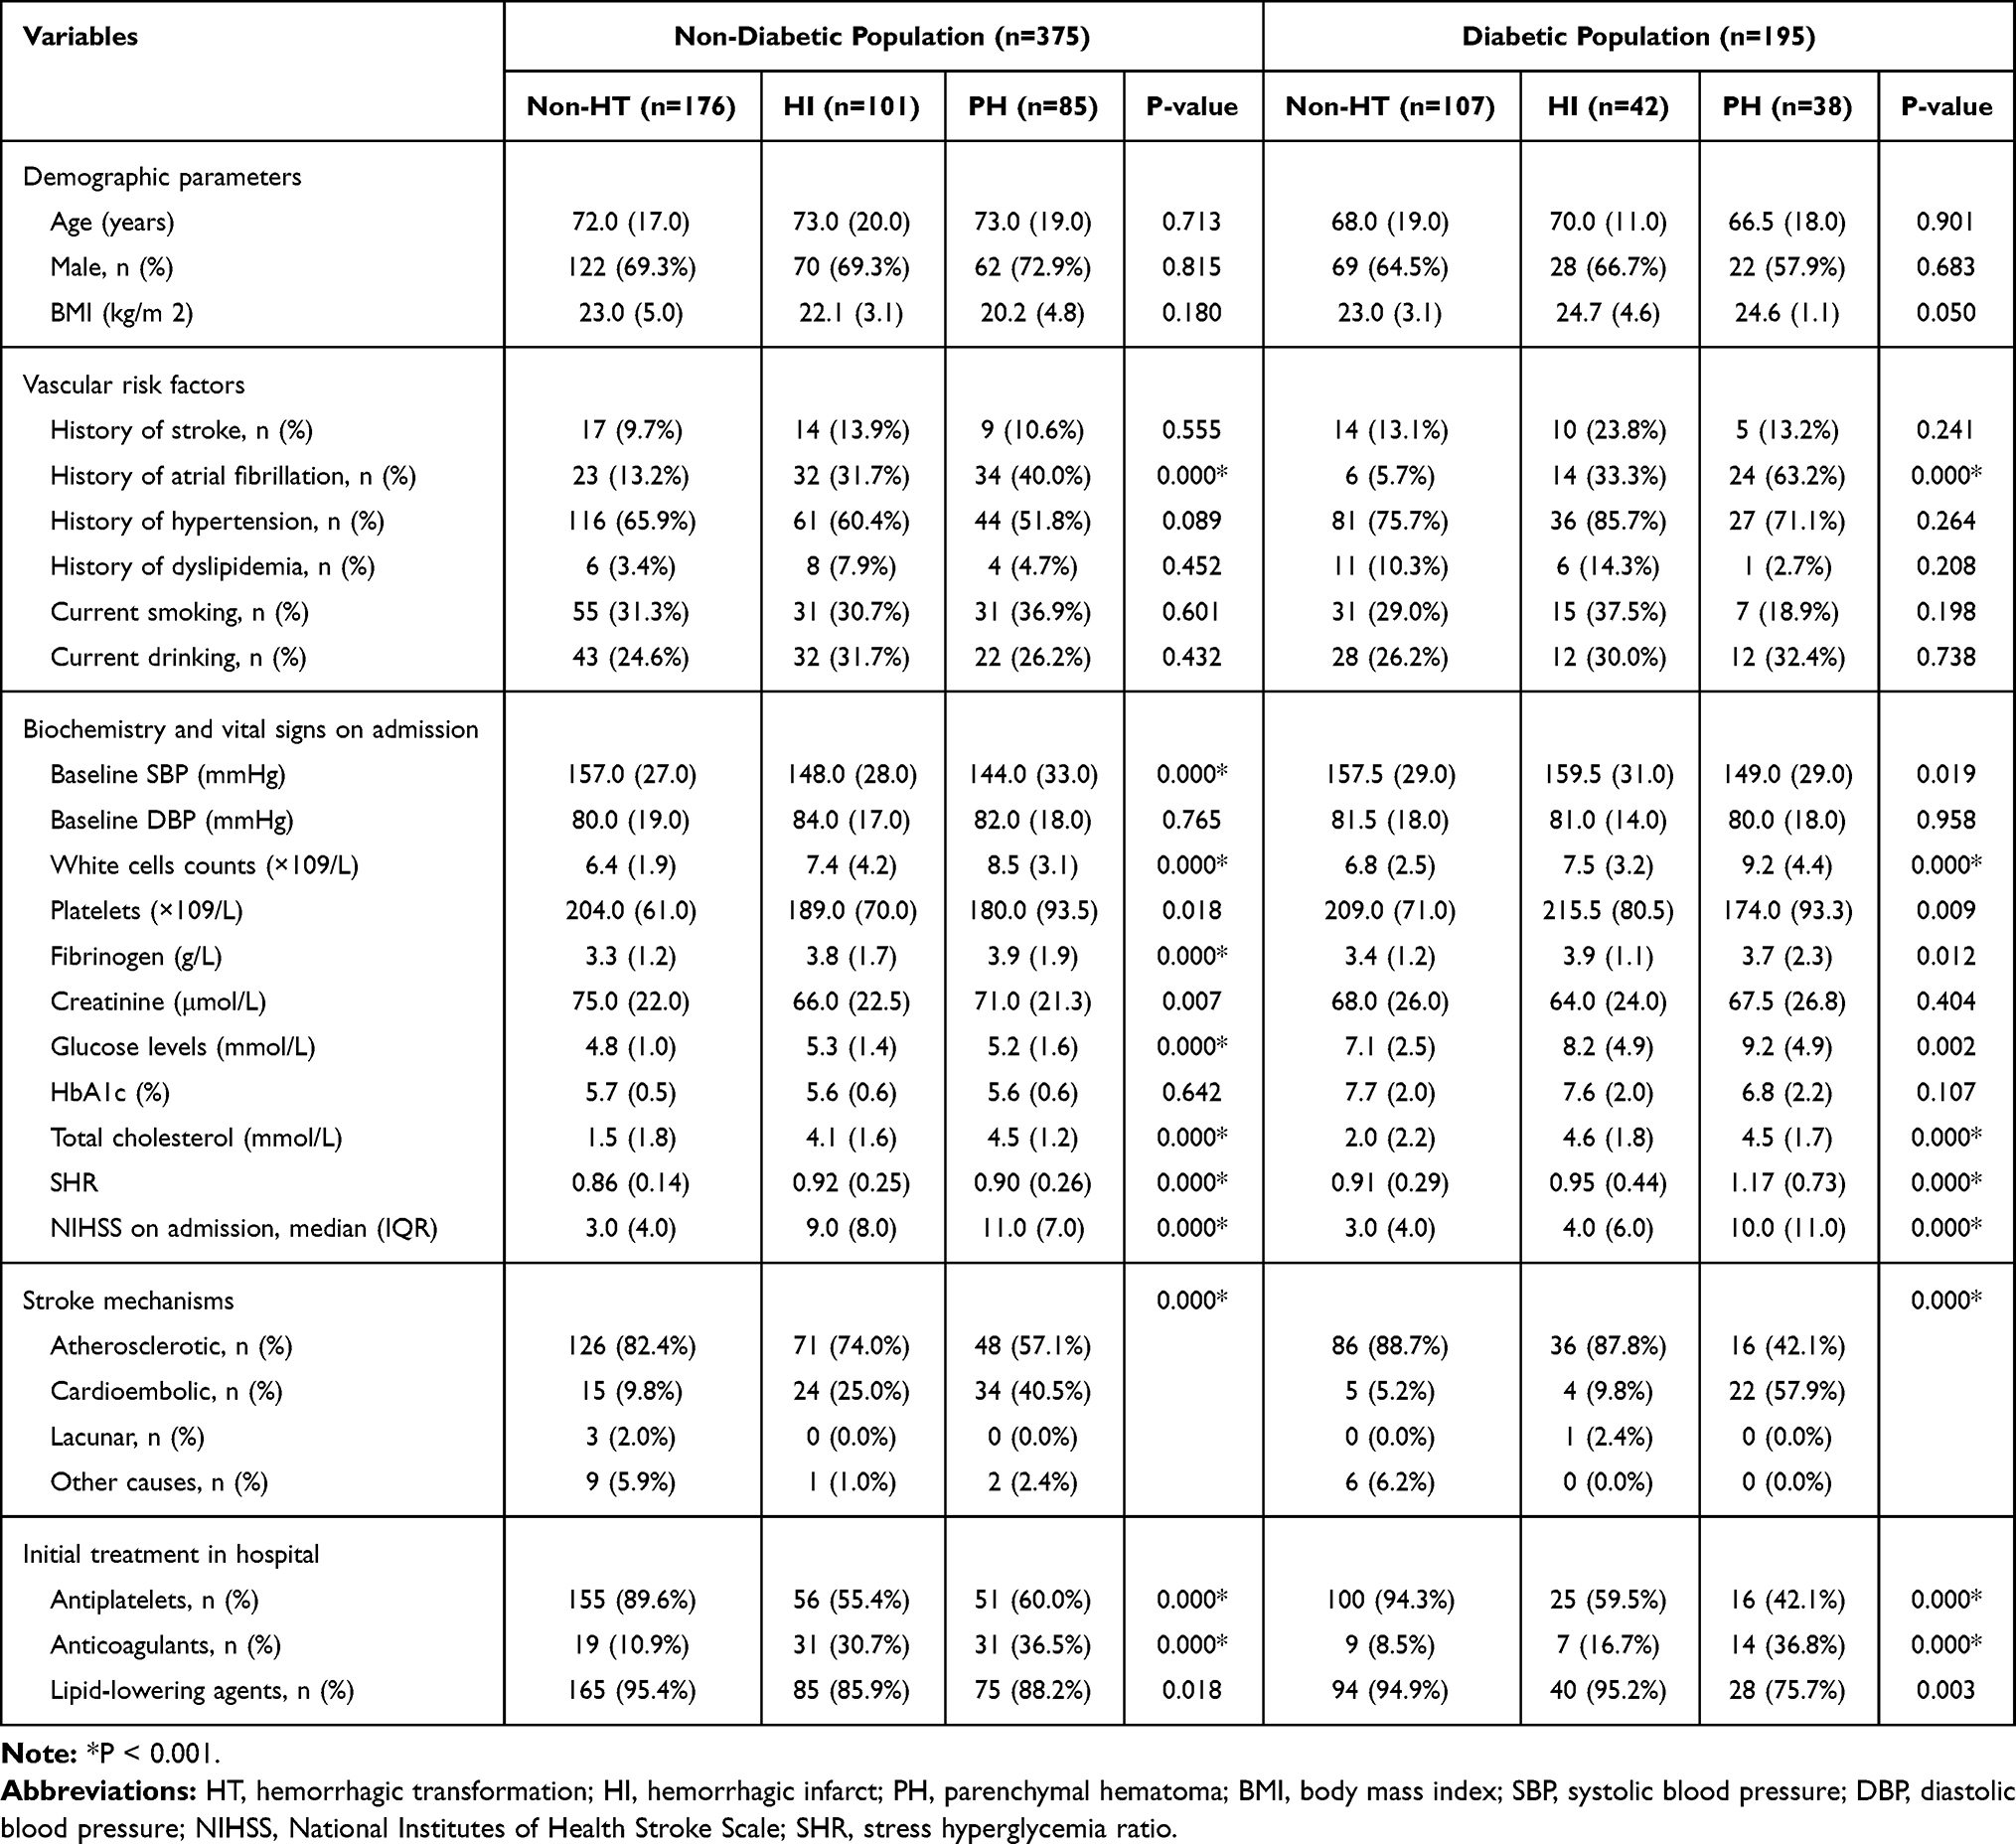 |
Table 4 Baseline Characteristics of the Patients According to the Subcategorized Groups of HT in Non-Diabetic Population and Diabetic Population |
Association of Stress Hyperglycemia with Hemorrhagic Transformation
The proportions of subjects diagnosed with HT were higher in the SHR Q4 group in total population cohort (39.1% vs 68.4%, chi-square test P < 0.001; Table 2), suggesting that stress hyperglycemia might be associated with hemorrhagic transformation. A similar pattern was noted in the non-diabetic population and diabetic population (42.6% vs 74.5%, chi-square test P < 0.001; 32.1% vs 64.2%, chi-square test P < 0.001; respectively, Table 2). As for the radiological status of HT, significant difference (H= 24.497, P < 0.001) was found in SHR among the 3 subcategorized groups in the total population cohort using Kruskal–Wallis Test (Table 3), and the SHR was significantly higher in HI group and PH group compared to that in non-HT group after the Bonferroni modification [0.93 (0.82–1.10) vs 0.87 (0.78–0.95), P = 0.003; 1.00 (0.81–1.19) vs 0.87 (0.78–0.95), P < 0.001; respectively, Figure 2A]. Similar results were found in the non-diabetic population cohort (Figure 2B) and diabetic population (Figure 2C). After Kruskal–Wallis Test, significant difference (H= 15.361, P < 0.001; H= 22.740, P < 0.001; respectively) was found in SHR among the 3 subcategorized groups (Table 4). Patients in the HI group have higher SHR than those in non-HT group [0.92 (0.79–1.04) vs 0.86 (0.79–0.93), P <0.001 after the Bonferroni modification] in non-diabetic population (Figure 2B). And the SHR in diabetic population was significantly higher in PH group compared to that in non-HT group and HI group after Bonferroni modification [1.17 (0.80–1.53) vs 0.91 (0.76–1.05), P <0.001; 1.17 (0.80–1.53) vs 0.95 (0.73–1.17), P = 0.007; respectively, Figure 2C].
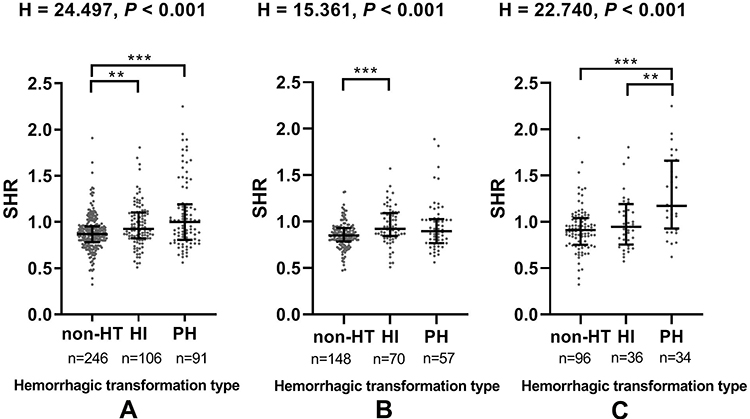 |
Figure 2 (A) The level of SHR in the subcategorized groups of HT in total population; (B) The level of SHR in the subcategorized groups of HT in non-diabetic population; (C) The level of SHR in the subcategorized groups of HT in diabetic population. Abbreviations: HI, hemorrhagic infarct; PH, parenchymal hematoma; SHR, stress hyperglycemia ratio. ***P < 0.001, **P < 0.01. |
Compared with the subjects in the SHRQ1-3 group, those in the SHR Q4 group had an OR (Figure 3) of 3.370 without adjustment. After initial adjustment for age and gender, it was found that the highest quartile (Q4) of the SHR was independently associated with HT (Model 1: OR =3.370; Figure 3). After fully adjusted for potential covariates (Model 2; Figure 3), patients with the highest quartile of SHR had 2.320-fold of risk of hemorrhagic transformation compared with those patients in the SHRQ1-3 group. Similar results were found after further adjusted for glucose levels (Model 3: OR =2.320; Figure 3). This result is similar to that obtained for patients with the highest quartile of SHR and HI (Unadjusted: OR = 3.000; Model 1: OR = 3.000; Model 2: OR = 2.267; Model 3: OR = 2.267; Figure 3). However, the highest quartile (Q4) of the SHR was not a significant and independent predictor of the PH after adjusting for the same potential confounders analyzed above (Unadjusted: OR = 3.818; Model 1: OR = 3.818; Model 2: P = 0.230; Model 3: P = 0.230; Figure 3). When the same analysis was performed in the non-diabetic population and diabetic cohort, the difference in the risk of HT was not significant between the SHR Q4 and Q1-3 groups (data not shown).
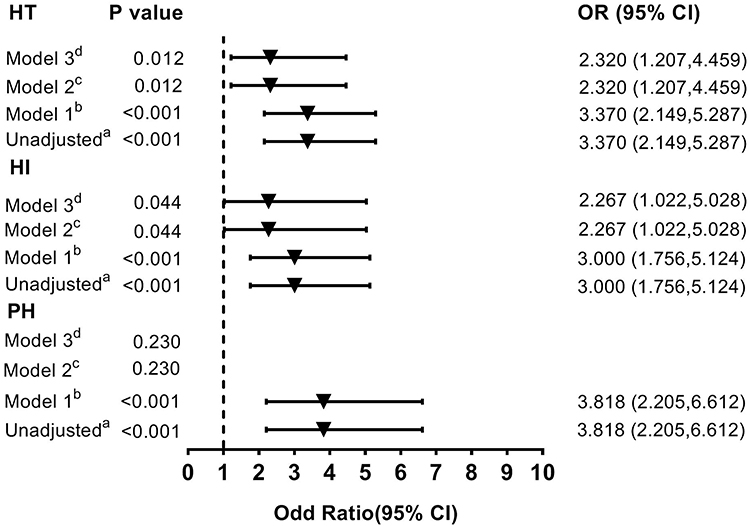 |
Figure 3 Multivariate adjusted odds ratios for the association between the highest quartile of SHR and the subcategorized groups of HT (including HT, HI and PH respectively). aReference OR (1.000) is the SHR Q1-3 group. bModel 1: adjusted for age, sex. cModel 2: adjusted for covariates from Model 1 and further adjusted for vascular risk factors (history of hypertension, atrial fibrillation, diabetes, dyslipidemia, current smoking and current alcohol drinking) and systolic blood pressure, stroke mechanism, baseline NIHSS score, baseline white cells counts, platelets, fibrinogen, creatinine and the therapy of anticoagulant, antiplatelet and lipid-lowering. dModel 3: adjusted for covariates from Model 2 and further adjusted for glucose levels. Abbreviations: OR, odds ratio; CI, confidence level; HI, hemorrhagic infarct; PH, parenchymal hematoma; SHR, stress hyperglycemia ratio. |
Discussion
In this study, our results indicated that the stress hyperglycemia ratio on admission was correlated with an increased risk of hemorrhagic transformation in patients with AIS. Independent of absolute hyperglycemia on admission, this association was significant after adjusting confounders. To our knowledge, there were few studies discussing the relationship between stress hyperglycemia and hemorrhagic transformation in patients with AIS.
Stress hyperglycemia is frequent in patients who underwent acute severe events, such as stroke and myocardial infarction. Ranging from 8% to 63%, the prevalence rate of stress hyperglycemia in non-diabetic patients with acute stroke is heterogenetic according to earlier studies.19 The difference of these conclusions may result from the heterogeneous study population and the definition of stress hyperglycemia. Absolute hyperglycemia without preexisting diabetes mellitus or deterioration of premorbid glycemic control in previous diabetes mellitus patients was usually used to measure stress hyperglycemia.19,20 However, this definition failed to consider the background glucose level, and was unable to differentiate stress hyperglycemia from previously unknown diabetes mellitus or newly diagnosed diabetes mellitus. Therefore, a novel index of relative hyperglycemia is necessary to be suggested to represent a quantitative measurement of the relatively increasing glucose concentration with consideration of background glucose status. Relative measurements controlling for background glycemia have been considered to be better indices than absolute hyperglycemia according to previous study,30 such as the stress hyperglycemia ratio based on HbA1c30–32 or estimated average glucose derived from HbA1c32 or based on glycated albumin (GA).33 Glucose/HbA1c ratio, defined as the admission glucose divided by the HbA1c, is chosen to assess stress hyperglycemia in our study. On the one hand, HbA1c level reflects mean glycemia over 2 to 3 months, which can identify and quantify the status of stress hyperglycemia more accurately by adjusting the background glucose level. On the other hand, it is more practical to collect baseline date of HbA1c level to reflect the chronic glycemic status because HbA1c level on admission will be assessed in almost all patients who get AIS. No additional blood tests or cost is needed. Also, it is easy to compute, without the use of complicated formula. Consistent with earlier studies, patients with HT tended to have a history of atrial fibrillation, greater stroke severity, and higher inflammatory indices such as fibrinogen levels when compared with those without HT in our study.
Previous studies have indicated that metabolic conditions of the patients on admission are related to the deterioration of AIS.34–37 Persistent hyperglycemia is an independent risk factor of infarct expansion38 and induces early neurological deterioration as well as impairment of cerebral collateral flow.35,39 And patients with dyslipidemia may have an increased risk of incident stroke and recurrent ischemic events, which can worsen the condition of AIS.40–42 Several studies have investigated acute hyperglycemia predicts increased risk of in-hospital mortality and long-term prognosis after ischemic stroke in non-diabetic patients.19,43 Also, there was previous study showed stress hyperglycemia did not appear to be directly associated with the outcome of acute ischemic stroke when fasting serum glucose levels on admission were used as the index to assess stress hyperglycemia.44 More studies are needed to validate their findings. Recent study showed that stress hyperglycemia ratio is a useful predictive marker of major adverse cardiovascular and cerebrovascular events after percutaneous coronary intervention, especially in non-diabetic patients with ST-elevation myocardial infarction.32 However, few studies focused on the relationship between stress hyperglycemia and hemorrhagic transformation. Our study may further provide the evidence that there was association between stress hyperglycemia and an increased risk of HT in patients with AIS. In this study, we found that the SHR was significantly different between the non-HT group and the HT group (0.87 vs 0.94, P < 0.001; Table 1), and patients with the highest quartile of SHR were more likely to undergo HT in total population and non-diabetic population as well as diabetic population (39.1% vs 68.4%, P < 0.001; 42.6% vs 74.5%, P < 0.001; 32.1% vs 64.2%, P < 0.001; respectively, Table 2). However, there was no significant difference in SHR between the HI and PH group in our study. Based on the adjusted multivariate regression analysis summarized in Figure 3, the highest quartile of SHR are strongly associated with an increasing risk of HT and HI, but not for PH. Therefore, we hope additional studies can be detected to further confirm our results.
Although the mechanisms underlying the association between stress hyperglycemia and HT are not fully understood, several explanations may account for the observed association. First, stress hyperglycemia is the relative increase in glucose secondary to the inflammatory and neuro-hormonal derangements that occur during a major illness. The stress hyperglycemia may reflect that there is a more severe illness stimulates a greater inflammatory and neuro-hormonal response.20,30 Such inflammatory and neuroendocrine derangements mediated by stress hyperglycemia are much greater than those in chronic hyperglycemia associated with diabetes.20,30 And hyperglycemia is associated with increasing inflammatory markers, enhanced expression of cytotoxic T-cells, and reduced expression of T-cells.45 Second, according to previous study, hyperglycemia is a player driving the angiogenic response, which increases neovascularization yet dysfunctional in the cerebrovasculature.46 Stress hyperglycemia may directly contribute to adverse outcomes through mechanisms such as induction of endothelial apoptosis, endothelial dysfunction and oxidative stress.20 Oxidative stress seems to perform a critical role in the stimulation of classic intracellular pathways that induce chronic complications of hyperglycemia.21,47 Therefore, increased oxidative stress during acute hyperglycemia might be a reasonable mechanism for adverse reactions of stress hyperglycemia. Third, hyperglycemia was found to increase blood–brain barrier disruption, oxidative stress, infarct size, and tPA-induced brain hemorrhage after ischemia–reperfusion in an animal model in previous study.48 As we know, abnormal permeability of the blood–brain barrier and dysfunction of the vascular basal lamina are two key players in favoring HT events.1,49,50 Furthermore, glucose levels in diabetic patients not only affect vascular reactivity, but also impact on platelet aggregability. An acute glucose load is also associated with an increase in platelet activation, which can induce a deleterious effect on platelet function.51
There are several limitations in this study. First, the results, though intriguing, could not prove cause and effect as the study was single-center and retrospective and lacked long-term follow-up data. Therefore, we expect prospective and multicenter studies can further confirm our results and establish causality. Second, we did not analyze some parameters which might have influenced the outcome, such as the glycemic variability that patients may experience after HT. Third, the definition of stress hyperglycemia is not yet clear. As we measured the ratio at admission based on glucose and HbA1c, the cut-off level used to define hyperglycemia might be different compared with other studies. In addition, patients enrolled in this study were admitted within 7 days of stroke onset. The results could be more accurate if we included patients with earlier admission time. Also, accurate timing of HT needs to be collected in the future for further analysis. Finally, we excluded patients with thrombolytic therapy owing to the limited sample size of this study. Consequently, subgroup analyses of patients with and without thrombolytic therapy were not performed in this study. Therefore, the results of this study require further investigation to eliminate the influence of thrombolytic therapy on the results in our study.
Conclusions
In conclusion, our results demonstrated that stress hyperglycemia, measured by glucose/HbA1c ratio, was associated with an increased risk of HT in patients with AIS.
Abbreviations
AIS, acute ischemic stroke; HbA1c, glycated hemoglobin; HT, hemorrhagic transformation; HI, hemorrhagic infarct; PH, parenchymal hematoma; SHR, stress hyperglycemia ratio.
Data Sharing Statement
Research data are not shared.
Ethics Statement
This study was approved by the Medical Ethics Committee of the First Affiliated Hospital of Wenzhou Medical University. Given the retrospective nature of this study, there was no requirement for informed consent. The study protocol conforms to the ethical guidelines of the Declaration of Helsinki. The data was maintained with confidentiality and not shared.
Acknowledgments
We thank all staff members and participants involved in the study. Cheng-Xiang Yuan and Si-Yan Chen are co-first authors.
Funding
This work was supported by grants from the Projects of National Natural Science Foundation of China (No.81873799). This source had no further role in study design, data collection and analysis, decision to publish, or preparation of the article.
Disclosure
The authors declare that they have no conflict of interest.
References
1. Alvarez-Sabin J, Maisterra O, Santamarina E, Kase CS. Factors influencing haemorrhagic transformation in ischaemic stroke. Lancet Neurol. 2013;12(7):689–705. doi:10.1016/S1474-4422(13)70055-3
2. Moulin T, Crepin-Leblond T, Chopard JL, Bogousslavsky J. Hemorrhagic infarcts. Eur Neurol. 1994;34(2):64–77. doi:10.1159/000117012
3. Fagan SC, Lapchak PA, Liebeskind DS, Ishrat T, Ergul A. Recommendations for preclinical research in hemorrhagic transformation. Transl Stroke Res. 2013;4(3):322–327. doi:10.1007/s12975-012-0222-5
4. Park JH, Ko Y, Kim WJ, et al. Is asymptomatic hemorrhagic transformation really innocuous? Neurology. 2012;78(6):421–426. doi:10.1212/WNL.0b013e318245d22c
5. Yaghi S, Willey JZ, Cucchiara B, et al. Treatment and outcome of hemorrhagic transformation after intravenous alteplase in acute ischemic stroke: a scientific statement for healthcare professionals from the American Heart Association/American Stroke Association. Stroke. 2017;48(12):e343–e361. doi:10.1161/STR.0000000000000152
6. Kaesmacher J, Kaesmacher M, Maegerlein C, et al. Hemorrhagic transformations after thrombectomy: risk factors and clinical relevance. Cerebrovasc Dis. 2017;43(5–6):294–304. doi:10.1159/000460265
7. Okada Y, Yamaguchi T, Minematsu K, et al. Hemorrhagic transformation in cerebral embolism. Stroke. 1989;20(5):598–603. doi:10.1161/01.STR.20.5.598
8. Nogueira RG, Gupta R, Jovin TG, et al. Predictors and clinical relevance of hemorrhagic transformation after endovascular therapy for anterior circulation large vessel occlusion strokes: a multicenter retrospective analysis of 1122 patients. J Neurointerv Surg. 2015;7(1):16–21. doi:10.1136/neurintsurg-2013-010743
9. Butcher K, Christensen S, Parsons M, et al. Postthrombolysis blood pressure elevation is associated with hemorrhagic transformation. Stroke. 2010;41(1):72–77. doi:10.1161/STROKEAHA.109.563767
10. Larrue V, von Kummer RR, Muller A, Bluhmki E. Risk factors for severe hemorrhagic transformation in ischemic stroke patients treated with recombinant tissue plasminogen activator: a secondary analysis of the European-Australasian Acute Stroke Study (ECASS II). Stroke. 2001;32(2):438–441. doi:10.1161/01.STR.32.2.438
11. Kase CS, Furlan AJ, Wechsler LR, et al. Cerebral hemorrhage after intra-arterial thrombolysis for ischemic stroke: the PROACT II trial. Neurology. 2001;57(9):1603–1610. doi:10.1212/WNL.57.9.1603
12. National Institute of Neurological Disorders and Stroke rt-PA Stroke Study Group. Tissue plasminogen activator for acute ischemic stroke. N Engl J Med. 1995;333(24):1581–1587. doi:10.1056/NEJM199512143332401
13. Tsivgoulis G, Katsanos AH, Mavridis D, et al. Association of baseline hyperglycemia with outcomes of patients with and without diabetes with acute ischemic stroke treated with intravenous thrombolysis: a propensity score-matched analysis from the SITS-ISTR registry. Diabetes. 2019;68(9):1861–1869. doi:10.2337/db19-0440
14. Palaiodimou L, Lioutas VA, Lambadiari V, Paraskevas GP, Voumvourakis K, Tsivgoulis G. Glycemia management in acute ischemic stroke: current concepts and novel therapeutic targets. Postgrad Med. 2019;131(7):423–437. doi:10.1080/00325481.2019.1651206
15. Arcambal A, Taile J, Rondeau P, Viranaicken W, Meilhac O, Gonthier MP. Hyperglycemia modulates redox, inflammatory and vasoactive markers through specific signaling pathways in cerebral endothelial cells: insights on insulin protective action. Free Radic Biol Med. 2019;130:59–70. doi:10.1016/j.freeradbiomed.2018.10.430
16. Rom S, Zuluaga-Ramirez V, Gajghate S, et al. Hyperglycemia-driven neuroinflammation compromises BBB leading to memory loss in both Diabetes Mellitus (DM) type 1 and type 2 mouse models. Mol Neurobiol. 2019;56(3):1883–1896. doi:10.1007/s12035-018-1195-5
17. Kim JS. tPA helpers in the treatment of acute ischemic stroke: are they ready for clinical use? J Stroke. 2019;21(2):160–174. doi:10.5853/jos.2019.00584
18. Rodríguez-Yáñez M, Castellanos M, Blanco M, et al. Micro- and macroalbuminuria predict hemorrhagic transformation in acute ischemic stroke. Neurology. 2006;67(7):1172–1177. doi:10.1212/01.wnl.0000238353.89194.08
19. Capes SE, Hunt D, Malmberg K, Pathak P, Gerstein HC. Stress hyperglycemia and prognosis of stroke in nondiabetic and diabetic patients: a systematic overview. Stroke. 2001;32(10):2426–2432. doi:10.1161/hs1001.096194
20. Dungan KM, Braithwaite SS, Preiser JC. Stress hyperglycaemia. Lancet. 2009;373(9677):1798–1807. doi:10.1016/S0140-6736(09)60553-5
21. Clement S, Braithwaite SS, Magee MF, et al. Management of diabetes and hyperglycemia in hospitals. Diabetes Care. 2004;27(2):553–591. doi:10.2337/diacare.27.2.553
22. Zonneveld TP, Nederkoorn PJ, Westendorp WF, Brouwer MC, van de Beek D, Kruyt ND. Hyperglycemia predicts poststroke infections in acute ischemic stroke. Neurology. 2017;88(15):1415–1421. doi:10.1212/WNL.0000000000003811
23. Welsh C, Welsh P, Celis-Morales CA, et al. Glycated hemoglobin, prediabetes, and the links to cardiovascular disease: data from UK biobank. Diabetes Care. 2020;43(2):440–445. doi:10.2337/dc19-1683
24. Chehregosha H, Khamseh ME, Malek M, Hosseinpanah F, Ismail-Beigi F. A view beyond HbA1c: role of continuous glucose monitoring. Diabetes Ther. 2019;10(3):853–863. doi:10.1007/s13300-019-0619-1
25. American Diabetes A. 2. Classification and diagnosis of diabetes: standards of medical care in Diabetes-2018. Diabetes Care. 2018;41(Suppl 1):S13–S27. doi:10.2337/dc18-S002
26. Adams HP, Bendixen BH, Kappelle LJ, et al. Classification of subtype of acute ischemic stroke. Definitions for use in a multicenter clinical trial. TOAST. Trial of Org 10172 in acute stroke treatment. Stroke. 1993;24(1):35–41. doi:10.1161/01.STR.24.1.35
27. Goldstein LB, Samsa GP. Reliability of the National Institutes of Health Stroke Scale. Extension to non-neurologists in the context of a clinical trial. Stroke. 1997;28(2):307–310. doi:10.1161/01.STR.28.2.307
28. Hacke W, Kaste M, Fieschi C, et al. Randomised double-blind placebo-controlled trial of thrombolytic therapy with intravenous alteplase in acute ischaemic stroke (ECASS II). Second European-Australasian Acute Stroke Study investigators. Lancet. 1998;352(9136):1245–1251. doi:10.1016/s0140-6736(98)08020-9
29. Paciaroni M, Agnelli G, Corea F, et al. Early hemorrhagic transformation of brain infarction: rate, predictive factors, and influence on clinical outcome: results of a prospective multicenter study. Stroke. 2008;39(8):2249–2256. doi:10.1161/STROKEAHA.107.510321
30. Roberts GW, Quinn SJ, Valentine N, et al. Relative hyperglycemia, a marker of critical illness: introducing the stress hyperglycemia ratio. J Clin Endocrinol Metab. 2015;100(12):4490–4497. doi:10.1210/jc.2015-2660
31. Su YW, Hsu CY, Guo YW, Chen HS. Usefulness of the plasma glucose concentration-to-HbA(1c) ratio in predicting clinical outcomes during acute illness with extreme hyperglycaemia. Diabetes Metab. 2017;43(1):40–47. doi:10.1016/j.diabet.2016.07.036
32. Yang Y, Kim TH, Yoon KH, et al. The stress hyperglycemia ratio, an index of relative hyperglycemia, as a predictor of clinical outcomes after percutaneous coronary intervention. Int J Cardiol. 2017;241:57–63. doi:10.1016/j.ijcard.2017.02.065
33. Pan Y, Cai X, Jing J, et al. Stress hyperglycemia and prognosis of minor ischemic stroke and transient ischemic attack: the CHANCE study (clopidogrel in high-risk patients with acute nondisabling cerebrovascular events). Stroke. 2017;48(11):3006–3011. doi:10.1161/STROKEAHA.117.019081
34. Adams HP, Del Zoppo G, Alberts MJ, et al. Guidelines for the early management of adults with ischemic stroke: a guideline from the American Heart Association/American Stroke Association Stroke Council, Clinical Cardiology Council, Cardiovascular Radiology and Intervention Council, and the Atherosclerotic Peripheral Vascular Disease and Quality of Care Outcomes in Research Interdisciplinary Working Groups: the American Academy of Neurology affirms the value of this guideline as an educational tool for neurologists. Circulation. 2007;115(20):e478–e534. doi:10.1161/CIRCULATIONAHA.107.181486
35. Jiang Y, Liu N, Han J, et al. Diabetes mellitus/poststroke hyperglycemia: a detrimental factor for tPA thrombolytic stroke therapy. Transl Stroke Res. 2020. doi:10.1007/s12975-020-00872-3
36. Zhou Y, Zhang X, Zhang L, et al. Increased stroke risk in metabolically abnormal normal weight: a 10-year follow-up of 102,037 participants in China. Transl Stroke Res. 2020. doi:10.1007/s12975-020-00866-1
37. Pol T, Held C, Westerbergh J, et al. Dyslipidemia and risk of cardiovascular events in patients with atrial fibrillation treated with oral anticoagulation therapy: insights from the ARISTOTLE (apixaban for reduction in stroke and other thromboembolic events in atrial fibrillation) trial. J Am Heart Assoc. 2018;7(3). doi:10.1161/JAHA.117.007444.
38. Baird TA, Parsons MW, Phan T, et al. Persistent poststroke hyperglycemia is independently associated with infarct expansion and worse clinical outcome. Stroke. 2003;34(9):2208–2214. doi:10.1161/01.STR.0000085087.41330.FF
39. Huang ZX, Huang Y, Zeng J, et al. Admission glucose levels may increase the risk for early neurological deterioration in females with acute ischemic stroke. Front Neurol. 2020;11:548892. doi:10.3389/fneur.2020.548892
40. Zhao L, Wang R, Song B, et al. Association between atherogenic dyslipidemia and recurrent stroke risk in patients with different subtypes of ischemic stroke. Int J Stroke. 2015;10(5):752–758. doi:10.1111/ijs.12471
41. Byun YS, Yang X, Bao W, et al. Oxidized phospholipids on apolipoprotein B-100 and recurrent ischemic events following stroke or transient ischemic attack. J Am Coll Cardiol. 2017;69(2):147–158. doi:10.1016/j.jacc.2016.10.057
42. Lee JS, Chang PY, Zhang Y, Kizer JR, Best LG, Howard BV. Triglyceride and HDL-C dyslipidemia and risks of coronary heart disease and ischemic stroke by glycemic dysregulation status: the strong heart study. Diabetes Care. 2017;40(4):529–537. doi:10.2337/dc16-1958
43. Yoon JA, Kim DY, Sohn MK, et al. Effect of stress hyperglycemia and intensive rehabilitation therapy in non-diabetic hemorrhagic stroke: Korean stroke cohort for functioning and rehabilitation. Eur J Neurol. 2016;23(11):1658–1665. doi:10.1111/ene.13101
44. Tziomalos K, Dimitriou P, Bouziana SD, et al. Stress hyperglycemia and acute ischemic stroke in-hospital outcome. Metabolism. 2017;67:99–105. doi:10.1016/j.metabol.2016.11.011
45. Marfella R, Siniscalchi M, Esposito K, et al. Effects of stress hyperglycemia on acute myocardial infarction: role of inflammatory immune process in functional cardiac outcome. Diabetes Care. 2003;26(11):3129–3135. doi:10.2337/diacare.26.11.3129
46. Ergul A, Abdelsaid M, Fouda AY, Fagan SC. Cerebral neovascularization in diabetes: implications for stroke recovery and beyond. J Cereb Blood Flow Metab. 2014;34(4):553–563. doi:10.1038/jcbfm.2014.18
47. Evans JL, Goldfine ID, Maddux BA, Grodsky GM. Oxidative stress and stress-activated signaling pathways: a unifying hypothesis of type 2 diabetes. Endocr Rev. 2002;23(5):599–622.
48. Won SJ, Tang XN, Suh SW, Yenari MA, Swanson RA. Hyperglycemia promotes tissue plasminogen activator-induced hemorrhage by Increasing superoxide production. Ann Neurol. 2011;70(4):583–590. doi:10.1002/ana.22538
49. Wang X, Tsuji K, Lee SR, et al. Mechanisms of hemorrhagic transformation after tissue plasminogen activator reperfusion therapy for ischemic stroke. Stroke. 2004;35(11 Suppl 1):2726–2730. doi:10.1161/01.STR.0000143219.16695.af
50. Khatri R, McKinney AM, Swenson B, Janardhan V. Blood-brain barrier, reperfusion injury, and hemorrhagic transformation in acute ischemic stroke. Neurology. 2012;79(13 Suppl 1):S52–S57. doi:10.1212/WNL.0b013e3182697e70
51. Worthley MI, Holmes AS, Willoughby SR, et al. The deleterious effects of hyperglycemia on platelet function in diabetic patients with acute coronary syndromes mediation by superoxide production, resolution with intensive insulin administration. J Am Coll Cardiol. 2007;49(3):304–310. doi:10.1016/j.jacc.2006.08.053
 © 2021 The Author(s). This work is published and licensed by Dove Medical Press Limited. The
full terms of this license are available at https://www.dovepress.com/terms
and incorporate the Creative Commons Attribution
- Non Commercial (unported, 3.0) License.
By accessing the work you hereby accept the Terms. Non-commercial uses of the work are permitted
without any further permission from Dove Medical Press Limited, provided the work is properly
attributed. For permission for commercial use of this work, please see paragraphs 4.2 and 5 of our Terms.
© 2021 The Author(s). This work is published and licensed by Dove Medical Press Limited. The
full terms of this license are available at https://www.dovepress.com/terms
and incorporate the Creative Commons Attribution
- Non Commercial (unported, 3.0) License.
By accessing the work you hereby accept the Terms. Non-commercial uses of the work are permitted
without any further permission from Dove Medical Press Limited, provided the work is properly
attributed. For permission for commercial use of this work, please see paragraphs 4.2 and 5 of our Terms.