Back to Journals » Clinical Ophthalmology » Volume 11
The Sensimed Triggerfish contact lens sensor: efficacy, safety, and patient perspectives
Authors Dunbar GE, Shen BY, Aref AA
Received 24 December 2016
Accepted for publication 18 April 2017
Published 8 May 2017 Volume 2017:11 Pages 875—882
DOI https://doi.org/10.2147/OPTH.S109708
Checked for plagiarism Yes
Review by Single anonymous peer review
Peer reviewer comments 2
Editor who approved publication: Dr Scott Fraser
Grace E Dunbar, Bailey Yuguan Shen, Ahmad A Aref
Illinois Eye and Ear Infirmary, Department of Ophthalmology and Visual Sciences, University of Illinois at Chicago, Chicago, IL, USA
Abstract: Intraocular pressure, a major modifiable risk factor for glaucoma, has been shown to fluctuate throughout the day in patients with glaucoma. The detection and measurement of this fluctuation may help guide the clinical management of glaucomatous individuals. The Sensimed Triggerfish contact lens sensor (CLS), which has recently gained approval for marketing in the USA, is designed to detect intraocular pressure-related changes in an eye over a 24-hour period. This review will provide an overview of the Triggerfish CLS, as well as summarize current clinical data pertaining to the device. Overall, the current evidence suggests that the Triggerfish CLS is safe and well tolerated, and provides reproducible results. One challenge of using the Triggerfish CLS is that it may only provide data on relative changes in intraocular pressure rather than absolute intraocular pressure. In addition, its validity at estimating intraocular pressure compared to other methods is still controversial. Despite these limitations, recent studies suggest a myriad of potential indications for the Triggerfish CLS, including predicting glaucomatous progression and predicting efficacy of glaucoma treatment. With further research, the Triggerfish CLS may become a useful tool for eye care practitioners.
Keywords: glaucoma, intraocular pressure, contact lens sensor, triggerfish CLS, Sensimed, 24-hour intraocular pressure monitoring
Introduction
Intraocular pressure (IOP) is an essential measurement in the management of patients with glaucomatous optic neuropathy. Currently, the majority of eye care practitioners rely on only a single or a few IOP measurements taken in the clinic during regular office hours to guide treatment. However, several authors have shown that IOP can vary throughout the day.1,2 For example, Hughes and Diamond studied 29 glaucoma patients in a single hospital and found that the average variation in IOP over a 24-hour period was 9.4 mmHg.1 Many of these patients experienced glaucomatous progression despite seemingly adequate IOPs measured in the office. Furthermore, Hughes and Diamond determined that there was no consistent time when the IOP reached its peak value. Given these results, some authors have wondered whether continuous IOP monitoring over a 24-hour period would provide more useful information to eye care practitioners than discrete daytime IOP measurements taken in the clinic.3,4
Twenty-four-hour monitoring of IOP using the common methods of IOP measurement, such as Goldmann applanation tonometry (GAT), handheld applanation tonometry, and/or pneumotonometry, is quite time consuming and inconvenient for both the patient and the medical practitioner. In addition, all of the above methods can awaken the patient and possibly artifactually change the patient’s IOP when sleeping. In order to address these problems, the Swiss company Sensimed has introduced a contact lens sensor (CLS) for detection of IOP-related changes in the eye (Triggerfish CLS, Sensimed AG, Lausanne, Switzerland). The Triggerfish CLS has recently gained FDA approval for marketing in the USA.5 This review will provide an overview of the Triggerfish CLS, as well as summarize current clinical data pertaining to the device.
Technical specifications
The Triggerfish CLS is a silicone soft contact lens designed to remain on the eye surface for 24 continuous hours. The contact lens is ~14.1 mm in diameter and 585 μm in thickness in its center.6 Currently, the device is manufactured in 8.4, 8.7, and 9 mm base curves. Embedded within the contact lens are two strain gauges, a microprocessor, and an antenna (Figure 1). The strain gauges detect changes in corneal shape, and a high correlation between CLS output and imposed IOP has been demonstrated in enucleated pig eyes.7 The contact lens receives power from and transmits strain gauge information to an adhesive antenna that is attached to the orbit of a patient (Figure 2). The adhesive antenna sends information to a portable recorder worn by the patient.
 | Figure 1 External photograph of the Triggerfish contact lens sensor. |
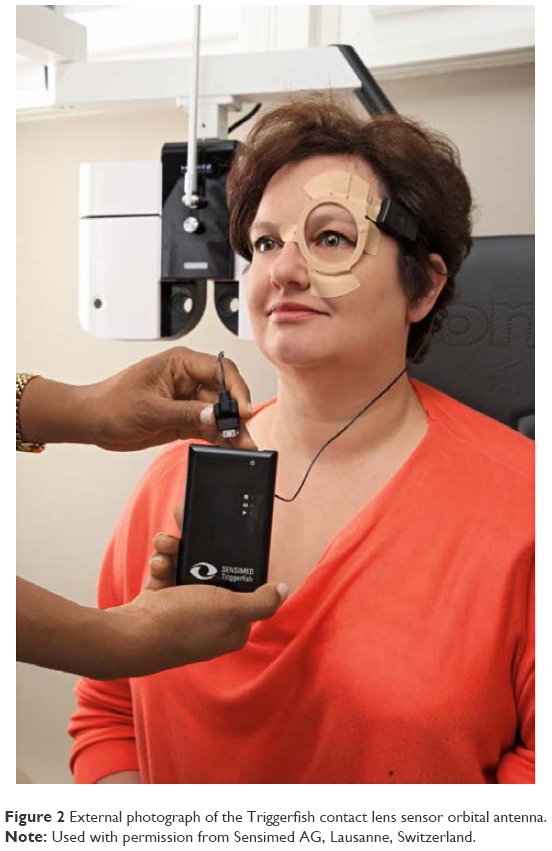 | Figure 2 External photograph of the Triggerfish contact lens sensor orbital antenna. |
The Triggerfish CLS takes 300 strain gauge readings over a 30-second period every 5 minutes, for a total of 86,400 data points over a 24-hour period.8 The data are sent via Bluetooth connection to a computer for analysis. Of note, the data points are measured in millivolts or “millivolt equivalents”2 and are relative to the very first measurement, which is taken as zero.8
Tolerability
Clinical studies have demonstrated satisfactory tolerability of the CLS in both healthy and glaucomatous subjects. In a prospective study, examining 20 glaucoma patients and 20 age-matched healthy controls, tolerability of the CLS was assessed using a visual analog scale (VAS), where zero corresponded to no discomfort and 100 corresponded to very severe discomfort.9 After a 24-hour wearing period, mean tolerability was not significantly different between the two groups, with a mean score of 21.82 in the healthy control and 26.8 in the glaucoma cohort (P=0.44). One healthy subject was excluded from the study because of improper device fitting secondary to steep corneal radii, and one glaucoma patient discontinued the study because of immediate pain and foreign body sensation upon sensor insertion. All other patients completed the 24-hour monitoring period. During the study, one glaucoma patient experienced severe foreign body sensation, and it was later discovered that there was incorrect encapsulation of the microelectronic components in the sensor, possibly representing a manufacturing defect. Following the monitoring period, 95% of the glaucoma subjects stated that they would be willing to use the device again.
In a second study, 21 glaucoma suspects and 19 patients with glaucoma participated in two 24-hour IOP monitoring sessions timed 1 week apart.10 Tolerability was assessed using a VAS, and mean tolerabilities during the first and second sessions were 27.2 and 23.8, respectively (P=0.22). The mean VAS score in glaucoma suspects was 23.1, and the mean score among established glaucoma patients was 28.1 (P=0.34). No statistically significant correlation was observed between VAS score and glaucoma status (r=−0.14; P=0.23), nor between VAS score and use of glaucoma eye drops (r=0.11; P=0.33). In total, four patients reported poor tolerability (VAS score >54) during the first monitoring session, and three patients reported poor tolerability during the second monitoring session.
Safety
Transient blurred vision, conjunctival hyperemia, and superficial punctate keratitis are the most frequent complications associated with Triggerfish CLS wear, as demonstrated by a number of clinical studies.8–12 Although no serious adverse events have been reported to be associated with the wear of the Triggerfish CLS, mild adverse effects are common. In a study of 20 healthy and 20 glaucoma subjects, 75% of healthy and 85% of glaucoma subjects experienced a likely device-related adverse event.9 In only 5% of healthy and 20% of glaucoma patients were these events classified as severe, including corneal epithelial defects, conjunctival erythema, or sharp eye pain. All adverse events resolved within 48 hours. In this same cohort, corneal topography, objective and subjective refraction, and best-corrected visual acuity (BCVA) were measured prior to and following CLS monitoring. Statistically significant changes were observed in horizontal corneal radii, objective and subjective refraction, and BCVA following CLS removal. BCVA deteriorated by an average of 0.15 logMar (roughly 1.5 Snellen lines), following CLS removal. However, given the frequent co-occurrence of transient irritation and superficial punctate keratopathy following CLS removal, these results may not portend long-term visual consequences.
Similar findings were published by Mansouri et al, who evaluated safety among a population of 21 glaucoma suspects and 19 glaucoma patients.10 At two monitoring sessions, 95% and 92% of patients experienced an adverse event. Ninety-five percent of reported adverse events were mild in severity, including blurred vision, conjunctival hyperemia, and superficial punctate keratitis. Three percent of adverse events were classified as severe, and all of these were incidents of severe conjunctival hyperemia. All adverse events resolved within 24 hours of CLS removal.
Reproducibility and validity
Studies suggest that the Triggerfish CLS provides reproducible data, but its validity in estimating IOP remains unknown. In order to test the reproducibility of the Triggerfish CLS, Mansouri et al performed two 24-hour CLS monitoring sessions spaced 1 week apart in 40 subjects.10 The investigators found that the Pearson correlation coefficient between the two sessions was 0.59, which they interpreted as fair to good reproducibility. Mottet et al and Holló et al have also reported fair to good reproducibility of Triggerfish CLS curves,6,8 with Mottet et al noting that 9 out of 25 hourly time points had significant intraclass correlation coefficients, and Holló et al noting a mean Pearson correlation coefficient of 0.733 between CLS curves.
The accuracy of the Triggerfish CLS in monitoring the 24-hour IOP profile remains unknown. In an early study, Leonardi et al tested the Triggerfish CLS on enucleated pig eyes.7 Controlling the IOP in each eye via an anterior chamber cannula attached to a saline pump, the authors found that the millivolt output of the CLS moved in lockstep with the set IOP. However, among the 10 studied pig eyes, they noted different rates of millivolt change per unit IOP change, with the range being from 0.067 to 0.124 mV/mmHg. Because the effect of IOP on corneal shape varied among the pig eyes, no single formula could be created to directly calculate IOP from CLS output and starting IOP in each eye.
In human eyes, the challenge of assessing validity is compounded, as wearing the CLS in an eye precludes IOP measurement of the eye by other methods such as GAT. Several groups have attempted to work around this problem by either studying the correlation between the first and last CLS values and IOP measurements taken with GAT just before and after CLS insertion, or studying the correlation between CLS output and IOP measurements taken with another method in the fellow eye. In 2015, Mansouri et al measured the agreement between CLS output in one eye and pneumotonometry taken every 2 hours in the fellow eye in 33 subjects.2 They found that the Pearson correlation coefficient between the two variables was 0.956, which represented high correlation. However, Mottet et al compared change in GAT IOP (taken just before and after CLS wear) with change in CLS output after 24 hours of CLS wear.6 The group found significant differences between GAT IOP and CLS output, and concluded that the CLS cannot be used to estimate absolute IOP at this time. Similarly, Holló et al studied nine patients with ocular hypertension or primary open-angle glaucoma (POAG) and did not find a correlation between the change in CLS output over 24 hours and the change in IOP as measured by GAT.8 Interestingly, they noticed that although there was no difference in GAT IOP taken before and after CLS wear, the CLS curves showed a time-dependent increase in CLS output. Based on these studies, the validity of the Triggerfish CLS at estimating IOP is still in question.
Circadian patterns of IOP
The CLS has been evaluated by several clinical studies as a means by which to investigate circadian-related IOP patterns in normal and glaucomatous subjects. As mentioned previously, Mansouri et al studied 31 healthy and two glaucoma patients over a 24-hour period, and found a high correlation between CLS output and IOP as measured by pneumotonometry in the fellow eye.2 The coefficient of determination between the mean 24-hour CLS output curve and the mean pneumotonometry curve, measured at 2-hour intervals, was R2=0.914. CLS performance was also assessed in their study by measuring heart rate during continuous 30-second CLS monitoring periods. They analyzed the agreement between ocular pulse frequency as recorded by the CLS and the measured heart rate over the same interval. Graders agreed on evaluability of the ocular pulse frequency in 83.9% of CLS curves, with 43.7% of curves being evaluable and 40.2% of curves being nonevaluable. Many of the curves could not be evaluated due to eye movements and blinks that masked the ocular pulse frequency. Among gradable curves, the accuracy of the device in detecting ocular pulse frequency was 86.5%. The authors suggest that although the sensor may have the ability to accurately detect the ocular pulse frequency, the current software associated with the device is not well suited for ocular pulse frequency detection.
As mentioned earlier, Holló et al conducted 24-hour CLS monitoring alongside GAT in nine patients with ocular hypertension and open-angle glaucoma.8 They obtained GAT IOP values immediately before CLS fitting and immediately after CLS removal. Pre-CLS GAT IOP was subtracted from post-CLS IOP, and the mean differences between the two measurements did not significantly differ from zero in either the untreated baseline (mean difference =−0.722 mmHg, P=0.083) or travoprost monotherapy setting (mean difference =0.111 mmHg, P=0.884). However, when the mean value of CLS output from the first 50 minutes of CLS wear was subtracted from the mean value of the last 50 minutes of CLS wear, there was a significant difference from zero in both the baseline (mean difference =233.56 arbitrary units, P=0.001) and treatment settings (mean difference =203.34 arbitrary units, P<0.001). The last 50 minutes of CLS wear routinely demonstrated higher device output values than the first 50 minutes of CLS wear. Holló et al also observed that all CLS curves showed a significant trend for time-dependent increase in sensor output value. Their results suggest that the relationship between CLS output value and GAT IOP may not be consistent throughout a 24-hour monitoring session, which may limit the utility of the CLS in detecting circadian IOP variability.
CLS monitoring has been applied to the evaluation of 24-hour IOP patterns in specific subsets of glaucoma patients. A study by Tojo et al evaluated the 24-hour CLS pattern in 11 patients with pseudoexofoliation syndrome and 11 healthy controls.13 They found a significantly greater range of CLS output in the pseudoexfoliation group compared to healthy controls during the 24-hour monitoring period, and during diurnal and nocturnal periods when individually analyzed. In addition, whereas all healthy eyes had peak CLS output during the night, this was true for only 7 of the 11 subjects with pseudoexfoliation syndrome. In a study by Tan et al, 25 patients with primary angle closure glaucoma were evaluated with 24-hour CLS monitoring.14 A nocturnal peak in CLS output was observed among primary angle closure subjects, along with a decrease in device output in the morning and a further decrease during the daytime in most patients. Finally, a study by Agnifili et al examined the 24-hour CLS patterns in 10 healthy patients, 10 patients with POAG, and 10 patients with normal tension glaucoma (NTG).11 They found that CLS outputs were highest during nocturnal monitoring in all three groups, but that the amplitude of the sensor output was greatest among POAG patients. They also observed that patients with glaucoma exhibited significantly longer peaks in CLS output than healthy individuals, and that these peaks tended to occur earlier at night than healthy subjects.
Normal tension glaucoma
Several clinical studies have evaluated CLS patterns among NTG patients. A study by Tojo et al performed 24-hour CLS monitoring in 14 NTG subjects and 12 healthy individuals.12 Significantly higher ranges of CLS output were observed in NTG patients compared to controls over the entire 24-hour observation period, as well as during diurnal and nocturnal periods when analyzed individually. A study by Pajic et al suggested that NTG patients may have greater fluctuations in CLS output in the untreated, compared to the treated, state.15 They evaluated five NTG patients with CLS monitoring in two 24-hour sessions. In the control session, patients were untreated or washed out from medications for at least 6 weeks. The treatment session was subsequently conducted after study subjects had received at least 6 weeks of treatment with an IOP-lowering medication. In all patients, a smaller range of device output values was recorded in the treatment compared to the control session, suggesting a flattening of individual 24-hour IOP profiles upon the introduction of IOP-lowering medications.
Clinical studies have explored the utility of CLS monitoring in evaluating circadian IOP variation in NTG versus healthy subjects. In a study by Tojo et al, 11 of 12 healthy individuals demonstrated peak CLS output during the night, whereas only 8 of 14 NTG patients had a nocturnal peak in CLS output.12 Agnifili et al also evaluated 24-hour CLS output in NTG and healthy individuals, but obtained dissimilar results.11 In their study, 7 of 10 healthy subjects and 8 of 10 NTG patients had peak CLS outputs during the nocturnal period. Although data from clinical trials have suggested higher ranges of and fluctuations in CLS output among NTG patients, additional research would be helpful in further characterizing their circadian CLS output pattern.
Thyroid eye disease
The Triggerfish CLS has also been evaluated as a monitoring device in thyroid eye disease (TED) patients. A study by Parekh et al assessed the safety and tolerability of the CLS during a 24-hour monitoring session in 10 patients with TED.16 All patients in their study tolerated the device, though 50% experienced blurred vision and all experienced conjunctival hyperemia. Recorded 24-hour CLS output was also modeled through cosinor rhythmometry to learn more about IOP rhythm patterns among TED patients. Half of the patients in their study had a significant nocturnal/sleep CLS output peak, and 20% had a significant peak when awake. On average, CLS output peak occurred at 6:30 am in their study cohort. Overall, no significant increase in CLS signal output was observed at wake-to-sleep transitions among their study cohort. However, there was an overall significant decrease in CLS signal output at sleep-to-wake transition. Further research is needed to investigate circadian IOP patterns in TED patients, but the Triggerfish CLS was well tolerated and was not associated with any serious adverse effects within their study cohort.
Assessment of surgical efficacy
The Triggerfish CLS has been evaluated as a method to assess the efficacy of canaloplasty. In a study by Rekas et al, 10 patients were evaluated with 24-hour contact lens monitoring prior to canaloplasty or canaloplasty combined with phacoemulsification.17 Twenty-four-hour contact lens monitoring was repeated at 3 and 12 months postoperatively. Monitoring data were processed to obtain two derived parameters describing the short-term variability of the CLS output – the signal variance and the signal amplitude. The authors explain that a smaller signal variance corresponds to smaller changes measured by the CLS, whereas smaller signal amplitudes reflect a flatter diurnal cycle. The authors observed a significant decrease in CLS signal amplitude between the preoperative and 3-month postoperative visits (P=0.027), and also between the preoperative and 12-month postoperative visits (P=0.031). There was also a significant decrease in signal variance between the preoperative and 3-month postoperative visits (P=0.014). Overall, the study suggested that there was a decreased short-term variability of the CLS output following canaloplasty, as observed at both 3 and 12 months postoperatively. Further research is needed to assess whether CLS output is a useful parameter in assessing surgical efficacy or in guiding treatment interventions among glaucoma patients.
Assessment of medical efficacy
Holló et al evaluated the ability of the Triggerfish CLS to detect the expected IOP reduction in nine patients with either ocular hypertension or POAG treated with topical travoprost eye drops.8 The patients were washed out from IOP-lowering medication for 6 weeks prior to undergoing three baseline 24-hour measurement curves, two with the Triggerfish CLS and one with GAT. The patients were then placed on monotherapy with travoprost eye drops for a 3-month period. Following 3 months of treatment, 24-hour monitoring sessions with the Triggerfish CLS and GAT were repeated. Although the 24-hour Goldmann IOP decreased from a mean of 22.9–18.2 mmHg following travoprost monotherapy, there was no significant change in the mean or variability of the CLS output before and after travoprost therapy. In addition, the authors found no correlation between CLS monitoring curves and GAT values prior to or following treatment with travoprost. The results from their study suggest that the CLS may not be effective in detecting medication-related reductions in IOP.
A second study by Pajic et al also evaluated 24-hour monitoring with the CLS among five NTG patients in the presence and absence of their normal IOP-lowering medications.15 At a control session, patients underwent 24-hour monitoring with the CLS after a minimum washout period of 6 weeks. Following the initial monitoring session, patients resumed their normal glaucoma medications. Two patients in the study were treated with daily topical latanoprost eye drops, two were treated with daily topical travoprost eye drops, and one patient took daily topical travoprost in addition to topical dorzolamide eye drops, which were dosed twice daily. Twenty-four-hour monitoring was then repeated after at least 6 weeks of medication therapy. GAT values were significantly lower in the treated session compared to the control session. Mean GAT IOP taken prior to the 24-hour control monitoring session was 17.8 mmHg and decreased to a mean of 11.4 mmHg prior to the treated monitoring session with the CLS (P=0.001). In all patients, GAT IOP levels were lower in the treated compared to the control session. The authors did not find that the absolute values recorded by the CLS were directly proportional to IOP. In their study, three of the five patients had output values that were generally higher in the treated session compared to the control session. The authors argue that there is some variability in the electric output of the device strain gauge at equal stretch values between each CLS. They explain that the device is intended for observation of relative changes and that device output values should not be considered in isolation, but instead in conjunction with reference tonometer values. The authors did observe that there were significantly lower coefficients of variation in the treated session compared to the control session. In addition, they noted significantly smaller ranges between the maximal and minimal device output values when comparing the treated to control session, suggesting reduction in fluctuation profiles following treatment.
Assessment of laser efficacy
A prospective cohort study by Lee et al evaluated 18 NTG patients on medical management with 24-hour CLS monitoring 1 week prior to and 1 month following selective laser trabeculoplasty (SLT).18 In their analysis, the authors fit cosine functions to the CLS curves of each individual, and the amplitudes of the CLS patterns were compared before and after SLT. The subjects’ normal IOP-lowering medications were not adjusted during the study. Participants were divided into two groups: an SLT success group, which included participants that experienced a ≥20% reduction in GAT IOP 1 month after SLT, and an SLT nonsuccess group, which included all other participants. SLT was successful in 8 of the 18 patients. Within the SLT success group, the amplitude of the fitted cosine function to the CLS curves was reduced by 24.6% 1 month after SLT. In contrast, there was an increase in the amplitude of the fitted cosine by 19.2% in the non-SLT success group. The study also evaluated diurnal, nocturnal, and 24-hour variability of the CLS patterns in the SLT success and SLT nonsuccess groups prior to and following treatment. There were no significant differences between pre- and post-SLT CLS pattern variabilities within the SLT success group. There was, however, a significant increase in diurnal variability of the CLS pattern observed following SLT in the nonsuccess group.
A second clinical study by Tojo et al evaluated the CLS monitoring patterns of 10 patients with NTG prior to and at least 1 month following SLT.19 Although mean IOP significantly decreased following SLT, the 24-hour range of the CLS IOP fluctuations did not change significantly. In their study, four patients had decreased the range of CLS output following SLT, and six patients had increased the range of CLS output. When variabilities in the diurnal and nocturnal CLS patterns were individually assessed, the authors found no significant change in diurnal variability following SLT. However, there was a significant decrease in nocturnal variability in the CLS output following SLT. Eight patients in their study experienced decreased nocturnal ranges in CLS output following SLT.
Functional parameters
CLS monitoring has also been investigated in relation to structural and functional disease progression in glaucoma. In a study by Tan et al, 25 patients with primary angle closure glaucoma underwent a single 24-hour monitoring session with the CLS.14 Subjects were also evaluated with optical coherence tomography (OCT)-derived retinal nerve fiber layer (RNFL) thickness measurements and serial automated visual fields with the Humphery visual field (HVF; Carl Zeiss Meditec) perimeter. The presence or absence of significant changes in HVF mean deviation (MD), HVF visual field index (VFI), and OCT-measured RNFL thickness guided each participant’s classification as having either stable or progressive disease. Between patients with progressive and stable MD, significant differences in the gradients of the CLS output curves were found between 10:00 pm and 11:00 pm and between 7:00 am and 8:00 am. Between patients with progressive and stable HVF VFI, there were significant differences in sensor curve gradients observed from 3:00 pm to 4:00 pm and from 6:00 am to 8:00 am. Finally, when comparing the progressive and stable RNFL groups, there were significant differences in the CLS output curve gradients from 12:00 am to 1:00 am and from 2:00 am to 3:00 am. Overall, the study observed that there were larger fluctuations in CLS output curves among participants with progressive disease during bedtime and wake-up periods.
Visual field progression was compared to 24-hour CLS output in a study by De Moraes et al.20 Their cross-sectional study analyzed 24-hour CLS output from 34 patients with POAG who had previously undergone eight or more HVF studies. Patients were classified as fast or slow visual field progressors based on pointwise progression of the visual field and the global rate of visual field change (mean sensitivity). CLS output parameters were compared to changes in MD on serial HVFs from subjects in the study. The authors identified six CLS parameters (number of large peaks while awake, mean peak ratio while asleep, mean peak ratio while awake, wake-to-sleep slope, area under the receiver operating characteristic curve during sleep, and variability from the mean while awake) to be significantly associated with faster visual field progression (P=0.10, 0.012, 0.078, 0.176, 0.158, and 0.241, respectively). A regression model based on five of these CLS parameters was noted to be a better predictor of visual field progression than a model based on GAT parameters (R2=0.41 versus R2=0.17). Their study suggests potential utility for the CLS in detecting glaucomatous eyes at higher risk for visual field loss.
Costs
The Triggerfish CLS, orbital antenna, and recorder sleeve are single-use equipment. The United Kingdom’s National Institute for Health and Care Excellence website estimates that each 24-hour use of the Triggerfish CLS costs between $526 and $682 in single-use equipment.21 This would be in addition to an upfront cost of ~$7310 for the reusable data recorder, recorder cable, and software. Currently, there are no studies on the cost-effectiveness of the Triggerfish CLS in the management of patients with ocular hypertension or glaucoma.
Conclusion
The Triggerfish CLS is a safe and well-tolerated device for monitoring IOP-related patterns in healthy and glaucomatous individuals. Although discrete clinical measurement of IOP has been a cornerstone in guiding treatment of glaucomatous individuals for generations, it is an incomplete approach, as many patients experience progressive vision loss despite seemingly normal office-measured IOP. The Triggerfish CLS greatly expands the available information to the clinician with regard to IOP-related patterns. Clinical studies continue to help advance understanding of how information obtained from the CLS can be analyzed, interpreted, and applied. The utility of this device in identifying high-risk patients and monitoring their response to treatment interventions continue to be areas of promising research.
Disclosure
The authors report no conflicts of interest in this work.
References
Hughes E, Spry P, Diamond J. 24-hour monitoring of intraocular pressure in glaucoma management: a retrospective review. J Glaucoma. 2003;12(3):232–236. | ||
Mansouri K, Weinreb RN, Liu JH. Efficacy of a contact lens sensor for monitoring 24-h intraocular pressure related patterns. PLoS One. 2015;10(5):e0125530. | ||
Mansouri K. The road ahead to continuous 24-hour intraocular pressure monitoring in glaucoma. J Ophthalmic Vis Res. 2014;9(2):260–268. | ||
Ittoop SM, SooHoo JR, Seibold LK, Mansouri K, Kahook MY. Systematic review of current devices for 24-h intraocular pressure monitoring. Adv Ther. 2016;33(10):1679–1690. | ||
Press Announcements – FDA permits marketing of device that senses optimal time to check patient’s eye pressure. Available from: http://www.fda.gov/NewsEvents/Newsroom/PressAnnouncements/ucm489308.htm. Accessed November 27, 2016. | ||
Mottet B, Aptel F, Romanet JP, Hubanova R, Pépin JL, Chiquet C. 24-hour intraocular pressure rhythm in young healthy subjects evaluated with continuous monitoring using a contact lens sensor. JAMA Ophthalmol. 2013;131(12):1507–1516. | ||
Leonardi M, Pitchon EM, Bertsch A, Renaud P, Mermoud A. Wireless contact lens sensor for intraocular pressure monitoring: assessment on enucleated pig eyes. Acta Ophthalmol. 2009;87(4):433–437. | ||
Holló G, Kóthy P, Vargha P. Evaluation of continuous 24-hour intraocular pressure monitoring for assessment of prostaglandin-induced pressure reduction in glaucoma. J Glaucoma. 2014;23(1):e6–e12. | ||
Lorenz K, Korb C, Herzog N, et al. Tolerability of 24-hour intraocular pressure monitoring of a pressure-sensitive contact lens. J Glaucoma. 2013;22(4):311–316. | ||
Mansouri K, Medeiros FA, Tafreshi A, Weinreb RN. Continuous 24-hour monitoring of intraocular pressure patterns with a contact lens sensor: safety, tolerability, and reproducibility in patients with glaucoma. Arch Ophthalmol. 2012;130(12):1534–1539. | ||
Agnifili L, Mastropasqua R, Frezzotti P, et al. Circadian intraocular pressure patterns in healthy subjects, primary open angle and normal tension glaucoma patients with a contact lens sensor. Acta Ophthalmol. 2015;93(1):e14–e21. | ||
Tojo N, Abe S, Ishida M, Yagou T, Hayashi A. The fluctuation of intraocular pressure measured by a contact lens sensor in normal-tension glaucoma patients and nonglaucoma subjects. J Glaucoma. 2017;26(3):195–200. | ||
Tojo N, Hayashi A, Otsuka M, Miyakoshi A. Fluctuations of the intraocular pressure in pseudoexfoliation syndrome and normal eyes measured by a contact lens sensor. J Glaucoma. 2016;25(5):e463–e468. | ||
Tan S, Yu M, Baig N, Chan PP, Tang FY, Tham CC. Circadian intraocular pressure fluctuation and disease progression in primary angle closure glaucoma. Invest Ophthalmol Vis Sci. 2015;56(8):4994–5005. | ||
Pajic B, Pajic-Eggspuchler B, Haefliger I. Continuous IOP fluctuation recording in normal tension glaucoma patients. Curr Eye Res. 2011;36(12):1129–1138. | ||
Parekh AS, Mansouri K, Weinreb RN, Tafreshi A, Korn BS, Kikkawa DO. Twenty-four-hour intraocular pressure patterns in patients with thyroid eye disease. Clin Exp Ophthalmol. 2015;43(2):108–114. | ||
Rekas M, Danielewska ME, Byszewska A, et al. Assessing efficacy of canaloplasty using continuous 24-hour monitoring of ocular dimensional changes. Invest Ophthalmol Vis Sci. 2016;57(6):2533–2542. | ||
Lee JW, Fu L, Chan JC, Lai JS. Twenty-four-hour intraocular pressure related changes following adjuvant selective laser trabeculoplasty for normal tension glaucoma. Medicine (Baltimore). 2014;93(27):e238. | ||
Tojo N, Oka M, Miyakoshi A, Ozaki H, Hayashi A. Comparison of fluctuations of intraocular pressure before and after selective laser trabeculoplasty in normal-tension glaucoma patients. J Glaucoma. 2014;23(8):e138–e143. | ||
De Moraes CG, Jasien JV, Simon-Zoula S, Liebmann JM, Ritch R. Visual field change and 24-hour IOP-related profile with a contact lens sensor in treated glaucoma patients. Ophthalmology. 2016;123(4):744–753. | ||
The SENSIMED Triggerfish contact lens sensor for continuous 24-hour recording of ocular dimensional changes in people with or at risk of developing glaucoma|technology-overview|Advice|NICE. Available from: https://www.nice.org.uk/advice/mib14/chapter/technology-overview. Accessed December 15, 2016. |
 © 2017 The Author(s). This work is published and licensed by Dove Medical Press Limited. The
full terms of this license are available at https://www.dovepress.com/terms
and incorporate the Creative Commons Attribution
- Non Commercial (unported, 3.0) License.
By accessing the work you hereby accept the Terms. Non-commercial uses of the work are permitted
without any further permission from Dove Medical Press Limited, provided the work is properly
attributed. For permission for commercial use of this work, please see paragraphs 4.2 and 5 of our Terms.
© 2017 The Author(s). This work is published and licensed by Dove Medical Press Limited. The
full terms of this license are available at https://www.dovepress.com/terms
and incorporate the Creative Commons Attribution
- Non Commercial (unported, 3.0) License.
By accessing the work you hereby accept the Terms. Non-commercial uses of the work are permitted
without any further permission from Dove Medical Press Limited, provided the work is properly
attributed. For permission for commercial use of this work, please see paragraphs 4.2 and 5 of our Terms.