Back to Journals » Research and Reports in Urology » Volume 11
The relationship between kidney stones and dietary habits
Authors Al-Kazwini AT, Al-Arif MS, Abu-Mweis SS ![]() , Al-Hammouri TF
, Al-Hammouri TF ![]()
Received 9 April 2019
Accepted for publication 7 June 2019
Published 25 July 2019 Volume 2019:11 Pages 201—214
DOI https://doi.org/10.2147/RRU.S211483
Checked for plagiarism Yes
Review by Single anonymous peer review
Peer reviewer comments 2
Editor who approved publication: Dr Jan Colli
This article has been Retracted
Akeel T Al-Kazwini,1 Maan S Al-Arif,2 Suhad S Abu-Mweis,3 Tarek F Al-Hammouri4
1Department of Biomedical Engineering, School of Applied Medical Sciences, German Jordanian University, Amman 11180, Jordan; 2Department of Dentistry, Al-Byan University, Baghdad, Iraq; 3Department of Clinical Nutrition and Dietetics, The Hashemite University, Zarqa, Jordan; 4Royal Berkshire Hospital, NHS Foundation Trust, Reading, England, UK
Background: Kidney stones are considered a serious disease, due to the great discomfort that they can cause and may even lead to renal failure. Dietary habits could be the reason behind stone formation in kidneys.
Methods: Twelve kidney stone samples were collected and analyzed together with typical foodstuffs frequently consumed in the Koya area using the x-ray fluorescent technique.
Results: All the analyzed stones were found to be calcium-based. The results show that elements such as Ca, Zr, S and Cl can be regarded as the core elements for the formation of kidney stones in Koya city in north Iraq.
Conclusion: Many dietary foods and drink frequently consumed by the people in Koya city were observed to contain the core elements. However, more studies are needed to demonstrate if dietary intake may be the main source for kidney stone formation.
Keywords: XRF, kidney stone, core elements, dietary
Background
Kidney stone disease is a common disease that affects a large number of people and it has been classified as one of the illnesses that can cause much pain to human beings. In addition, kidney stone disease can be one of the major causes of chronic kidney disease and chronic kidney failure.1 Worldwide, kidney stone incidence increases from east to west. In Asian countries, from 1% to 5% of the societies, from 5% to 10% in Europe and 13% of the societies in North America are affected by kidney stone formation.2 These differences are related to the socioeconomic conditions of these countries, age, sex, occupation, social class, climate, dietary habits and other geographic factors.2,3 In general, kidney stones affect up to 10%–12% of men and 5%–6% of women.4
There are four main types of renal stones, calcium-based stones, struvite, uric acid and cysteine as a ligand for calcium element.5 The most common stone type is the calcium base which is usually combined with oxalate, phosphate or carbonate to form stones,6 about 70%–80% of stones are composed of calcium oxalate. Some element concentrations may increase or decrease the formation of kidney stones. It is well known that magnesium (Mg) reduces the development of kidney stone disease (acts as an inhibitor) while elements such as calcium (Ca), zirconium (Zr), phosphorous (P), chlorine (Cl), iron (Fe), silicon (Si) and zinc (Zn) may increase kidney stone formation.7,8 Kidney stones begin as minute crystals inside the kidney from substances such as calcium and oxalate that have been filtered from the blood by the kidney into the urine. The salts bind together, creating a central core over which additional layers of material can begin to grow.9 The therapy of the stone disease is usually based on the analysis of urinary calculi, permitting proper management of the disease and prevention of its recurrence.10,11
Singh et al12,13 identified many elements including calcium (Ca), magnesium (Mg), manganese (Mn), copper (Cu), iron (Fe), zinc (Zn), strontium (Sr), sodium (Na), potassium (K), phosphorus (P), sulfur (S) and chlorine (Cl) in Indian kidney stone patients. Oztoprak et al14 found P, S, Si, Zn and titanium (Ti) as common elements in the stones of patients from Turkey. In Iran, Ca and P were the main elements in kidney stones and Zr and Sr were the most dominant trace metals.15 In Jordan, analysis of stone samples from 110 patients revealed that Ca was the main constituent of stones (48% concentration) and other metals such as Na (1.56%), K (0.9%), Mg (3.08%), Fe (1.17%), Al (0.49%), Zn (0.7%), Cu (0.19%), Mn (0.029%), P (10.35%), S (1.88%), Sr (0.306%), Mo (0.2%), Cr (0.146%), Co (0.05%) and Ni (0.014%) also presented in the tested kidney stones.16 While a study in Czech Republic shows that phosphate was the most important metal-bearing mineral in the examined kidney stones and other metals including Fe, Zr, Mo, Cu, Cd, Se, Sn and Hg was also found.17 It seems that element composition of kidney stones differs by region.
This study was performed in Koya city-North Iraq, where the exact reasons and number of kidney stone disease cases are not clear due to the absence of a regular national registry data. The aim of this study is to investigate the core elements in kidney stones and to explore its relationship with local dietary habits in order to further our understanding of the reasons for developing this disease. Regarding ethical issues, the Ministry of Health administration department committee represented by Dr. Kameran Abbs Jubrael stated that the School of medicine at Koya University had no objection for publishing their patients’ renal stone data.
Methods
In this case study, twelve kidney stones were collected from Koya town hospital after kidney stone operations and analyzed. Stones were crushed separately to a very fine powder and made as pellets by compression using a manual press machine (TP HERZOG) with a 200 KN maximum load. The relative mass concentration percentage of elements contained in local dietary foodstuff and drinking water in Koya city was determined by analyses of samples of vegetables, meat, eggs, bottled water and tap water. The food samples were first dried, crushed to a very fine powder and made as pellets by compression in the same manner as the collected stones. Analytical balance KERN ABT (120-4 M) was used to measure the mass of the powder samples before compression. Pellets were then dried by Lab TEch Universal Drying Oven LDO-060E at a temperature of about 45°C to constant weight to ensure removal of free water.
Twenty drinking water samples were analyzed from Koya City. Ten of them were collected from the most commonly consumed bottled drinking water. The other ten samples were collected from various sources of tap water. A water sample of 8 mL was poured into the sample cell supplied with a base of 4-µm Prolene film. The sample cell was placed into an oven at 45°C for 3 days for the water to evaporate and to allow minerals to precipitate as a uniform thin layer over the Prolene thin film.
All samples were analyzed using Energy Dispersive X-Ray Florescence Rigaku NEX CG machine available at the physics department in Koya University.
The statistical parameters minimum, maximum, mean, SD and percentage coefficient of variation (%CV) were determined after the data distribution passed the normality test (P<0.05) and only for the data containing five or more values. Otherwise, the statistical parameters were labeled as not applicable (NA). The %CV value greater than 100% represents a high variable distribution around the mean, ie, SD exceeds the mean.
Results
The analyzed result for each element was reported as a percentage of the relative mass concentration. The concentration of elements in the twelve different kidney stone samples and their statistical parameters are shown in Tables 1 and 2, respectively. The results show that Ca is the main element in all analyzed stones with a mean ± SD value of 91.03±14.04% and percent coefficient of variation 15%. Other elements appear with lower concentration except for sample 10 where Mg appears with concentration of 46% very close to that for Ca concentration. The X-ray fluorescence results indicate that calcium-based stones are the major type of kidney stone. The minor element Zr is found in all samples with concentration ranging from 0.268% to 0.729%, a mean value of 0.50±0.13% and %CV equals to 27%; phosphorous (P) is found in three samples with concentration ranging from 0.11% to 0.857%, Cl is found in all samples with concentration ranging from 0.001% to 0.156%, a mean value of 0.05±0.04% and %CV equals to 92%; Fe is found in seven samples with concentration ranging from 0.006% to 5.5%, a mean value of 1.03±2.01% and %CV equals to 195%; Si is found in all samples except samples no. 2 and 9 with concentration ranging from 0.008% to 2.28%, a mean value of 0.31±0.70% and %CV equals to 225% and Zn is found in all samples except in sample no.6 with concentration between 0.003% and 1.41%, a mean value of 0.19±0.42% and %CV equals to 220%. Since Ca, Zr, S and Cl are found in all samples of stone analyzed, these elements can be regarded as core elements for the formation of kidney stones in Koya city.
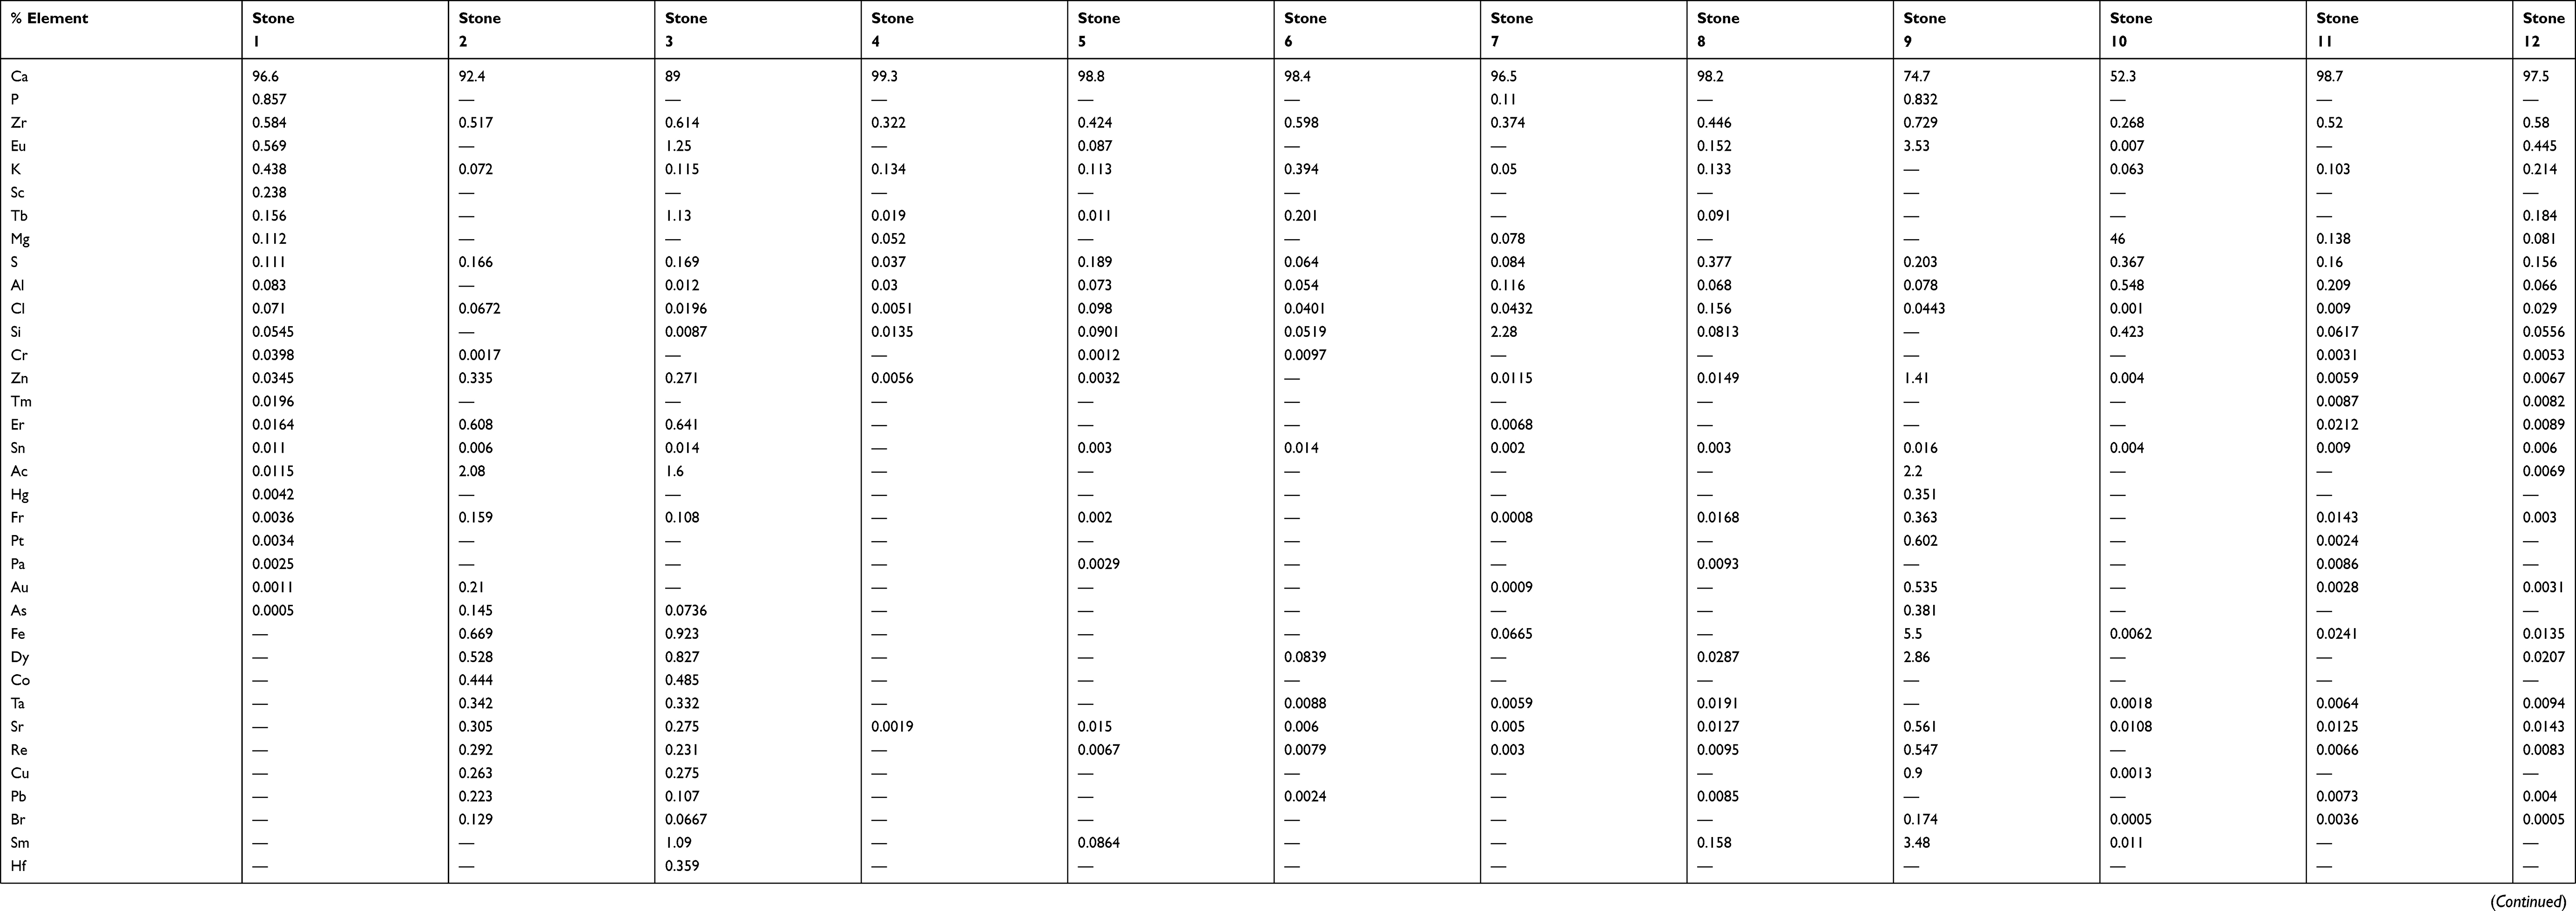 |
Table 1 Percent relative mass concentration for the elements in kidney stones |
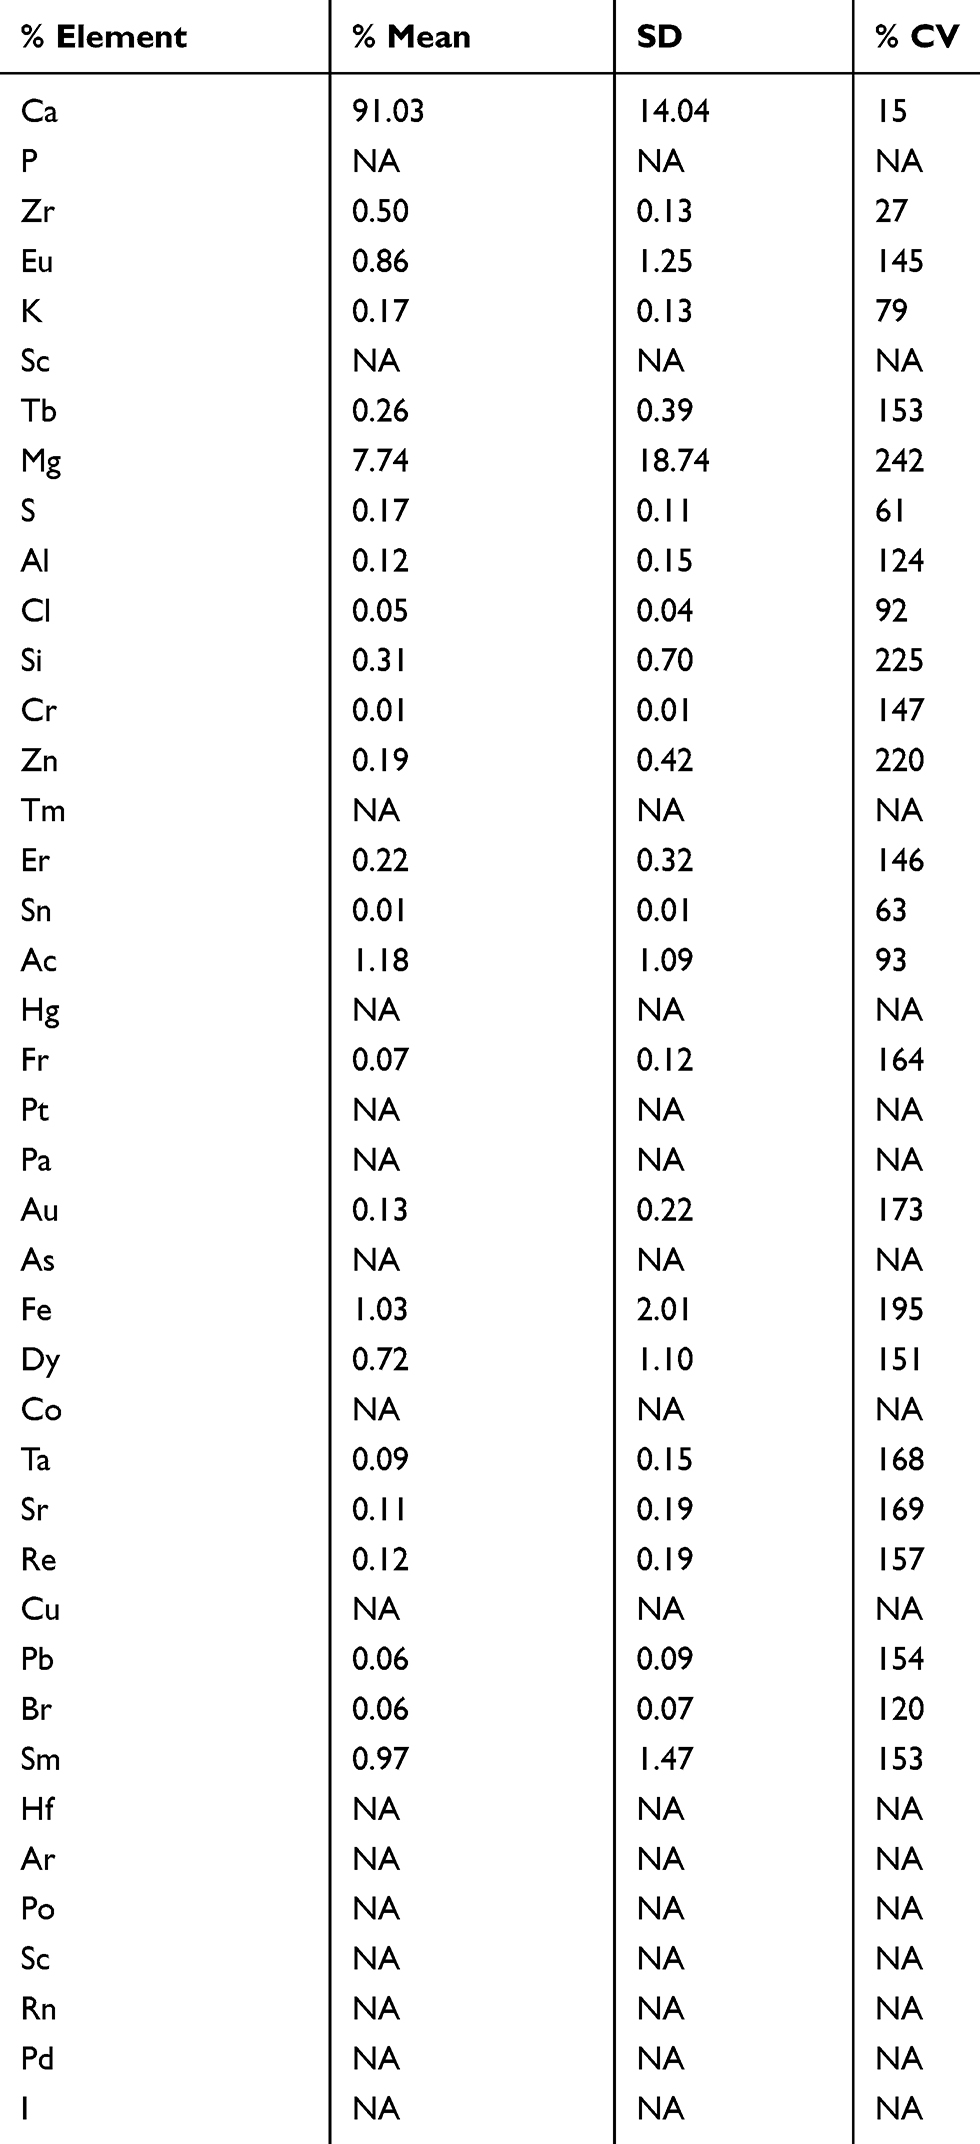 |
Table 2 Statistical parameters for the elements in kidney stones |
A diet rich in minerals increases the risk of kidney stone formation. In order to investigate the causes for the formation of kidney stones, different types of food that are frequently consumed by the people under investigation were analyzed. Various food samples of vegetables, tea, coffee, meats and eggs were analyzed. Tables 3 and 4 show the analysis results of different kinds of vegetables and their statistical parameters, respectively. The core elements Ca, Zr, S and Cl were found in all vegetables analyzed results with concentration ranging between 0.05% and 49% for Ca, a mean value of 8.82±12.21% and %CV equals to 138%; Zr with concentration ranging from 0.21% to 3.13%, a mean value of 0.53±0.70% and %CV equals to 132%; S with concentration ranging from 0.3% to 2.88%, a mean value of 1.11±0.82% and %CV equals to 73% and Cl with concentration ranging from 0.08% to 4.71%, a mean value of 2.04±2.02% and %CV equals to 99%.
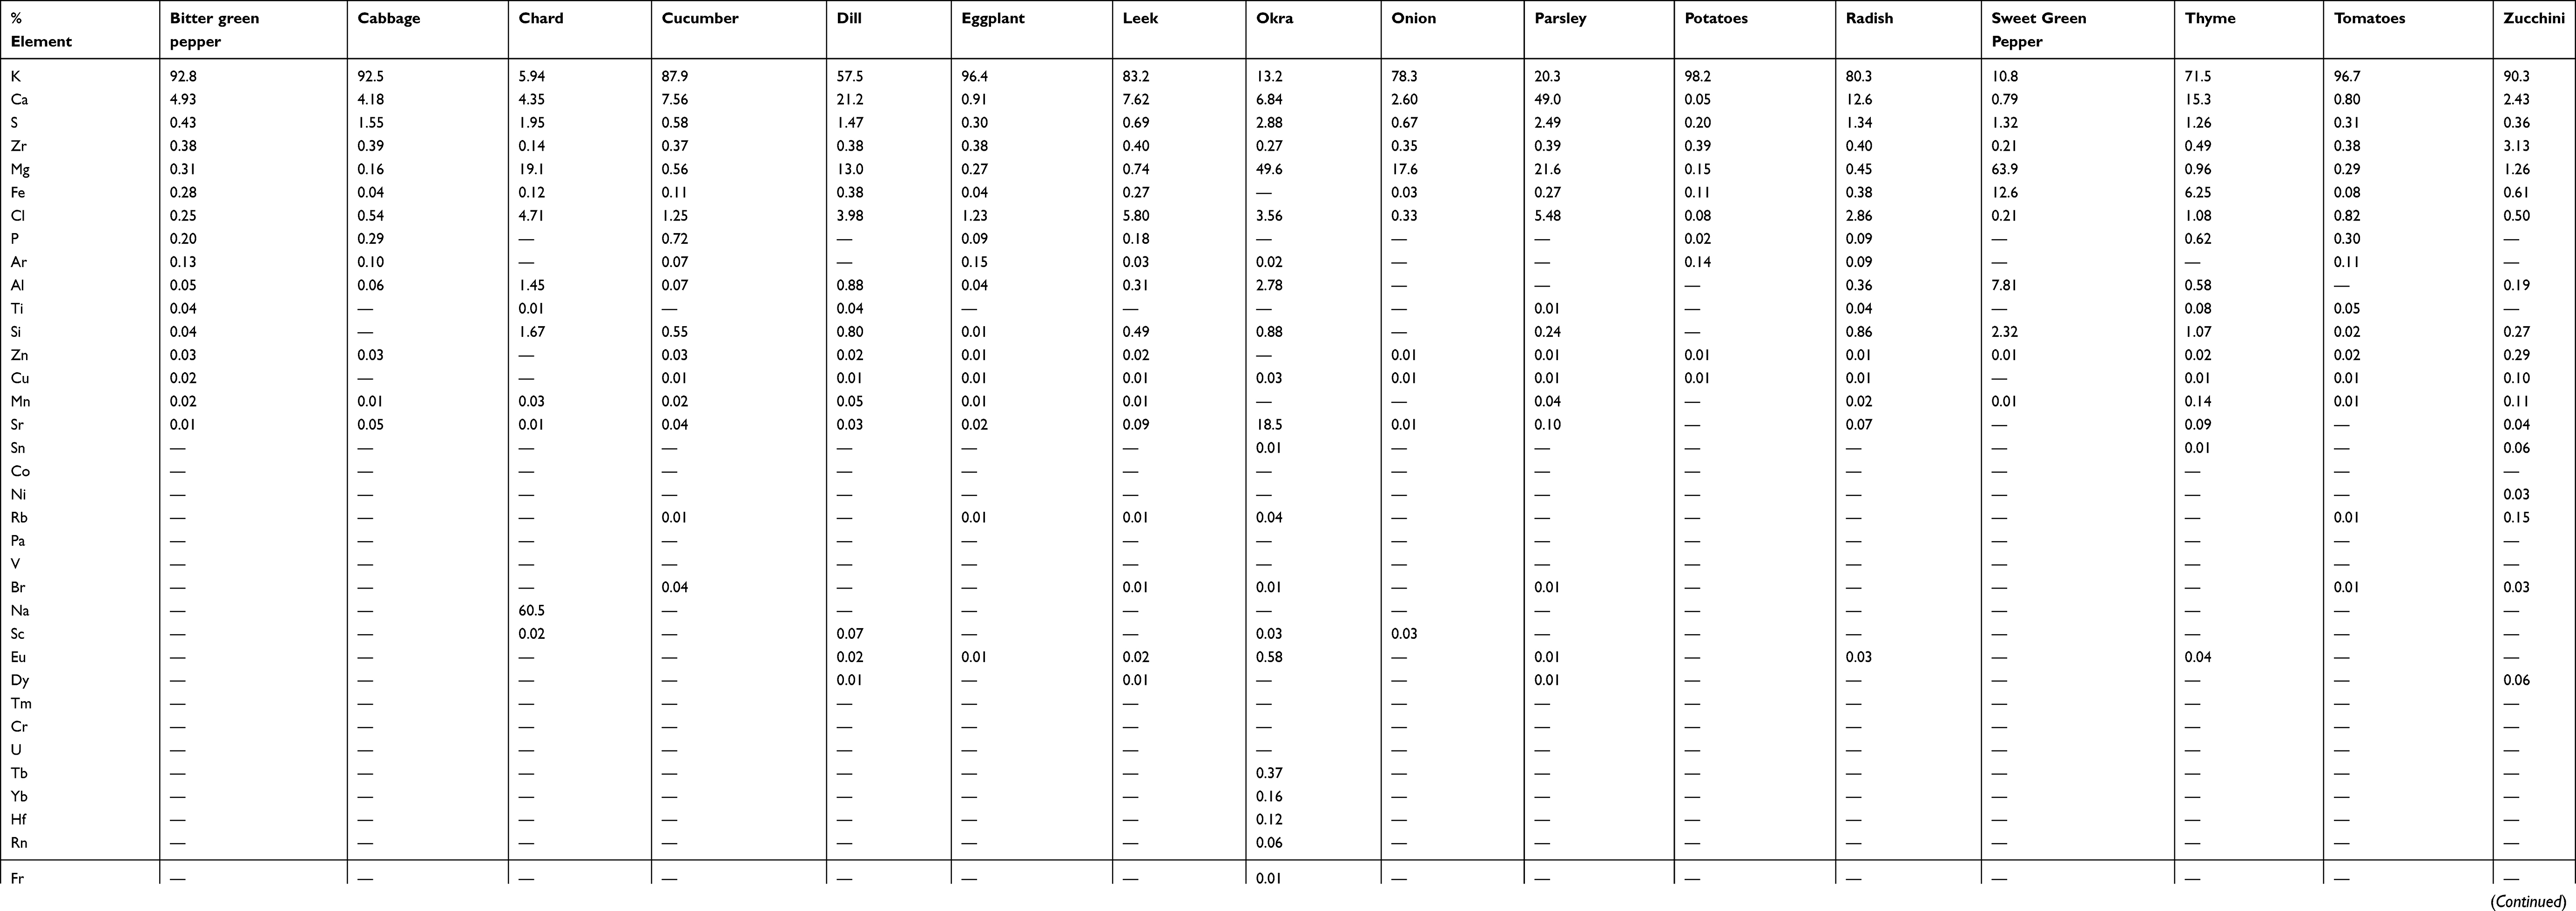 |
Table 3 Percent relative mass concentration for the elements in vegetable samples |
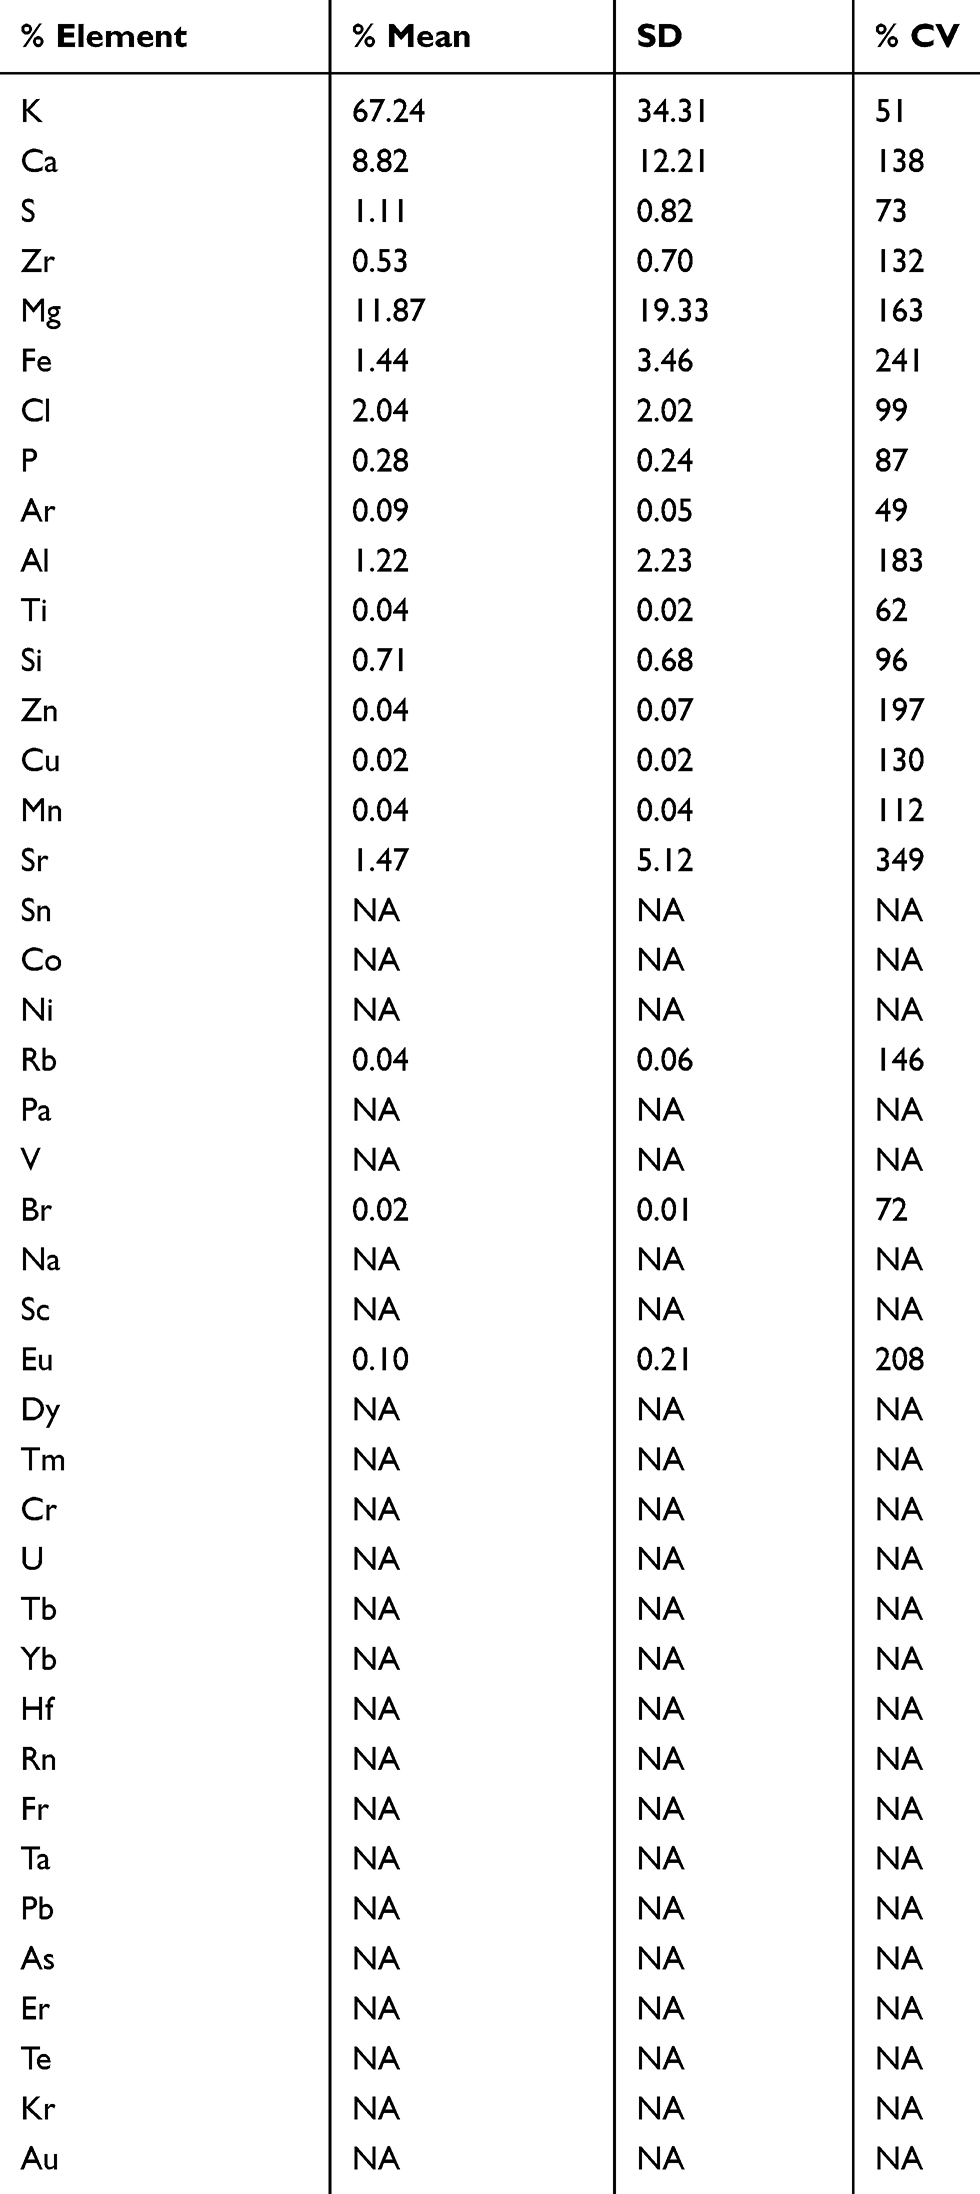 |
Table 4 Statistical parameters for the elements in vegetable samples |
Table 5 shows the results of black tea, coffee and green tea containing the core elements Ca, Zr, S and Cl with concentration ranging from 0.746% to 14.4%, 0.449% to 5.06%, 0.117% to 0.386% and 0.141% to 0.369%, respectively.
 |
Table 5 Percent relative mass concentration for the elements in tea and coffee samples |
Table 6 shows the core elements, Ca, Zr, S and Cl, which are also found in different kinds of meat samples with concentration ranging from 0.231% to 0.676%, 0.414% to 1.53%, 1.49% to 4.12% and 0.416% to 1.38%, respectively.
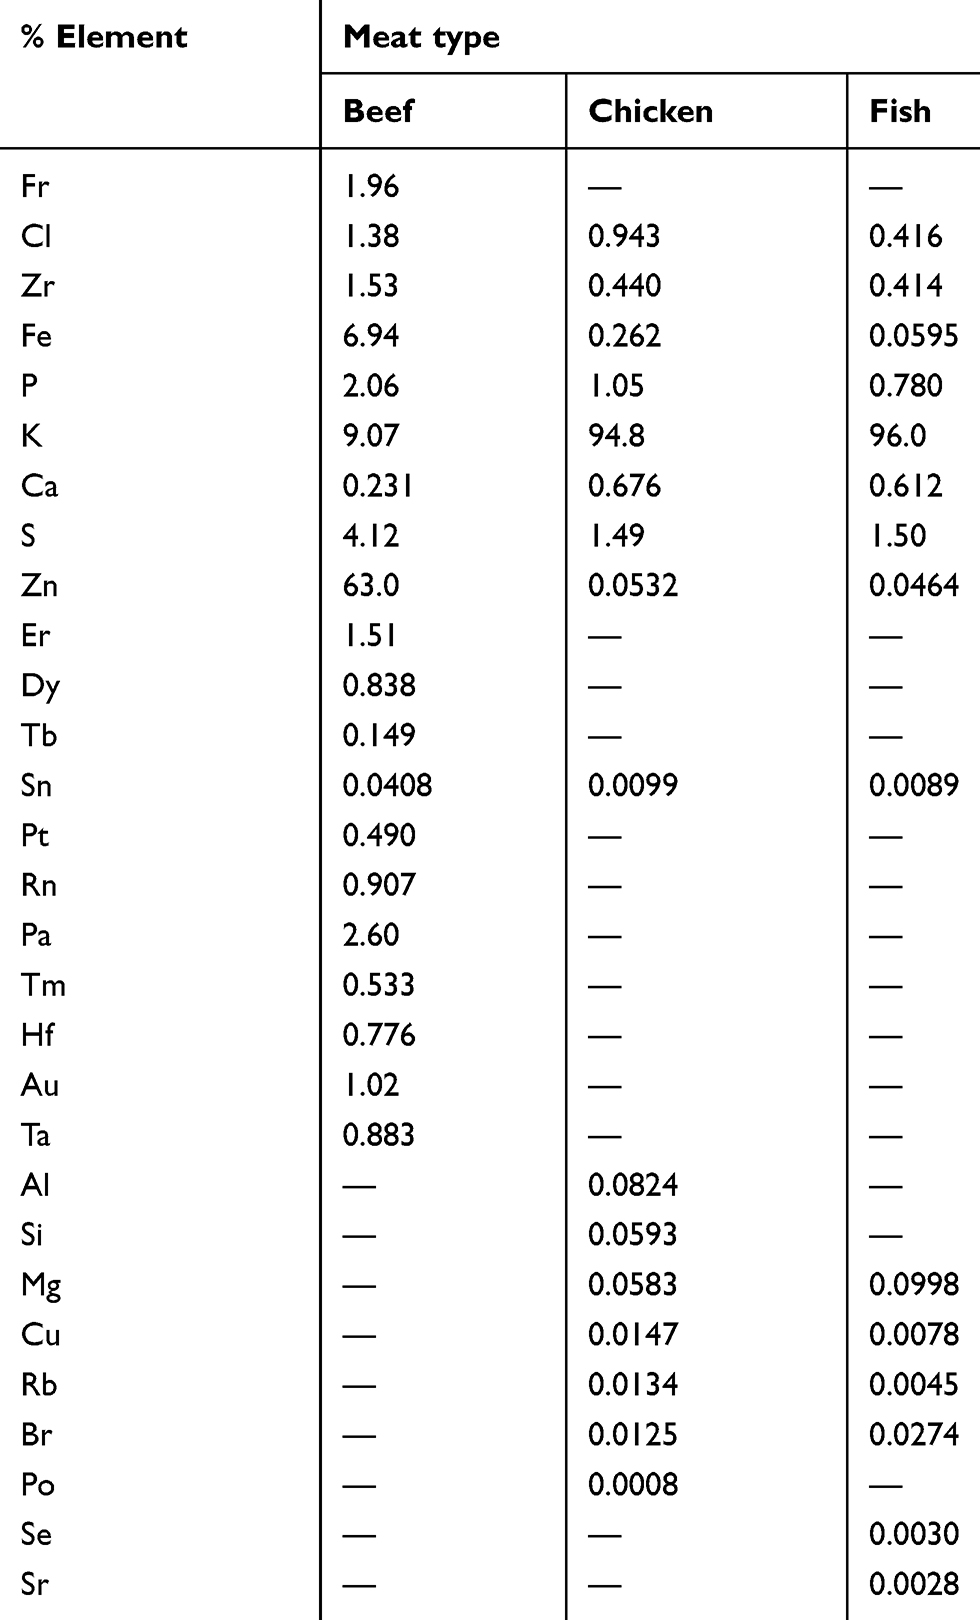 |
Table 6 Percent relative mass concentration for the elements in meat samples |
Table 7 shows the core elements Ca, Zr, S and Cl, which are found in the egg yolk with concentrations of 1.61%, 0.126%, 0.0%, 0.0% and in egg glair (white part) with concentrations of 0.0%, 0.372%, 2.79%, 2.32%, respectively.
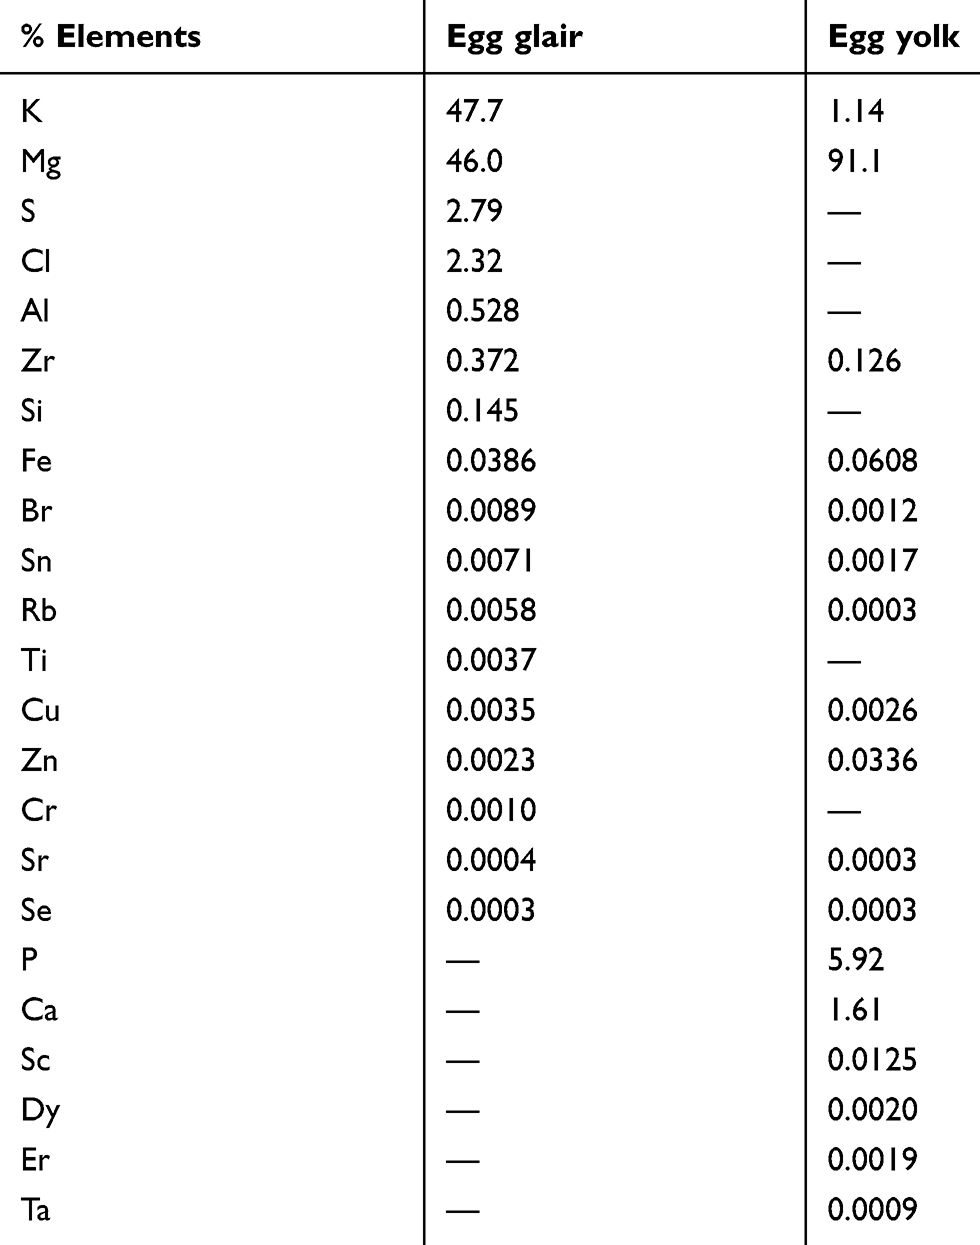 |
Table 7 Percent relative mass concentration for the elements in egg samples |
Tables 8 and 9 show the analysis results of different kinds of bottled water samples and their statistical parameters, respectively. The core elements Ca, Zr, S and Cl were found in all bottled water samples with concentration ranging between 0.0% and 84.3% for Ca, a mean value of 43.49±35.44% and %CV equals to 81%; Zr with concentration ranging from 0.0% to 58.1%, a mean value of 8.13±19.00% and %CV equals to 234%; S with concentration ranging from 0.569% to 39.7%, a mean value of 11.33±13.30% and %CV equals to 117% and Cl with concentration ranging from 0.712% to 30.4%, a mean value of 8.67±9.71% and %CV equals to 112%.
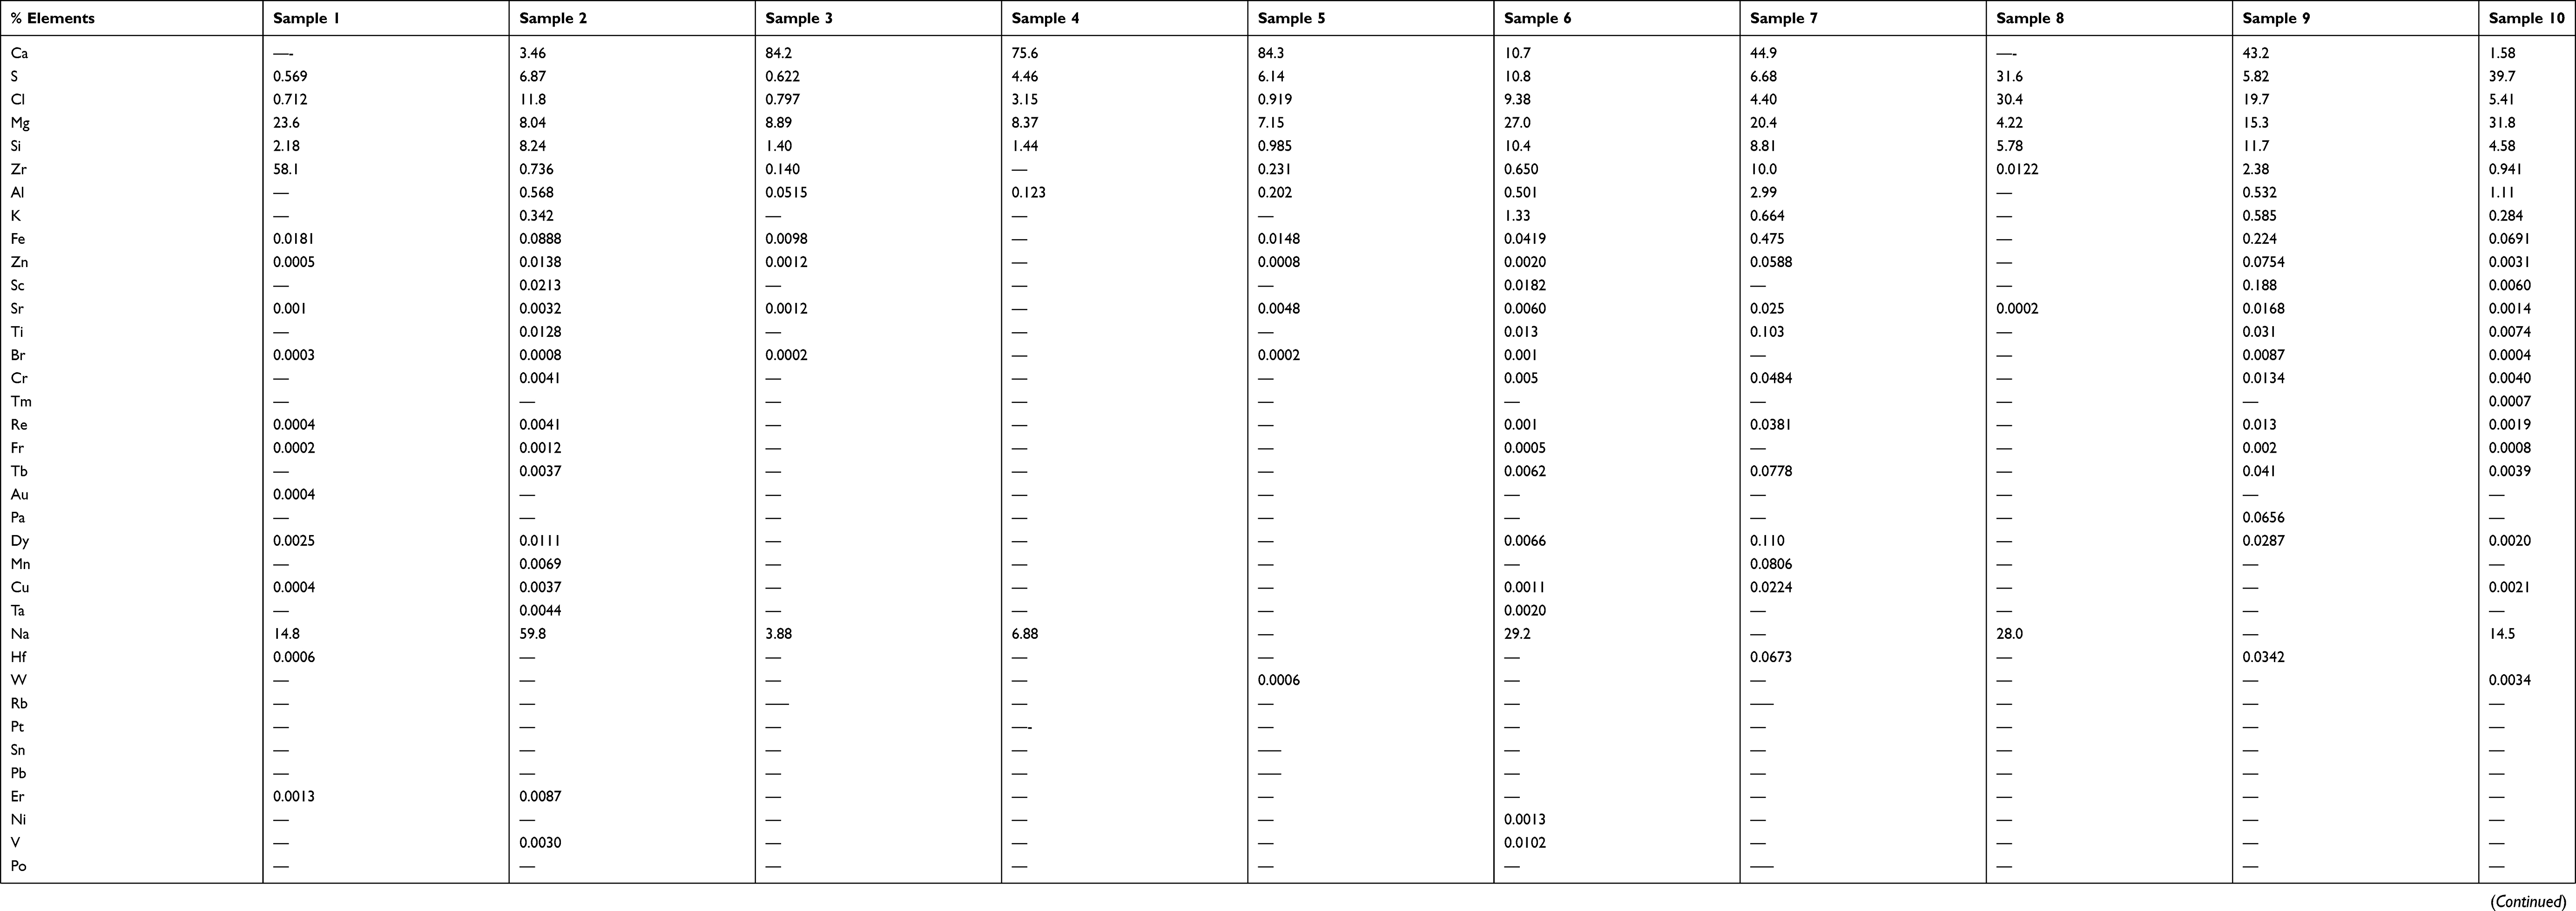 |
Table 8 Percent relative mass concentration of elements contained in bottled water samples |
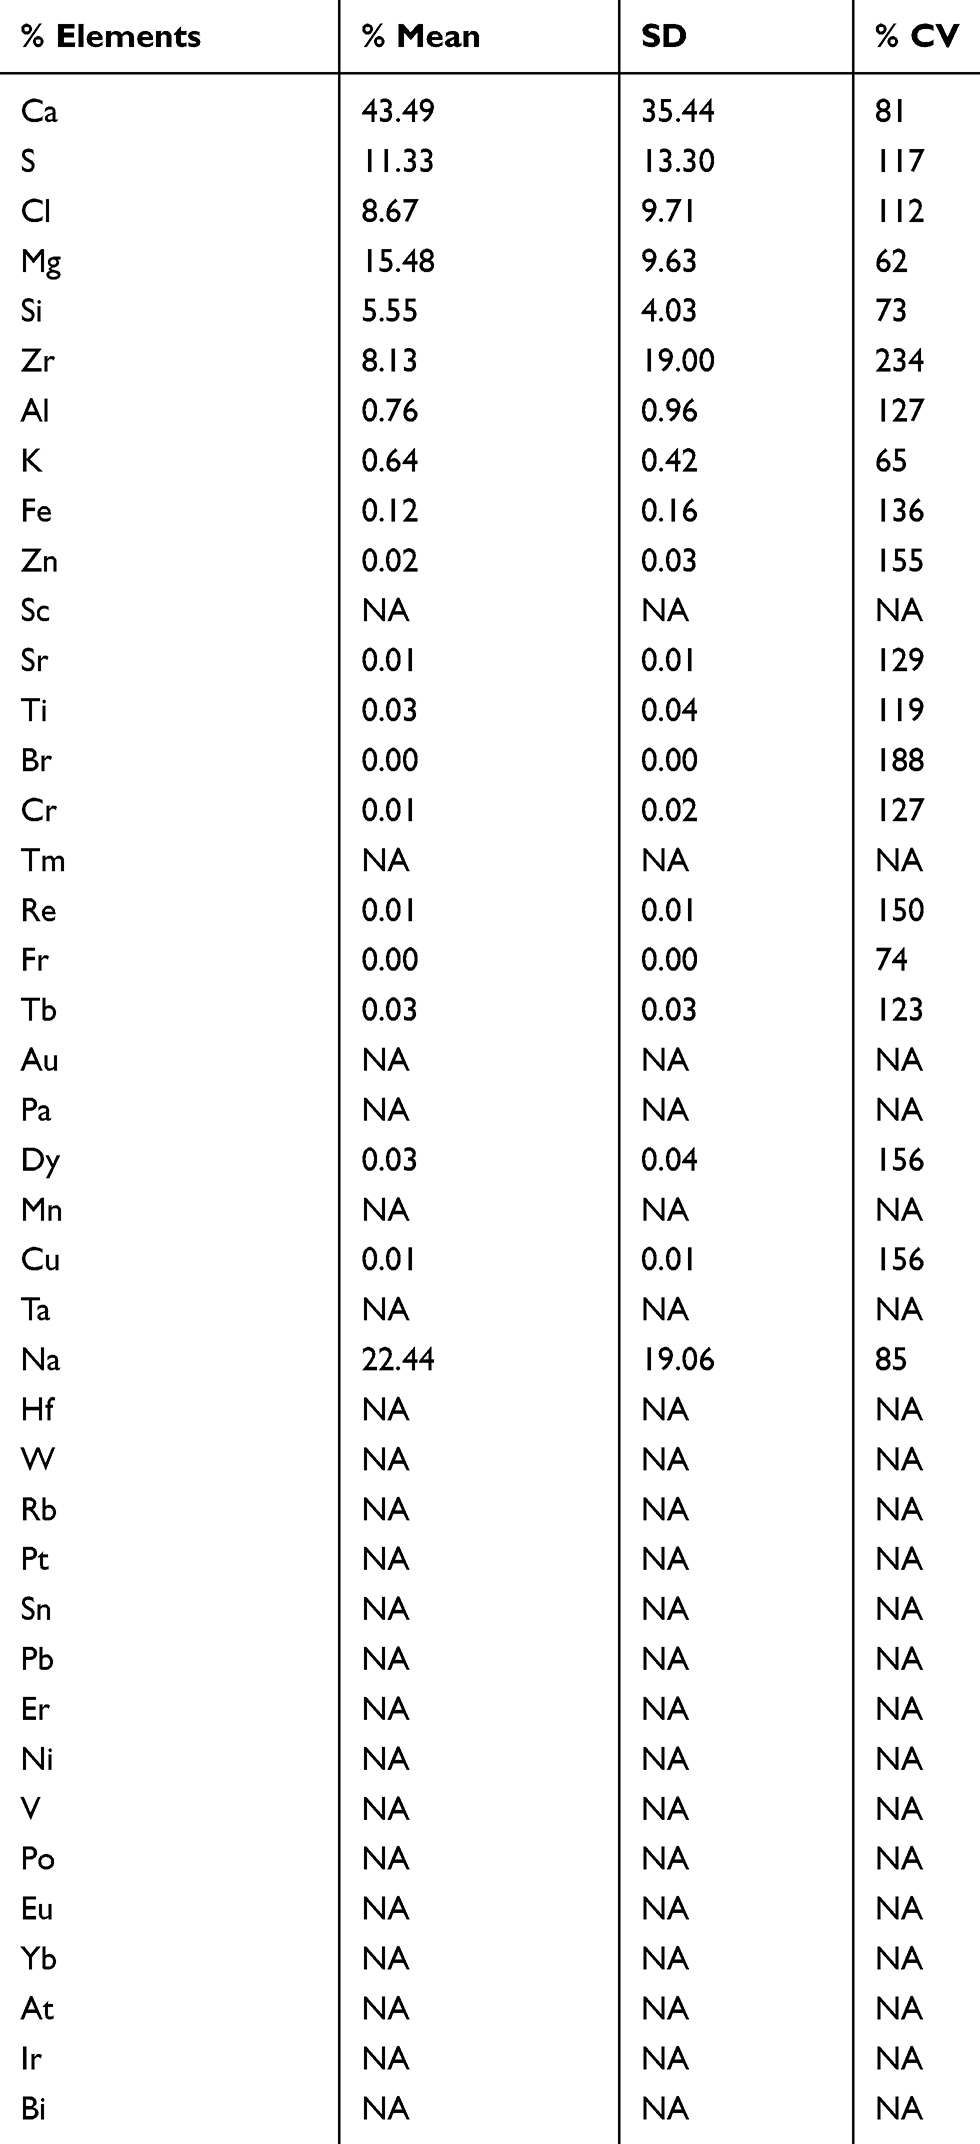 |
Table 9 Statistical parameters for elements contained in bottled water samples |
Tables 10 and 11 show the analysis results of different kinds of tap water samples and their statistical parameters, respectively. The core elements Ca, Zr, S and Cl were found in all tap water samples with concentration ranging between 0.0% and 82.8% for Ca, a mean value of 44.59±26.12% and %CV equals to 59%; Zr with concentration ranging from 0.187% to 3.26%, a mean value of 1.29±1.18% and %CV equals to 92%; S with concentration ranging from 3.39% to 30.5%, a mean value of 16.11±7.89% and %CV equals to 49% and Cl with concentration ranging from 0.952% to 48.6%, a mean value of 16.91±14.84% and %CV equals to 88%.
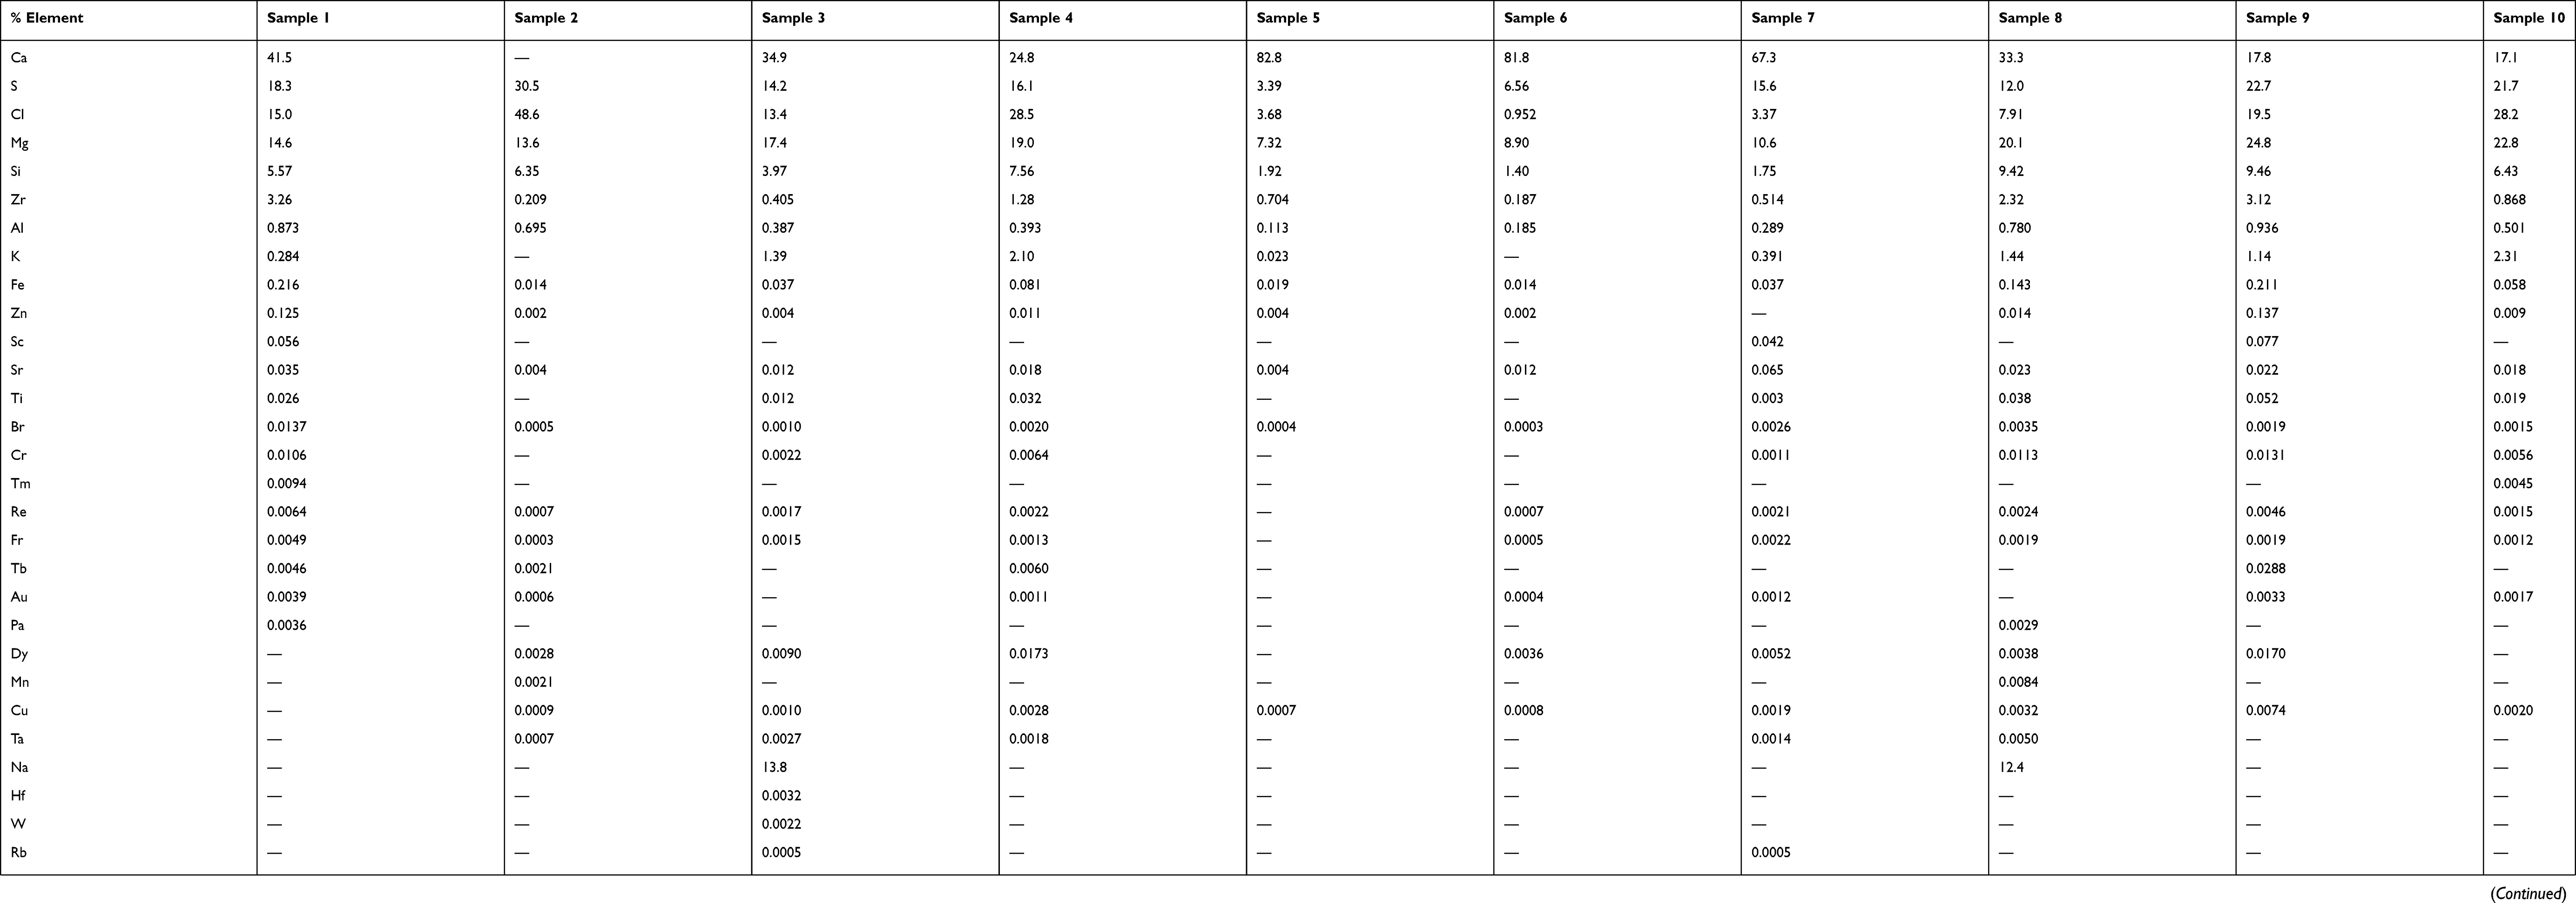 |
Table 10 Percent relative mass concentration of elements contained in tap water samples |
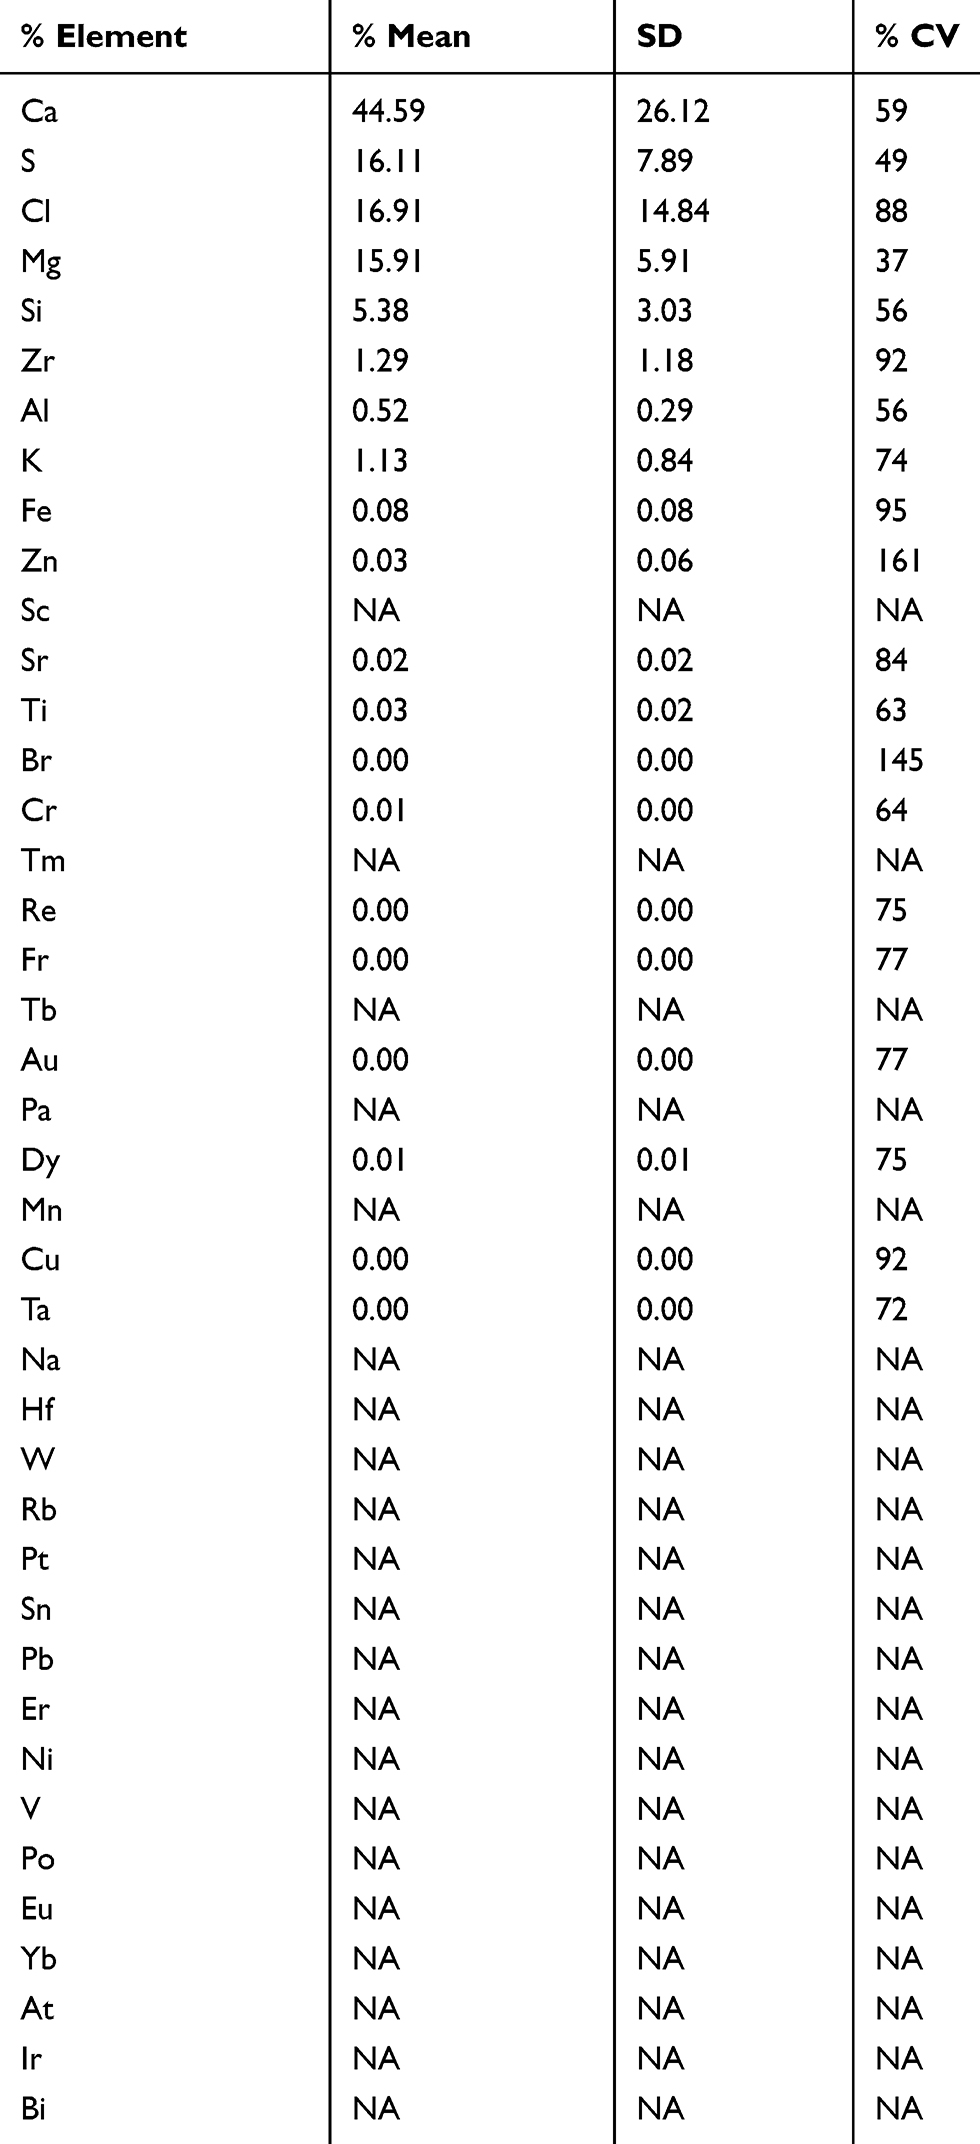 |
Table 11 Statistical parameters for elements contained in tap water samples |
Discussion
The main finding of this study is the identification of the core elements involved in kidney stone formation. Since elements such as Ca, Zr, S and Cl are found in all analyzed stones, those elements are regarded as the core elements in the formation of kidney stones in Koya city. Core elements are also found in dietary material frequently consumed by inhabitants of Koya. The local diet contains high concentrations of the core elements which enhances previous findings regarding the formation of kidney stones.18,19 These findings reflect the correlation between the daily dietary habits and the formation of kidney stones. However, the individual stone formation is dependent on cellular breakdown and metabolism of consumed diet.
In this study, calcium is the main element present in high concentrations in all analyzed stones. Calcium oxalate compounds are the most common type of kidney stones. Sorensen11 shows the role of calcium in kidney stone formation. Hypercalciuria is common among calcium kidney stone formation. Abnormalities in calcium hemostasis at absorption or excretion levels can lead to hypercalciuria. For example, increased calcium absorption due to genetic factors and/or increased intake can lead to hypercalciuria. However, dietary calcium restriction is not recommended since calcium plays a major role in human body functions. For instance, calcium and chlorine play a major role in cardiac muscle contraction. In addition, calcium is the essential element in bone structures.18 Ironically, reducing calcium intake leads to a higher incidence of kidney stone formation due to increased oxalate absorption and thus facilitates calcium oxalate complex formation at the renal site.20–23
In this study, the selected statistical parameters emphasize the significance of dietary intake on kidney stone variability in determining the risk of kidney stone formation and makes it possible to predict the relationships. The statistical data shows the interaction of the mean and SD in determining the risk of kidney stone formation. The mean ± SD values of the four core elements Ca, Zr, S and Cl of the analyzed stone are 91.03±14.04%, 0.5±0.13%, 0.17±0.11% and 0.05±0.04%, where the %CV for these analyses were 15%, 27%, 61% and 92%, respectively. The %CV value for Ca was the less than that for Zr, S and Cl, thus the variation around the mean is low.
In vegetables, dietary intake has a low mean of Ca (8.82%), large SD (12.21) and hence results with a large %CV (138%), which indicates that the risk of kidney stone formation will be high. In contrast, if both the mean and SD are high but with a low %CV, the risk of kidney stone formation will be relatively low. Comparable kinds of discussion can be made for the risk of kidney stone formation, such as, a high mean (Ca in bottle and tap water 43.49% and 44.59%, respectively), will lead to a high risk of kidney stone formation which is relatively insensitive to the magnitude value of the SD (Ca in bottle and tap water 35.44 and 26.12, respectively).
The mean ± SD of the four calcium values in the stones, vegetables, bottled water and tap water are 91.03±14.04%, 8.82±12.21%, 43.49±35.44% and 44.59±26.12% where the %CV for these analyses were 15%, 138%, 81% and 59%, respectively. The result of calcium %CV in the stone is low compared to other dietary products, thus indicating that genetic factors could be influencing the excretion of Ca. However, the mean ± SD values and the %CV of the four core elements found in the stones, vegetables, bottled water and tap water lead to an uneven comparison of risk attributed to dietary factors, and those attributed to genetic factors indicates that the genetic risk exceeds the risk associated with dietary factors.21,22
As a result, eliminating or reducing the intake of these elements will diminish their concentration in the body and alter the human physiology, which eventually can cause various systemic complications and risks. Thus, food, generally, cannot be avoided to prevent the formation of kidney stones. However, different preventive measures have been established in order to reduce the risk of kidney stones, most importantly increasing water intake in order to achieve a urine output of more than 2.5 L/day.24
There was no consensus on whether dietary interventions can reduce the incidence of stone formation or not, including regular dietary calcium intake.20 On the other hand, it is agreed upon that having a balanced diet with moderate amounts of salt and animal protein intake with copious amounts of daily water intake, in addition to maintaining a moderate BMI, are the main factors in reducing the incidence of kidney stone formation and events.25
Conclusion
Many elements including Ca, Zr, S and Cl were identified as core elements in the formation of kidney stones in Koya town. Core elements are also found in dietary material frequently used by people in Koya town. Although consumption of certain diets which contain those elements may elevate the risk of kidney stones, these elements are essential for human body functions.
The study of the chemical composition of kidney stones becomes important for understanding their etiology to prevent recurrence; however, genetic factors should always be considered. In order to complement this work, more regional-based studies are needed to investigate the direct relation between dietary intake and environmental exposure to these metals and the risk of kidney stone formation.
Abbreviation list
XRF, X-rays fluorescence.
Ethics approval and consent to participate
The local ethics committee ruled that No formal ethics approval was required in this particular case. However, I attached a letter from School of medicine Koya University stated that, they have no objection for publishing their patient’s renal stones data.
Availability of data and material
All data generated and/or analyzed during this study are included in this published article.
Acknowledgments
The authors gratefully acknowledge the staff at Koya hospital and Koya University Physics Department for their kind assistance in providing and analyzing the samples in this study. There was no source of funding regarding this study.
Author contributions
All authors contributed to data analysis, drafting or revising the article, gave final approval of the version to be published, and agree to be accountable for all aspects of the work.
Disclosure
The authors report no conflicts of interest in this work.
References
1. Malhotra K. Medical aspects of renal stones. Indian Acad Clin Med. 2008;9:283.
2. Karabacak OR, Dilli A, Saltaş H, Yalçınkaya F, Yörükoğlu A, Sertçelik MN. Stone compositions in Turkey: an analysis according to gender and region. Urology. 2013;82:532–538. doi:10.1016/j.urology.2013.04.059
3. Srivastava A. Anjali determination of minor and trace elements concentration in kidney stones using elemental analysis techniques. ProQuest Diss Theses; Thesis (MS)–Missouri Univ Sci Technol 2014; Publ Number AAT 1568161; ISBN 9781321302493; Source Masters Abstr Int Vol 54-01; 64 p. 2014.
4. Sigurjonsdottir VK, Runolfsdottir HL, Indridason OS, Palsson R, Edvardsson VO. Impact of nephrolithiasis on kidney function. BMC Nephrol. 2015;16:149. doi:10.1186/s12882-015-0126-1
5. Shaker RAM, Al-Gazally M, Al-Jaff EH. The measurement of intact parathyroid hormone and serum electrolytes and their relation with renal stones in Hilla city. Med J Babylon. 2012;9:159–165.
6. Saranya D, Anambiga IV, Suganthan N, Arunai Nambi Raj N, Venkatramanan K. Ultrasonic studies on kidney stone phantom. J Pure Appl Ultrason. 2013;35:49–51.
7. Abbagani S, Gundimeda SD, Varre S, Ponnala D, Mundluru HP. Kidney stone disease: etiology and evaluation. Int J Appl Biol Pharm Technol. 2010;1:175–182.
8. Deshmukh SR, Khan ZH. Evaluation of urinary abnormalities in nephrolithiasis patients from Marathwada region. Indian J Clin Biochem. 2006;21:177–180. doi:10.1007/BF02913091
9. Reilly R
10. Daudon M, Bazin DC. Application of physical methods to kidney stones and Randall’s plaque characterization. In: Urolithiasis. London: Springer London; 2012:683–707.
11. Sorensen MD. Calcium intake and urinary stone disease. Transl Androl Urol. 2014;3:235–240. doi:10.3978/j.issn.2223-4683.2014.06.05
12. Singh VK, Rai PK. Kidney stone analysis techniques and the role of major and trace elements on their pathogenesis: a review. Biophys Rev. 2014;6:291–310. doi:10.1007/s12551-014-0144-4
13. Singh VK, Rai AK, Rai PK, Jindal PK. Cross-sectional study of kidney stones by laser-induced breakdown spectroscopy. Lasers Med Sci. 2009;24:749–759. doi:10.1007/s10103-008-0635-2
14. Oztoprak BG, Gonzalez J, Yoo J, et al. Analysis and classification of heterogeneous kidney stones using laser-induced breakdown spectroscopy (LIBS). Appl Spectrosc. 2012;66:1353–1361. doi:10.1366/12-06679
15. Keshavarzi B, Yavarashayeri N, Irani D, Moore F, Zarasvandi A, Salari M. Trace elements in urinary stones: a preliminary investigation in Fars province, Iran. Environ Geochem Health. 2015;37:377–389. doi:10.1007/s10653-014-9654-z
16. Abboud IA. Concentration effect of trace metals in Jordanian patients of urinary calculi. Environ Geochem Health. 2008;30:11–20. doi:10.1007/s10653-007-9103-3
17. Kuta J, Machát J, Benová D, Červenka R, Zeman J, Martinec P. Association of minor and trace elements with mineralogical constituents of urinary stones: A hard nut to crack in existing studies of urolithiasis. Environ Geochem Health. 2013;35:511–522. doi:10.1007/s10653-013-9511-5
18. Belitz H-D, Grosch W, Schieberle P. Food Chemistry. Springer Velarg; 2013.
19. Ramaswamy K, Killilea DW, Kapahi P, Kahn AJ, Chi T, Stoller ML. The elementome of calcium-based urinary stones and its role in urolithiasis. Nat Rev Urol. 2015;12:543–557. doi:10.1038/nrurol.2015.208
20. Williams CP, Child DF, Hudson PR, et al. Why oral calcium supplements may reduce renal stone disease: report of a clinical pilot study. J Clin Pathol. 2001;54:54–62. doi:10.1136/jcp.54.3.246
21. American Urological Association Clinical Practice Guidelines Development, American Urological Association Education and Research. 2015.
22. Shah O, Assimos DG, Holmes RP. Genetic and dietary factors in urinary citrate excretion. J Endourol. 2005;19(2):177–182. doi:10.1089/end.2005.19.177
23. European Association of Urology, American Urological Association Education and Research. 2007.
24. Khambati A, Matulewicz RS, Perry KT, Nadler RB. Factors associated with compliance to increased fluid intake and urine volume following dietary counseling in first-time kidney stone patients. J Endourol. 2017;31:605–610. doi:10.1089/end.2016.0836
25. Sofia NH, Manickavasakam K, Walter TM. Prevalence and risk factors of kidney stone. Med Sci. 2016;5.
 © 2019 The Author(s). This work is published and licensed by Dove Medical Press Limited. The
full terms of this license are available at https://www.dovepress.com/terms
and incorporate the Creative Commons Attribution
- Non Commercial (unported, 3.0) License.
By accessing the work you hereby accept the Terms. Non-commercial uses of the work are permitted
without any further permission from Dove Medical Press Limited, provided the work is properly
attributed. For permission for commercial use of this work, please see paragraphs 4.2 and 5 of our Terms.
© 2019 The Author(s). This work is published and licensed by Dove Medical Press Limited. The
full terms of this license are available at https://www.dovepress.com/terms
and incorporate the Creative Commons Attribution
- Non Commercial (unported, 3.0) License.
By accessing the work you hereby accept the Terms. Non-commercial uses of the work are permitted
without any further permission from Dove Medical Press Limited, provided the work is properly
attributed. For permission for commercial use of this work, please see paragraphs 4.2 and 5 of our Terms.