Back to Journals » International Journal of Nanomedicine » Volume 10 » Issue 1
The diameter of nanotubes formed on Ti-6Al-4V alloy controls the adhesion and differentiation of Saos-2 cells
Authors Filova E ![]() , Fojt J, Kryslova M, Moravec H, Joska L
, Fojt J, Kryslova M, Moravec H, Joska L ![]() , Bacakova L
, Bacakova L ![]()
Received 28 April 2015
Accepted for publication 3 August 2015
Published 20 November 2015 Volume 2015:10(1) Pages 7145—7163
DOI https://doi.org/10.2147/IJN.S87474
Checked for plagiarism Yes
Review by Single anonymous peer review
Peer reviewer comments 2
Editor who approved publication: Dr Thomas Webster
Elena Filova,1 Jaroslav Fojt,2 Marketa Kryslova,1 Hynek Moravec,2 Ludek Joska,2 Lucie Bacakova1
1Department of Biomaterials and Tissue Engineering, Institute of Physiology, Czech Academy of Sciences, 2Department of Metals and Corrosion Engineering, University of Chemistry and Technology, Prague, Czech Republic
Abstract: Ti-6Al-4V-based nanotubes were prepared on a Ti-6Al-4V surface by anodic oxidation on 10 V, 20 V, and 30 V samples. The 10 V, 20 V, and 30 V samples and a control smooth Ti-6Al-4V sample were evaluated in terms of their chemical composition, diameter distribution, and cellular response. The surfaces of the 10 V, 20 V, and 30 V samples consisted of nanotubes of a relatively wide range of diameters that increased with the voltage. Saos-2 cells had a similar initial adhesion on all nanotube samples to the control Ti-6Al-4V sample, but it was lower than on glass. On day 3, the highest concentrations of both vinculin and talin measured by enzyme-linked immunosorbent assay and intensity of immunofluorescence staining were on 30 V nanotubes. On the other hand, the highest concentrations of ALP, type I collagen, and osteopontin were found on 10 V and 20 V samples. The final cellular densities on 10 V, 20 V, and 30 V samples were higher than on glass. Therefore, the controlled anodization of Ti-6Al-4V seems to be a useful tool for preparing nanostructured materials with desirable biological properties.
Keywords: nanostructure, titanium nanotubes, cell adhesion, Saos-2 cells, osteogenic differentiation
Introduction
Replacing a big joint with an endoprosthesis reduces pain, restores flexibility, and improves the patient’s quality of life. Superior corrosion resistance, favorable mechanical properties, and good biocompatibility of the implant are indisputably needed. Titanium and its alloys meet these requirements, and have become a gold standard in biomedical applications. The implant’s surface is usually directly connected to the bone during some period after implantation. Nevertheless, difficulties can sometimes arise when the fibrous connective tissue layer between the bone and surface is being formed. The osseointegration of the implant may then become a long and difficult process. To eliminate these phenomena, changes in the material’s surface are required. Several widely used methods of modifying titanium surfaces include mechanical blasting, chemical treatment, or depositing hydroxyapatite coatings.1–7 Recently, a possible new way to modify the surface of the titanium and its alloys has been found: the formation of self-organized TiO2 nanotube layers by electrochemical oxidation in fluorine-containing electrolytes. The nanotube-array formation is the result of two competing processes. The first involves the active dissolution of the Ti metal to form a passive TiO2 layer. The second is related to the chemical dissolution of the newly formed oxide at the oxide–electrolyte interface. Nanotubes are mostly highly ordered, perpendicularly oriented, and well adherent to the substrate. The morphology of nanotubes can be controlled easily by adjusting anodized voltage and electrolyte composition. Tubes with diameters of approximately 20–100 nm are usually attained.8–11
Nanostructured surfaces give an opportunity to mimic more closely the morphology of living tissue. From cell in vitro studies, it has become increasingly evident that surface morphology could control cell behavior. The mechanism is driven by promoting the adsorption of selected proteins (such as fibronectin and vitronectin), which are important for mediating the signals between cells and surface.12,13 Changes in the morphology of cells growing on titanium nanotube substrate are also dependent on the tube diameter. Many studies have been done to clarify the effect of cell behavior on tubes with different diameters (15–100 nm), but this phenomenon remains unclear. A nanotubular structure allows the exchange of gas, nutrients, and proteins between the nanotube walls.12,14–16 In the present study, we prepared nanotubes on Ti-6Al-4V substrates and evaluated the cell adhesion, proliferation, and synthesis of osteogenic differentiation markers on nanotubes with different diameters.
Materials and methods
Sample preparation
Ti-6Al-4V alloy samples of 16 mm diameter and 3 mm height were used for the experiments. The specimens were wet-ground (up to Federation of European Producers of Abrasive 2,500 paper) and degreased in an ultrasonic bath in a mixture of ethanol and isopropyl alcohol. Nanostructuring was realized using a high-voltage IMP 88 PC-200V potentiostat galvanostat with a PGU-Auto Extern control unit (Jaissle; IPS Elektroniklabor GmbH & Co KG, Münster, Germany). The silver/silver chloride electrode with 3 M KCl was used as a reference. The electrochemical measurement consisted of a potential ramp from open-circuit potential to the selected end potential (10 V, 20 V, 30 V) with a 100 mV/s sweep rate and potentiostatic exposure for 2,000 seconds. All anodization experiments were carried out at room temperature in an electrolyte containing 1 mol·L−1 (NH4)2SO4 and 0.2 wt% NH4F. After the electrochemical measurement, the samples were rinsed with deionized water and then dried in air stream. Untreated Ti-6Al-4V alloy was used as the control (Ti_C).
Surface characterization
For morphological characterization of samples, a Vega3 scanning electron microscope (SEM; Tescan, Brno, Czech Republic) was used. An ESCA Probe P spectrometer (Scienta Omicron GmbH, Taunusstein, Germany) with Al Ka (1,486.7eV) X-ray source was used for surface analysis. Pressure in the analyzing chamber was approximately 2.10−8 Pa. X-ray photoelectron spectroscopy (XPS) spectra were corrected for charge shifts by normalizing binding energies to that of the C1s peak at 285.0 eV. A Mitutoyo SJ-401 contact profilometer was used for measuring roughness. The length and inner diameter of the nanotubes was evaluated from SEM images in ImageJ software. Data from four distant-image fields were used for analysis. The adhesion of nanotubes was tested by the pull-off method according to American Society for Testing and Materials F1147-99 with EPX DP 490 glue (Scotch Weld).
For SEM imaging of the 10 V, 20 V, and 30 V samples after a 3-day culture with cells, the samples were washed with phosphate-buffered saline (PBS) and fixed with Karnovsky’s solution (2% formaldehyde/2.5% glutaraldehyde +2.5% sucrose in a 0.2 M cacodylate buffer) for 1.5 hours. Then, the samples were washed with a 0.1 M cacodylate buffer and dehydrated in 50%, 70%, 80%, and 90% ethanol, and then twice in 100% ethanol, each concentration for 15 minutes. The samples were then incubated in 100% hexamethyldisilazane for 15 minutes. After being dried in an oven at 45% for 2 hours, the samples were coated with gold and observed under the SEM.
Cell culture, cell number, and viability
Samples 10 V, 20 V, 30 V, and Ti_C and glass coverslips (Marienfeld-Superior, Lauda-Königshofen, Germany) were sterilized in 70% ethanol for 1 hour, washed twice in PBS, and placed into 12-well tissue-culture test plates (TPP Techno Plastic Products AG, Trasadingen, Switzerland). Human Saos-2 cells (American Type Culture Collection HTB-85; Chemos GmbH & Co KG, Regenstauf, Germany) were seeded into the dishes with samples at a density of 15,300 cells/cm2 in 1.5 mL McCoy’s 5A medium (Sigma-Aldrich Co, St Louis, MO, USA) and supplemented with 15% fetal bovine serum (Gibco; Thermo Fisher Scientific, Waltham, MA, USA), sodium bicarbonate solution (S 8761, Sigma-Aldrich) and 40 μg/mL gentamicin (Lek, Ljubljana, Slovenia). In the Czech Republic, a special ethical permission is not required for buying commercially available cell lines. All principles outlined in the Declaration of Helsinki were followed. Cells were cultured at 37°C in a humidified atmosphere with 5% CO2 for 7 days. On days 1 and 3, the cells were stained with Live/Dead® Viability Assay Kit (L-3224; Thermo Fisher Scientific), and pictures of stained cells were taken under IX71 epifluorescence microscopy with a DP 71 digital camera (Olympus, Tokyo, Japan). Ethical permission was not obtained for the purchase of the human cell lines, as it was not required in the Czech Republic. The numbers of living and dead cells were counted from the 10–20 micrographs. Cell viability was expressed as the percentage of living cells from these micrographs. On day 7, the samples were washed in PBS, incubated in trypsin–ethylenediaminetetraacetic acid (EDTA) solution, and cell numbers counted using a cell-viability analyzer (Vi-Cell XR, six measurements for each experimental group; Beckman Coulter Inc, Pasadena, CA, USA). During the cell count, cell viability was automatically measured by a trypan blue-exclusion test. Growth curves were constructed from the data on days 1, 3, and 7.
Immunofluorescence staining of markers of cell adhesion and osteogenic differentiation
For immunofluorescence staining of talin and vinculin, the cells on the samples were fixed in 2% paraformaldehyde in PBS for 5 minutes (pH 7.4) on day 3 of the culture and day 7 of the culture for the other proteins. Then, the samples were washed three times in PBS (5 minutes), pretreated with 1% bovine serum albumin in PBS containing 0.1% Triton X-100 (1 hour), and then incubated in 1% Tween 20 for 20 minutes. After a 5-minute wash in PBS, the primary antibodies, ie, mouse monoclonal antitalin (T3287, dilution 1:200, clone 8D4; Sigma-Aldrich), monoclonal antivinculin, mouse ascites fluid, clone hVIN-1 (V 9131, dilution 1:100 in PBS; Sigma-Aldrich), rabbit anti-type I collagen, rabbit (LSL-LB-1197, dilution 1:200; Cosmo Bio Co Ltd, Tokyo, Japan), polyclonal rabbit antiosteopontin, human, pAb (LSL-LB-1197, dilution 1:200; Enzo Life Sciences, Farmingdale, NY, USA), monoclonal antihuman placental ALP, mouse ascites (clone 8B6, dilution 1:200; Sigma-Aldrich) or polyclonal rabbit antiosteocalcin (1–49) (human) IgG (T-4743, dilution 1:200; Peninsula Laboratories Inc, San Carlos, CA, USA), were applied overnight at 4°C. As the secondary antibodies, Alexa Fluor 488-conjugated F(ab’) fragment of goat antimouse IgG (H+L) or Alexa Fluor 488-conjugated F(ab’) fragment of goat antirabbit IgG (H+L) (A11017 or A11070, respectively, dilution 1:400; Thermo Fisher Scientific) were used for 80 minutes at room temperature. A solution of 0.05% Tween 20 in PBS was used to wash the samples. The cell nuclei were counterstained with bisbenzimide H 33258 (B1155, 10 μg/mL; Sigma Aldrich) for 20 minutes. The cells were evaluated under an epifluorescence microscope (IX51, DP70 digital camera; Olympus) or under a confocal microscope (TCS SP2; Leica Microsystems, Wetzlar, Germany).
In order to measure fluorescence intensity, 10–20 micrographs from each sample were taken under the epifluorescence microscope at the same exposure time on day 3 after seeding (talin and vinculin) and on day 7 (type I collagen, osteopontin, ALP, and osteocalcin). Fluorescence intensity was measured using Fluorescent Image Analysis software (version 1.0).17 The intensity was subsequently normalized for the number of cells. The fluorescence intensity of the samples stained without primary antibodies was subtracted.
Enzyme-linked immunosorbent assay of markers of cell adhesion and osteogenic differentiation
Concentrations of the focal adhesion proteins (vinculin and talin) and proteins involved in osteogenic differentiation (type I collagen, osteopontin, ALP, and osteocalcin) were measured per milligram of protein in the cells after a 7-day cultivation on the samples. Cells were detached by trypsin–EDTA (5 minutes, 37°C), resuspended in PBS, centrifuged, again resuspended in PBS, and kept in a freezer at −70°C overnight. The cell homogenates were then prepared by ultrasonication for 40 seconds (cycle 1, amplitude 70%) in a sonicator (UP 100 H; Hielscher Ultrasonics GmbH, Teltow, Germany), and the total protein content was measured using a modified method by Lowry et al.18
Aliquots of the cell homogenates corresponding to 1–50 μg of protein in 50 μL of water were adsorbed on 96-well microtiter plates (MaxiSorp; Thermo Fisher Scientific) at 4°C overnight. After being washed twice with PBS (100 μL/well), the nonspecific binding sites were blocked by 0.02% gelatin in PBS (60 minutes, 100 μL/well). The primary antibodies, ie, mouse monoclonal antitalin (clone 8D4, T3287, dilution 1:200; Sigma-Aldrich), monoclonal antivinculin, mouse ascites fluid, clone hVIN-1 (V 9131, dilution 1:100 in PBS; Sigma-Aldrich), rabbit anti-type I collagen, rabbit (LSL-LB-1197, dilution 1:200; Cosmo Bio), polyclonal rabbit antiosteopontin, human, pAb (LSL-LB-1197, dilution 1:200; Enzo Life Sciences), monoclonal antihuman placental ALP, mouse ascites (clone 8B6, dilution 1:200; Sigma-Aldrich), and polyclonal rabbit antiosteocalcin (1–49) (human) IgG (T-4743, dilution 1:200; Peninsula Laboratories) were diluted in PBS and applied at 20°C for 60 minutes (50 μL/well). As secondary antibodies, we used antimouse IgG (Fab-specific) peroxidase conjugate, or goat antirabbit IgG conjugated with peroxidase (A3682 and A9169, dilution in PBS 1:5,000 and 1:500, respectively; Sigma-Aldrich) (50 μL/well, incubation 45 minutes). This step was followed by double-washing in PBS with Triton X-100 (0.1%) four times. Then, 100 μL 2,2′-azino-bis(3-ethylbenzothiazoline-6-sulfonic acid) (ABTS) solution (A1888; Sigma-Aldrich) was added into each well and agitated for 30–40 min. The ABTS solution was prepared by mixing 10 mL of buffer (0.1 M sodium acetate, Sigma Aldrich, S2889, 0.05 M NaH2PO4·2H2O, Penta, 13472-35-0, pH 5), 0.5 mL ABTS solution (A1888, ABTS 40 mM [Sigma-Aldrich] and 10 μL 30% H2O2). After incubation, absorbance at 405 nm was measured by the Versa Max Microplate Reader (Molecular Devices LLC, Sunnyvale, CA, USA).
Alizarin staining of calcium deposits
On day 7 after seeding, cells were fixed in 2% paraformaldehyde for 10 minutes and washed with distilled H2O. A solution of Alizarin Red S (Sigma-Aldrich) in water was added (40 mM, pH 4.1, pH was adjusted using 10% [v/v] NH4OH) and incubated at room temperature for 20 minutes while shaking. Then, samples were washed four times with water, with 5 minutes’ shaking during each washing. Then, 800 μL 10% (v/v) acetic acid was added to each well and incubated for 30 minutes at room temperature while shaking. The layer was scraped off and put into a test tube, vortexed for 30 seconds, and 500 μL of mineral oil (Sigma-Aldrich) was added and incubated for 10 minutes at 85°C and then put on ice for 5 minutes. After cooling, the samples were centrifuged at 20,000× g for 15 minutes, and 500 μL supernatant was pipetted into a fresh microcentrifuge tube. The content was neutralized by 200 μL 10% (v/v) NH4OH (pH 4.1–4.5). Absorbance of the samples in triplicate (150 μL) was measured at 405 nm by the Versa Max Microplate Reader.9
Statistical analysis
Quantitative data are presented as mean ± standard error of mean for biological experiments or mean ± standard deviation for nanotube-wall thickness and nanotube diameter. Statistical analyses were performed using SigmaStat (Systat Software, San Jose, CA, USA). Multiple-comparison procedures were conducted by analysis of variance, Student–Newman–Keuls method. P≤0.05 was considered significant.
Results and discussion
Nanosurface characterization
Tubular nanostructures were created by anodic oxidation. Micrometric areas of etched β-phase were also observed on the surface. The area of the removed phases was 11%±3%. This result was independent on nanostructuring conditions. The area of the nanotube walls’ cross section occupied 51%±5% of the surface covered by the nanotubes, and there was no statistically significant difference within the individual types of surfaces. Removed β-phase areas were not included in the calculation. Nanotube-diameter histograms for each experimental condition group are presented in Figure 1. The results indicate that increasing potential resulted in an increased nanotube diameter, and the diameter range was wider. Film thickness varied between 200 nm for 10 V to approximately 700 nm for 30 V. The thickness of the walls was 14±2 nm for 10 V, 18±4 nm for 20 V, and 19±4 nm for 30 V nanotubes. According to Student’s t-test, the thickness of 10 V nanotubes differed from both 20 V and 30 V nanotubes. The morphology and density of the nanotubes were not affected by the cells attached on the surface (Figure 2).
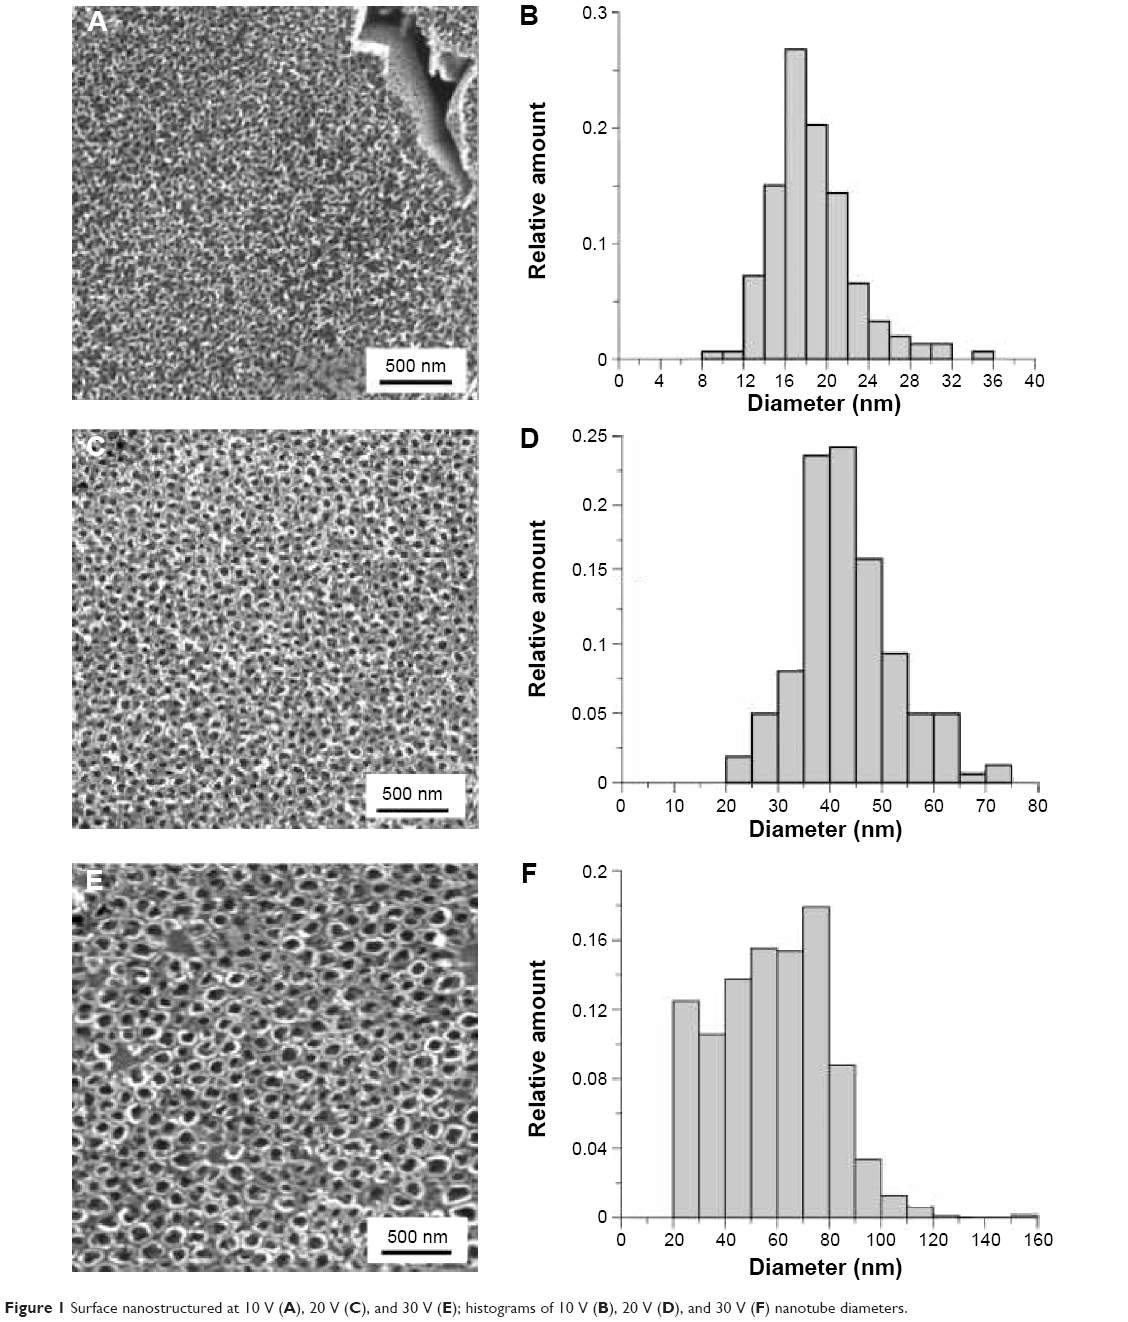 | Figure 1 Surface nanostructured at 10 V (A), 20 V (C), and 30 V (E); histograms of 10 V (B), 20 V (D), and 30 V (F) nanotube diameters. |
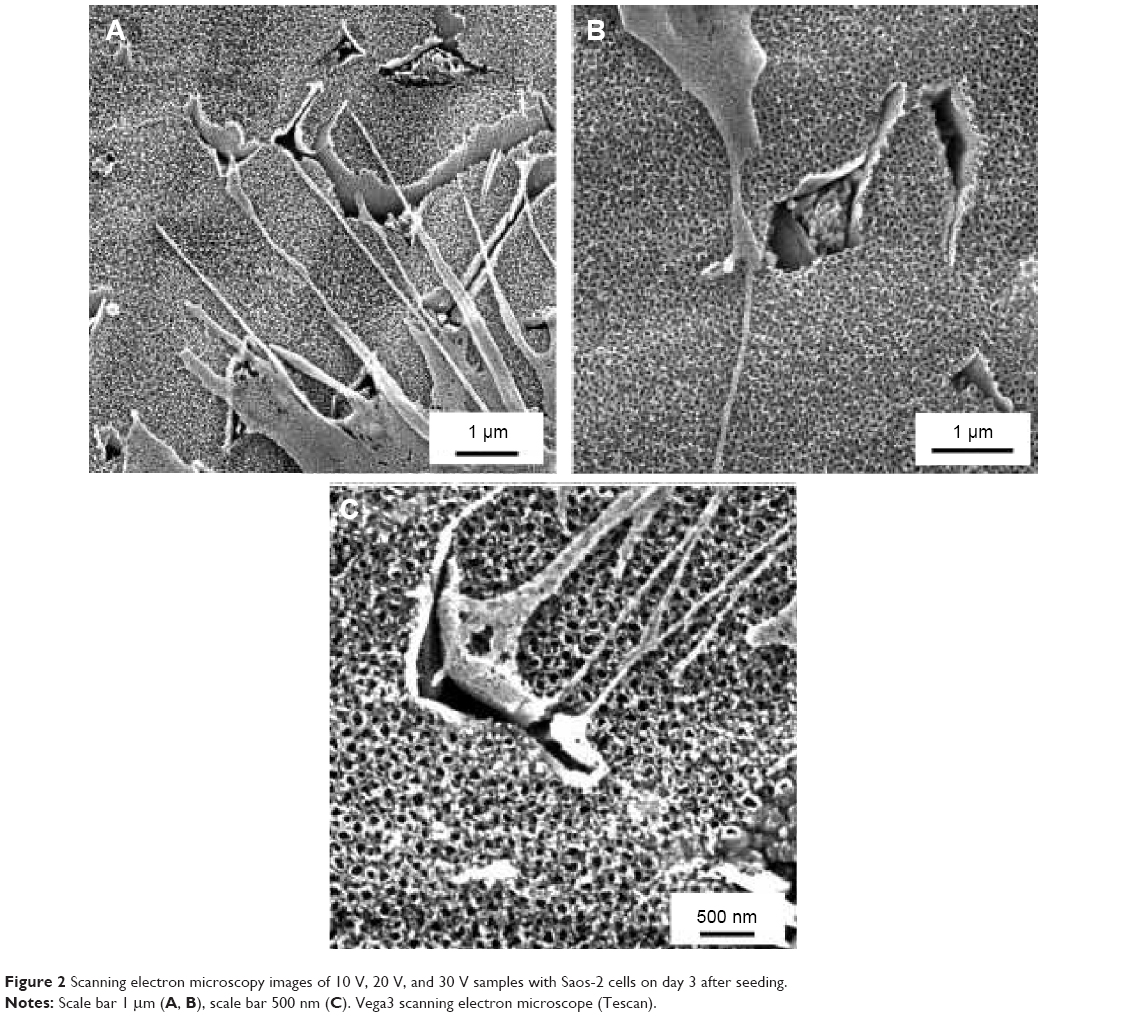 | Figure 2 Scanning electron microscopy images of 10 V, 20 V, and 30 V samples with Saos-2 cells on day 3 after seeding. |
Measurement using a contact profilometer was not able to detect differences in roughness either between the control Ti-6Al-4V sample and nanostructured surfaces or between individual nanostructures. The surface roughness, measured by the Ra parameter, was 0.06±0.02 μm. The primary stability of the implant depends on the shape of the implant and the quality of the bone preparation during surgery. Secondary stability comes after primary stability, and depends on the interaction between the implant and the surrounding tissue. The most important factor is swiftly achieving the secondary stability of the implant, mediated by improved anchorage, osteogenic differentiation of osteoblasts, and mineralized matrix deposition by these cells. However, from the application point of view, the crucial feature is also the initial adherence of the nanotubes to the substrate. The adhesion of nanostructures to the base material was sufficient; it was on the level of glue mechanical properties.
The chemical composition of the nanostructured surface was analyzed by XPS. XPS is a sensitive technique for surface-chemistry characterization, with analysis depth in the nanometer range. The composition of the nanostructure created at 20 V is shown in Table 1 and Figure 1. The binding energies determined by analyzing the spectra of Ti 2p, V 2p, and Al 2p (Figure 3) corresponded to TiO2, V2O5 and Al2O3.19 Nanostructuring resulted in an increase in aluminum concentration at the surface. Toward the nanotube–metal interface, the amount of Al decreased. Its concentration was 12%wt after etching. The concentration of vanadium remained the same, ie, 4%wt. Surface carbon was not bound, and was present only adventitiously. Carbidic carbon at binding energy 282.4 eV was detected at a depth of 280 nm (Figure 4A). This carbon was probably bound in the form of TiC. The presence of fluorine on the surface and also after etching (Figure 4B) indicates its penetration through the growing nanotube walls and its fixation in structure.20
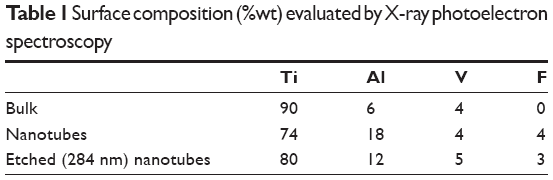 | Table 1 Surface composition (%wt) evaluated by X-ray photoelectron spectroscopy |
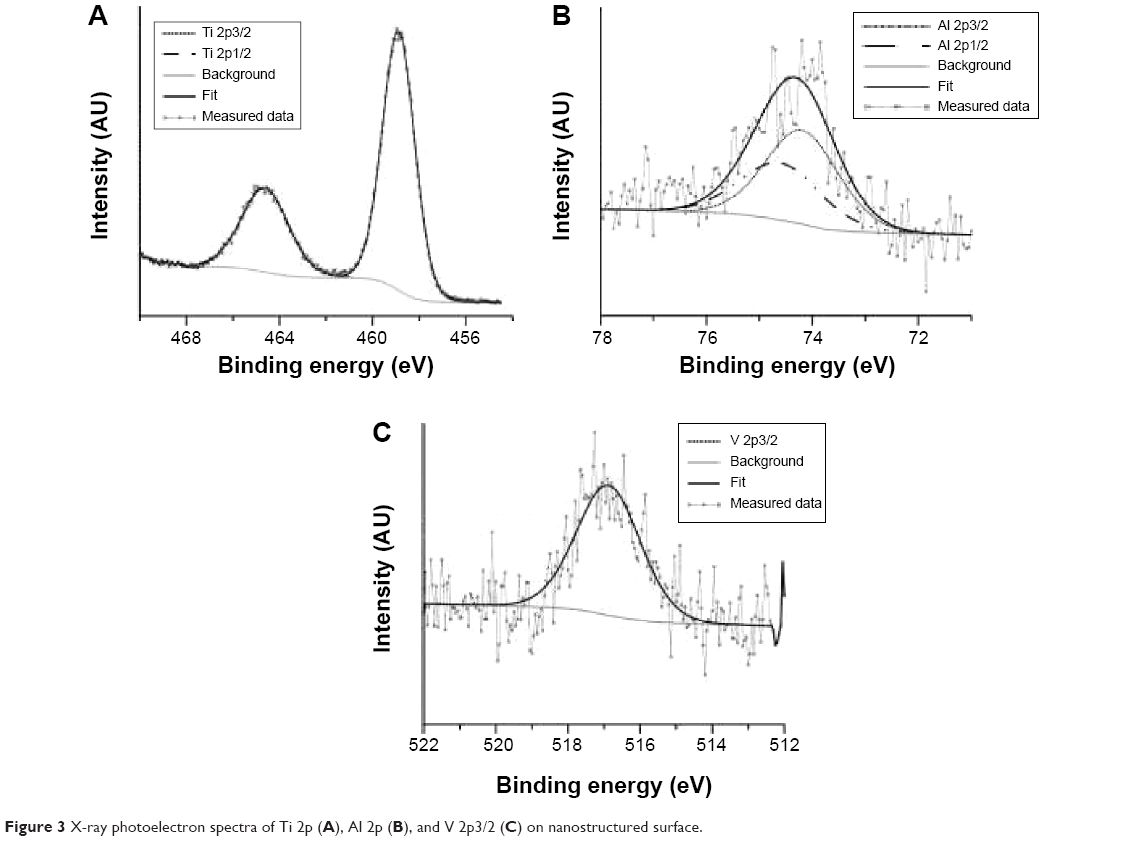 | Figure 3 X-ray photoelectron spectra of Ti 2p (A), Al 2p (B), and V 2p3/2 (C) on nanostructured surface. |
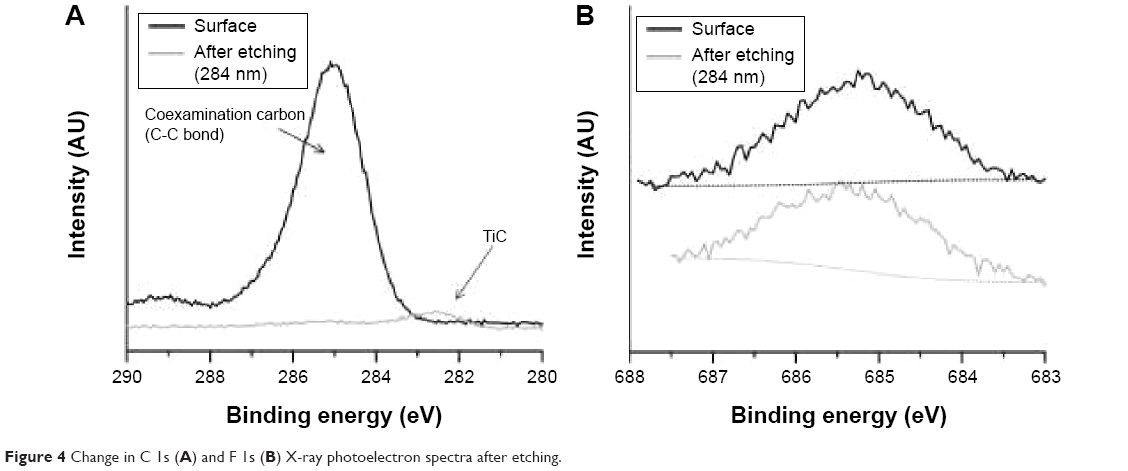 | Figure 4 Change in C 1s (A) and F 1s (B) X-ray photoelectron spectra after etching. |
The nanotubes formed on Ti-6Al-4V alloy by anodic oxidation have usually been referred to as TiO2 nanotubes.21–23 However, pure titanium oxide nanotubes are formed only on pure Ti.10 Although TiO2 has been reported as the main component of nanotubes formed on Ti-6Al-4V,11 these nanotubes also contained vanadium, iron, and traces of fluorine originating from the chemical etching of the substrate in the HF/HNO3/H2O solution before anodizing.23 Other admixtures detected in TiO2 nanotubes were C and N.21 The nanotubes formed on Ti-6Al-4V by thermal oxidation were referred to as Ti-Al-V-O nanotubes, because these nanostructures contained Al- and V-doped titanium oxide.10 Our XPS results were in accordance with the findings of these authors.
Anodic oxidation has been successfully used for preparing tubular structures on titanium24 and on Ti alloys, such as titanium–zirconium,25 Ti-6Al-4V,26,27 Ti-6Al-4V with incorporated strontium,27 and Ti-6Al-7Nb.28 The morphology and size of the nanotubes depends on the anodization conditions. Their size should be similar to the size of bone apatite, which form 10–20 nm-long and 2–3 nm-wide plates,29 or to type I collagen fibers, which are ~200 nm long and 2–3 nm thick.30 We prepared Ti-6Al-4V-based nanotubes, which have a rather wide range of inner diameters (Figure 1), ie, from 8 nm to 36 nm at 10 V (18±4 nm), from 20 to 75 nm at 20 V (43±10 nm), and from 20 to 120 nm (79±32 nm) at 30 V nanotubes (Figure 1). TiO2-ZrO2-ZrTiO4 nanotubes had a similarly wide distribution of diameters, which were prepared at 20–35 V.31 In another study, Ti-Zr nanotube25 diameter ranged from 30–40 nm. TiO2 nanotubes, prepared by electrochemical anodization (10 V, 20 V, and 40 V, respectively), were 25 nm, 50 nm, and 100 nm in diameter and were coated with Ag.32
Cell adhesion and growth
For our in vitro experiments, we used Saos-2 osteoblast-like cells. They resemble human osteoblasts in their ability to express osteogenic markers, to react to Ti particles, etc.33 They have been reported to express osteocalcin, osteonectin, osteopontin, bone sialoprotein, decorin, type I collagen, procollagen I, and type V and type X collagens. In Saos-2 cells, ALP activity was detected, which increased significantly after reaching cell confluence.34,35 Saos-2 cells represent a mature phenotype of osteoblasts, and have high mineralization capacity. They are sensitive to hormonal administration, and express cytokines and growth factors similar to human osteoblasts.33,35 Saos-2 cells bind to material surfaces via β1, α5, αv subunits of integrin receptors. Saos-2 cells were used for studying cell–material interaction on Ti, Nb, and TiNb alloy with different surface morphology, topography, roughness, and charge distribution.36–39 Osteogenic differentiation markers reach maximum level after 7 or 14 days in vitro.37 For tissue-engineering purposes, it is important to study osteogenic differentiation at shorter time intervals, as early onset of osteogenic differentiation and bone formation on a biomaterial surface is crucial for successful implantation in vivo. In addition, at longer time intervals, the difference between different samples usually decreases or even disappears.
At 24 hours after seeding, Saos-2 osteoblasts adhered at the highest density on the control glass surface and on smooth Ti_C. Cells adhered in significantly lower initial densities on Ti-6A1-4V-based nanotubes (Figure 5A). Nevertheless, the Saos-2 cells on all tested surfaces were well spread and polygonal, and their viability was above 96%. On day 3 after seeding, cell densities were similar on all samples, with a viability of approximately 97%–98% (Figure 5B). On day 7, the highest density of Saos-2 cells was observed on smooth Ti_C, and the lowest cell density on glass (Figure 5C and D). Cell densities on 10 V and 30 V nanotube samples were higher than on glass.
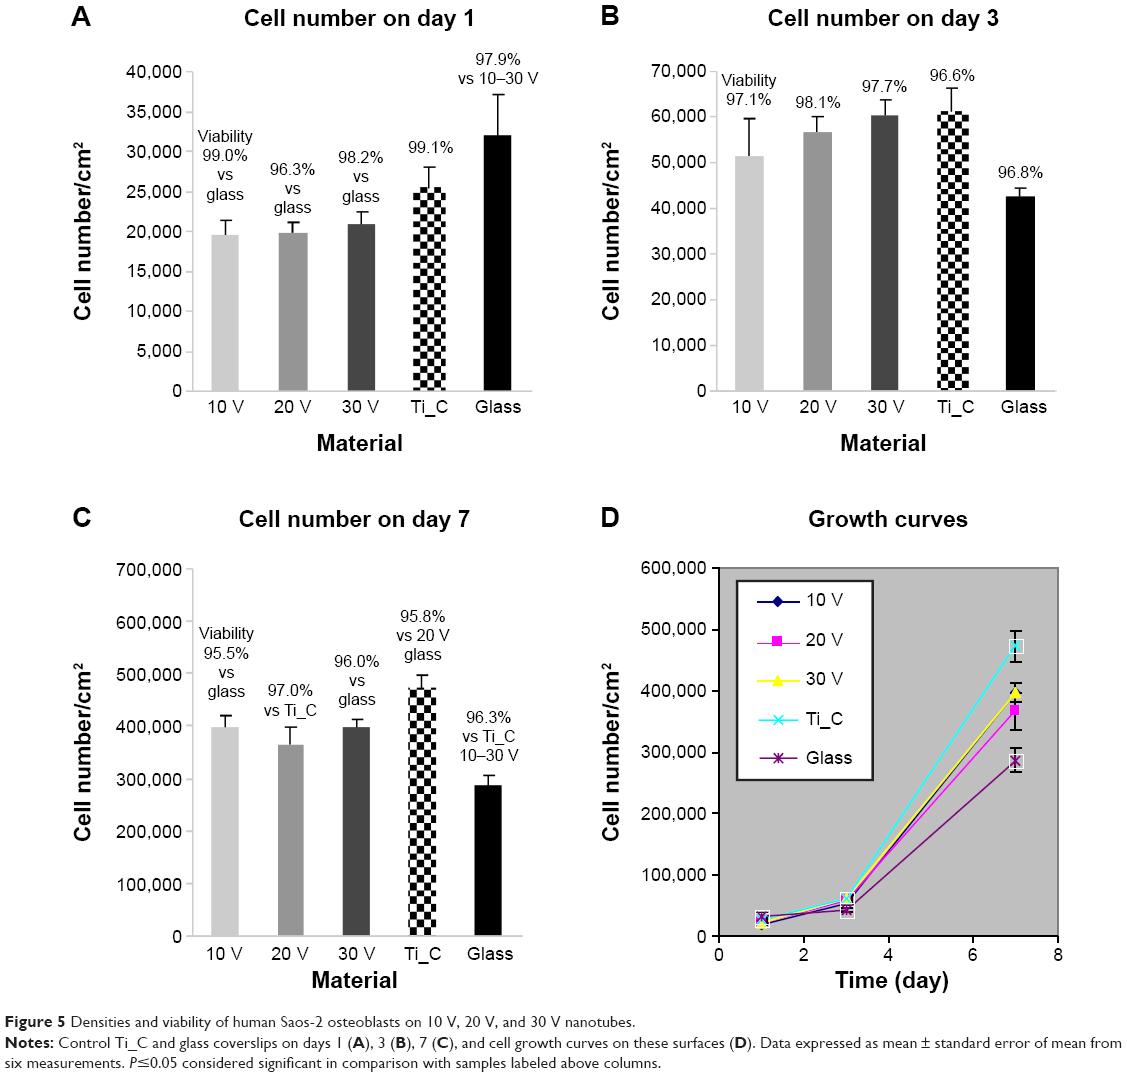 | Figure 5 Densities and viability of human Saos-2 osteoblasts on 10 V, 20 V, and 30 V nanotubes. |
It is generally known that cell adhesion and growth on a material surface is influenced by its chemical composition, roughness, and topography. On all tested surfaces, no differences in surface roughness, measured by the Ra parameter, were detected, and thus the lower number of initially adhered Saos-2 cells on nanotube-modified surfaces than on glass surfaces can be attributed to the different chemical composition of both types of surfaces, rather than to their roughness. In an earlier study of our group, performed on surfaces with the same chemical composition (ie, titanium), even relatively high differences in roughness (Sq from 1 nm to 100 nm) did not significantly affect the number of initially adhered MG-63 osteoblasts.40 On the other hand, mouse osteoblasts (MC3T3-E1) adhered better on surfaces modified with 30–40 nm-wide titanium–zirconium nanotubes than on etched and polished Ti-Zr samples and expressed more integrins with α2-chain (ie, adhesion receptors for collagen) and α5-chain (ie, adhesion receptors for fibronectin) on the nanotube-modified samples at 4 hours and 24 hours after seeding.25 In our earlier study, performed on TiO2 films deposited on surfaces with various roughness, cell numbers were generally higher on TiO2 surfaces than on corresponding glass surfaces, but decreased with increasing surface roughness (Ra of 40 nm, 100 nm, or 170 nm).41
Furthermore, the topography of the material surface – in our study represented by the diameter of nanotubes – influences cell adhesion and growth. Surfaces with vertically oriented nanotubes do not provide continuous substrates for cell adhesion. The hollow interior space of the nanotubes and the space between neighboring nanotubes do not allow cell-substrate binding by cell-adhesion receptors (integrins), the formation of focal adhesion plaques, or the delivery of specific signals into cells, especially if the diameter of the nanotubes is too large (eg, ~100 nm) and their wall thickness relatively small.14,40,41 The cell-substrate binding by the cell-adhesion receptors is mediated by the adsorption of specific proteins on the material surface, eg, vitronectin and fibronectin, from biological fluids. However, the protein molecules on large-diameter nanotubes only adsorb sparsely at the top-wall surface, owing to the presence of large empty nanotube pore spaces.14,44
Therefore, many studies have reported that cell adhesion decreased with increasing inner nanotube diameter. For example, human primary osteoblasts reached their highest population density on TiO2 nanotubes of 15 nm in the inner diameter, and cell densities decreased with inner nanotube diameters of 20 nm, 30 nm, 50 nm, 70 nm, and 100 nm nanotubes sample. On 15 nm nanotubes, both fibronectin production and filopodia formation in human primary osteoblasts were higher than on 100 nm nanotubes.16 Similarly, TiO2 nanotubes with a small diameter (approximately 30 nm) deposited on Ti substrates promoted the highest degree of mouse MC3T3-E1 preosteoblast adhesion, while larger-diameter (70–100 nm) nanotubes elicited a lower population of cells with extremely elongated cellular morphology.14 On TiO2 and ZrO2 nanotubes grown on Ti and Zr substrates, respectively, the adhesion and spread of rat mesenchymal bone marrow cells were enhanced for nanotube diameters of approximately 15–30 nm, while a strong decay in cell activity was observed for diameters larger than 50 nm.45 The adhesion, spreading, growth, and differentiation of mesenchymal stem cells were shown to be maximally induced on TiO2 nanotubes of smaller diameter (15 nm), but they were hindered on larger-diameter (100 nm) tubes, which led to cell death and apoptosis.44
A more complicated correlation between nanotube diameter and cell adhesion was reported by Minagar et al.31 These authors analyzed in detail the shape of Saos-2 osteoblasts, and found that cells were flattened on TiO2-ZrO2-ZrTiO4 nanotubes with a smaller inner diameter (range 28–52 nm) and with a larger inner diameter (56–108 nm), while on nanotubes of medium inner diameter of 42–76 or 41–87 nm, the cells were round and unspread. For cell adhesion, the optimum diameter range of TiO2-ZrO2-ZrTiO4 nanotubes seemed to be 40±12 nm.31 This cell behavior was explained by 1) the optimum nanospacing of low-diameter nanotubes and the very low roughness of their layers, 2) the relatively high roughness-amplitude parameters, low roughness-spacing parameters, and low surface energy on the layers of nanotubes with a medium diameter and 3) the appropriate wall thickness of nanotubes with a large diameter, which was in the range of the proposed optimum nanospacing, where the cell adhesion-mediating proteins can be adsorbed.31 Similarly, the proliferation of mouse MC3T3-E1 preosteoblasts on TiO2 nanotubes increased with increasing nanotube diameter (20–120 nm), which was attributed to the increased length of nanotubes with larger diameters (100–120 nm). The long-nanotube layers may provide a more appropriate pathway for the continuous supply of fluid with ions, nutrients, proteins, etc, and also showed increased nanometer-scale roughness.43
Unfortunately, anodization does not allow for the preparation of nanotubes with a narrow size distribution. Nevertheless, we obtained similar cell-population densities on all nanotube layers, although they displayed a wide range of nanotube diameters (Figure 5). This can be explained by the fact that the wall thickness of all nanotubes (ie, 14±2 nm for 10 V, 18±4 nm for 20 V and 19±4 nm for 30 V nanotubes) was appropriate for integrin-mediated cell adhesion and the formation of focal adhesion plaques. The surface occupied by the head of the integrin receptor is approximately 10 nm, and the optimum space for focal adhesion plaques could be approximately 15 nm.46 In accordance with this, the cells on all tested nanotube films displayed well-developed focal adhesion plaques (Figure 6). Although the cells on the nanotube layers adhered at lower initial cell-population densities than on glass, they grew relatively quickly, and on day 7 they reached similar or even higher population densities (Figure 5).
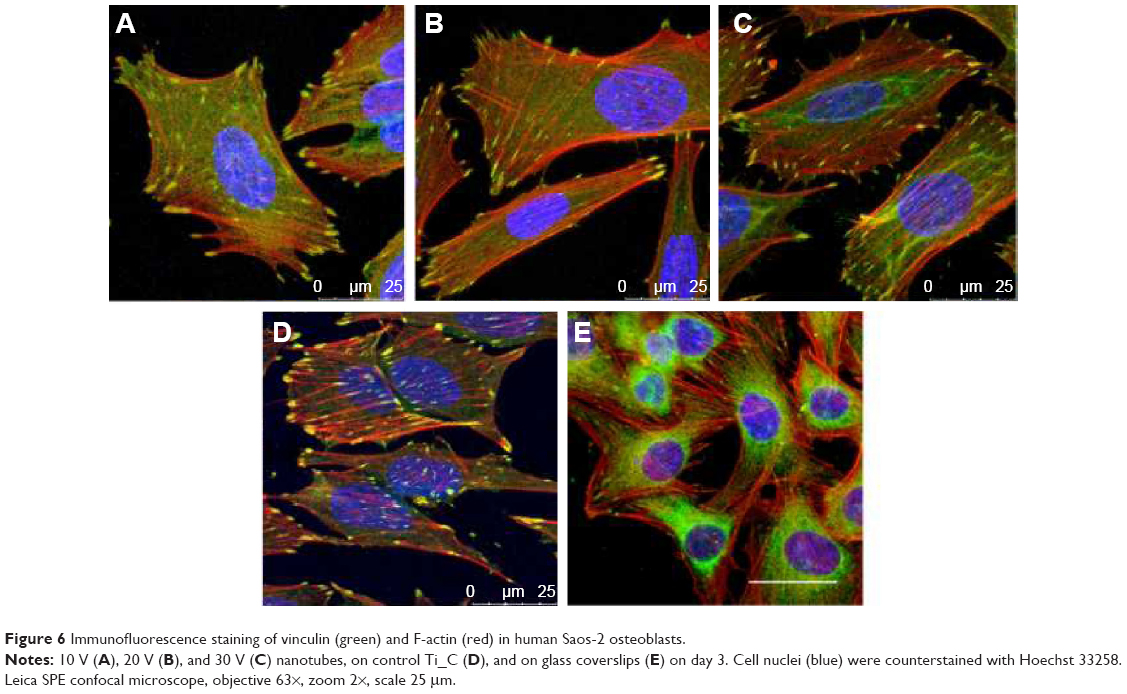 | Figure 6 Immunofluorescence staining of vinculin (green) and F-actin (red) in human Saos-2 osteoblasts. |
It is not only the size or distance of the surface irregularities but also their shape that is important. Gongadze et al47 introduced a model of the effect of the sharp edges of surface nanostructures on protein adsorption. At very sharp convex metal edges, surface-charge density and electric field strength are very large and increase with the curvature of the edge. Concurrently, surface-charge density decreases with the distance from the edge. On concave metal edges, the situation is reversed, with a zero-charge density at an infinitely sharp corner, which increases with the distance from the edge. The surface of titanium is negatively charged. Osteoblasts, which are also negatively charged, cannot adhere directly to titanium. Nanorough surfaces, however, support the adsorption of proteins with positively charged tips adsorbed onto the titanium surface.47 In addition, these proteins, eg, fibronectin, might be adsorbed on a titanium surface using metallic divalent cations as bridging molecules. On nanostructures, the preferential adsorption of fibronectin, vitronectin, and type I collagen was observed, which supports the adhesion of osteoblasts on nanorough surfaces in comparison with fibroblasts or endothelial cells.48
Similar phenomena were also found on surfaces with vertically aligned nanotubes. A small-diameter nanotube surface had on average sharper convex edges per unit area than a surface with large nanotubes, which led to the increased negative surface-charge density, the increased adsorption of vitronectin and fibronectin, and in this way also to the enhanced integrin-mediated adhesion of cells to the small-diameter nanotube surfaces. In accordance with this, a significantly higher amount of fibronectin was found on the 15 nm-diameter compared to the 100 nm-diameter nanotube surfaces.44,49
Molecular markers of cell adhesion
The concentration and distribution molecular markers of cell adhesion, ie, talin and vinculin, were evaluated by immunofluorescence staining and enzyme-linked immunosorbent assay (ELISA). The immunofluorescence of talin was relatively diffused, and focal adhesions were not clearly visible (Figure S1). The fluorescence intensity of talin per cell was most intense on the 30 V nanotube sample, and there was a very low signal on glass (Figure 7A). As mentioned earlier, well-developed focal adhesion plaques containing vinculin were found on all surfaces (Figure 6). They seemed to be slightly larger on smooth Ti_C surfaces than on nanotubes. On glass, focal adhesions in Saos-2 cells were smaller than on the other surfaces, and the signal of vinculin was lower than on 30 V nanotubes and Ti_C surfaces. The vinculin staining intensity per cell was the highest on sample 30 V with nanotubes of the largest diameter and was lower on 20 V and 10 V samples (Figure 7B). Therefore, the intensity of talin and vinculin fluorescence was higher on nanotubes with a larger diameter and larger wall thickness than on the nanotubes with smaller diameters and wall thickness.
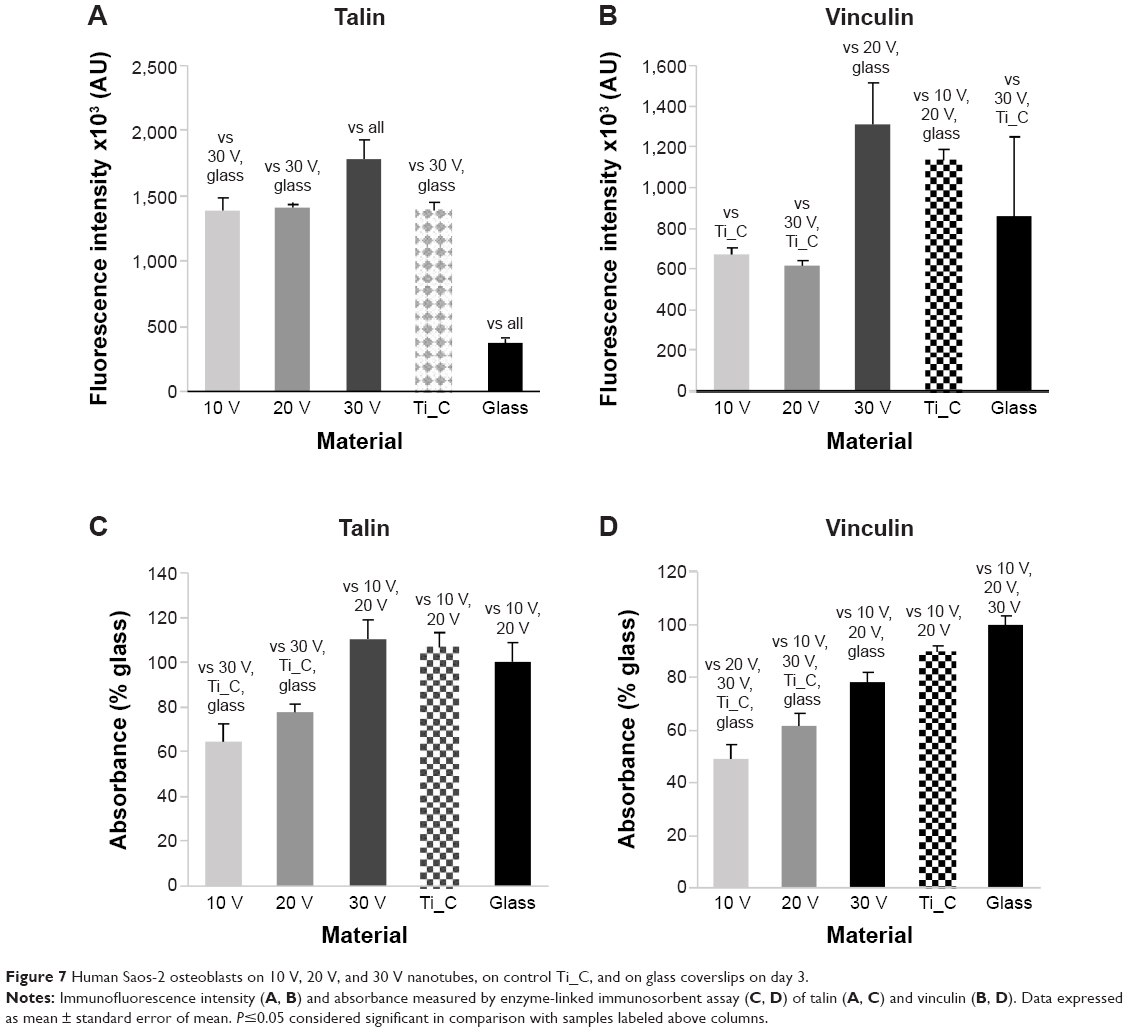 | Figure 7 Human Saos-2 osteoblasts on 10 V, 20 V, and 30 V nanotubes, on control Ti_C, and on glass coverslips on day 3. |
The concentration of talin and vinculin, measured semiquantitatively by ELISA, showed a similar trend to the intensity of immunofluorescence staining. The concentration of talin (Figure 7C) was higher in cells on 30 V nanotubes, smooth Ti_C, and glass compared to 10 V and 20 V nanotube samples. Similarly, the concentration of vinculin gradually increased from 10 V to 30 V nanotubes, but the highest vinculin concentrations were on flat surfaces, ie, glass and Ti_C (Figure 7D).
Therefore, in our study, the concentrations of both talin and vinculin, measured by the intensity of immunofluorescence and by ELISA in cell homogenates, usually increased gradually with nanotube diameter. A possible explanation is the nanotube-wall thickness, which slightly increased with the nanotube diameter from 14±2 nm for 10 V nanotubes to 19±4 nm for 30 V nanotubes, and became more appropriate for integrin binding and the formation of focal adhesion plaques.46 On surfaces with 80 nm nanotubes, the intensity of the immunofluorescence of vinculin in mouse C3H10T1/2 osteogenic cells was higher than on a 30 nm nanotube surface, and higher than on flat polished or etched surfaces.50 This result is in agreement with our findings of the highest immunofluorescence of vinculin on 30 V nanotubes, which were of a similar average diameter of 79±32 nm. Vinculin is a key focal adhesion protein that can stabilize the talin–integrin complex and increase cell adhesion. Cells can stably adhere to the surface, activating the expression of vinculin. Therefore, vinculin expression on the prosthesis can reflect to some extent cell-adhesion strength.50
The distance among surface nanofeatures is also important. The spacing of 37 nm of adhesive arginylglycylaspartic acid nanodomains supported the density of adhered cells and their spreading. On the other hand, higher spacing, ie, 53 nm, 77 nm, 87 nm, and 124 nm, reduced both cell adhesion and spreading and increased the circularity of mesenchymal stem cells.51 Another important factor is the shape of nanoscale irregularities on the material surface. The staining of phosphorylated focal adhesion kinase in human fibroblasts demonstrated punctuated adhesion complexes on both flat silicone and on 3-D sharp-nanotip surface topography, and showed dash-like adhesion complexes on nanograte surfaces, ie, a needle- or blade-like sharp tip of less than 10 nm in tip-apex radius.52
Molecular markers of osteogenic cell differentiation
As with markers of cell adhesion, the concentration of osteogenic cell-differentiation markers was also evaluated by immunofluorescence staining and ELISA. These markers included collagen I and ALP as early markers, osteopontin as a middle marker, and osteocalcin as a late marker. Another late marker was the concentration of calcium revealed by Alizarin Red staining. The ability of the implants to accelerate osteogenic cell differentiation and osseointegration on their surface is crucial for successful implantation.
Staining of type I collagen showed the highest signal per cell on the 20 V samples and the lowest on the 30 V sample (Figures 8A and S2). Relatively high fluorescence intensity was also found on Ti_C. The fluorescence signal of ALP was high in cells on 10 V and 20 V samples and decreased on the largest nanotubes, ie, on 30 V; the lowest intensity was observed on glass and Ti_C (Figures 8B and S3). On the other hand, after osteopontin staining, signal intensity increased with nanotube diameter, but it was relatively high on Ti_C too (Figures 8C and S4). Osteocalcin, a late osteogenic marker, was most intensively stained on 20 V and 30 V nanotubes and on Ti_C, and less intensively on the glass and 10 V sample (Figures 8D and S5). Therefore, it can be summarized that the concentration of markers of early osteogenic differentiation showed a tendency to decrease with increasing nanotube diameter, while the middle and late markers rather increased.
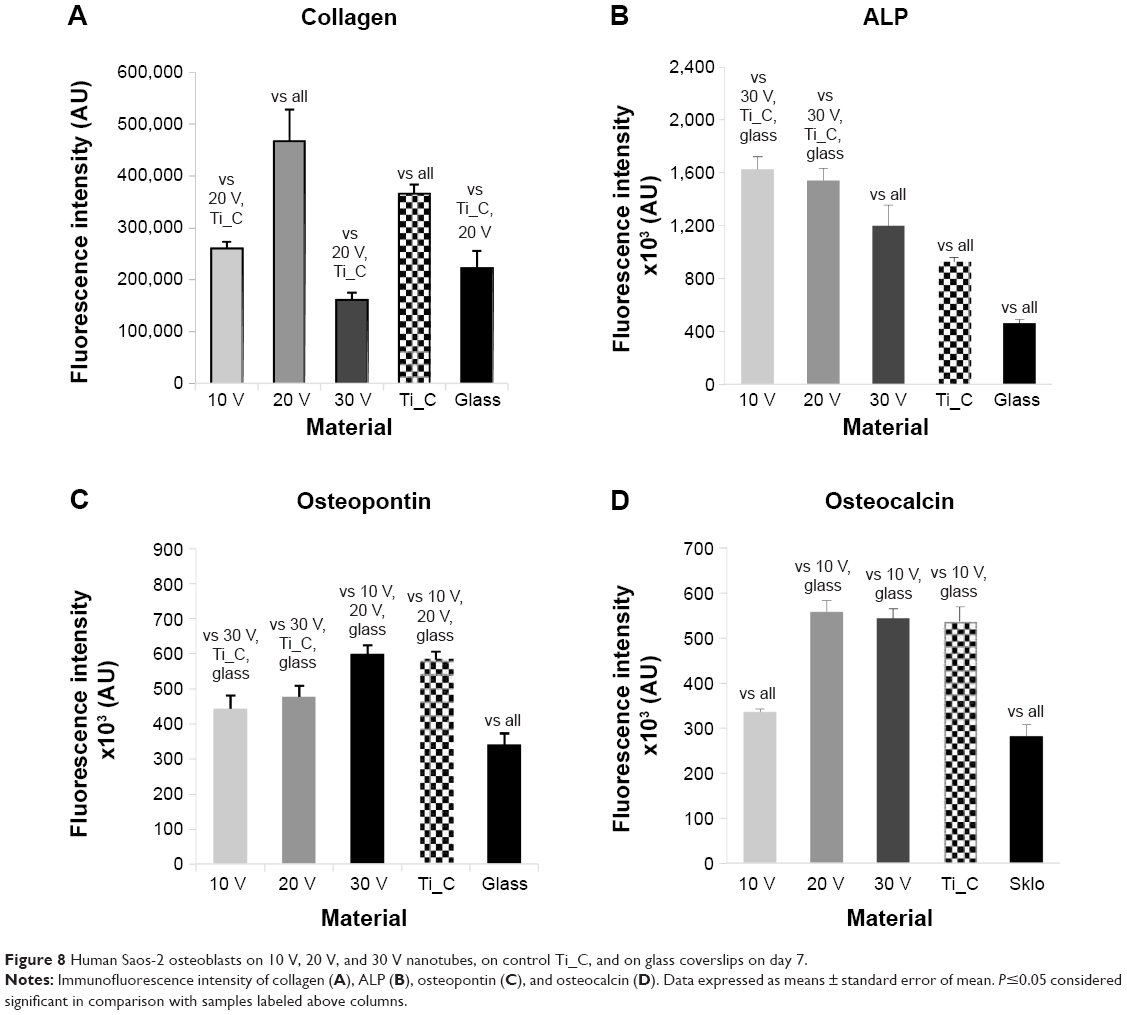 | Figure 8 Human Saos-2 osteoblasts on 10 V, 20 V, and 30 V nanotubes, on control Ti_C, and on glass coverslips on day 7. |
ELISA revealed the highest concentration of collagen I on 10 V, 20 V, and 30 V nanotubes, and this value significantly decreased on Ti_C and glass (Figure 9A). On the nanotubes, the average concentration tended to decrease from 10 V to 30 V nanotubes, but these differences were not significant. The decrease was more pronounced in the concentration of ALP, which was higher in cells on 10 V and 20 V nanotubes in comparison with cells on 30 V nanotubes and glass (Figure 9B). The middle and late markers of osteogenic cell differentiation showed an even clearer tendency to decrease with increasing nanotube diameter. The concentration of osteopontin decreased gradually from maximum values on 10 V nanotubes to lower values on 20 V and 30 V nanotubes and Ti_C to the minimum value on glass (Figure 9C). Also, the concentration of osteocalcin in cells on 30 V nanotubes was significantly lower than on 20 V nanotubes, and very low on glass and Ti_C (Figure 9D). The quantification of calcium by Alizarin Red staining (Figure 9E) showed an increased concentration of calcium on the Ti_C sample compared to glass, while the calcium concentration in cells on all nanotube samples was similar to the value on glass.
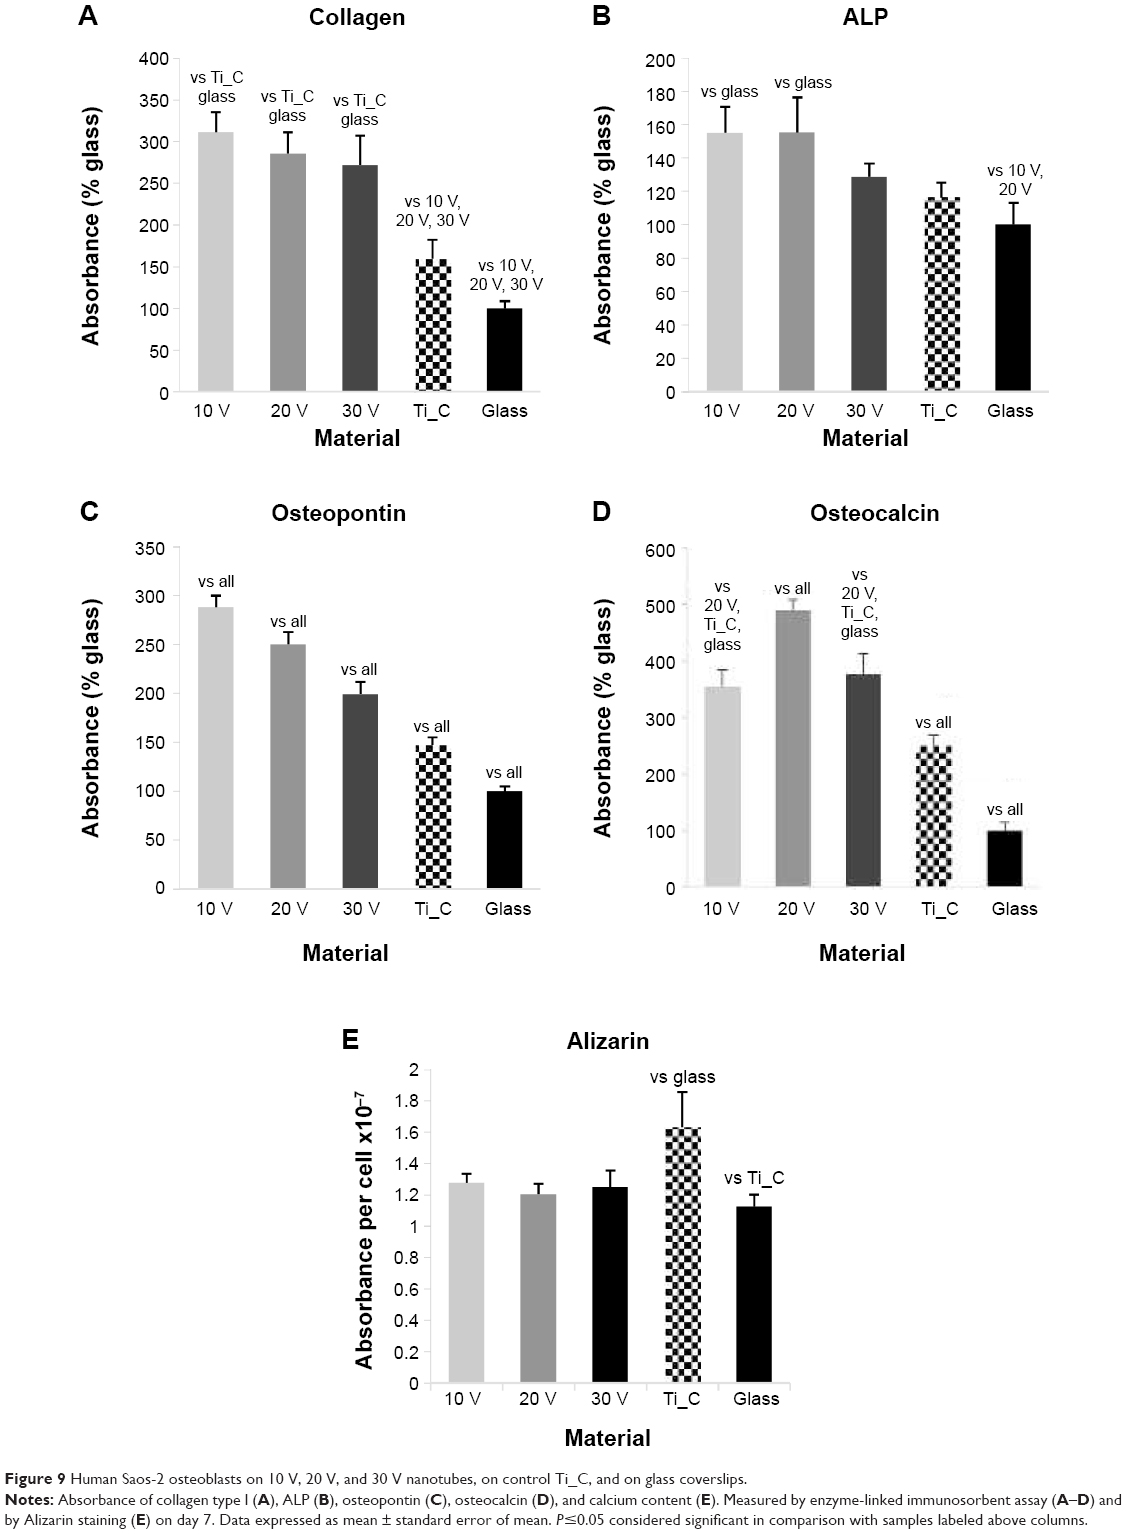 | Figure 9 Human Saos-2 osteoblasts on 10 V, 20 V, and 30 V nanotubes, on control Ti_C, and on glass coverslips. |
Nevertheless, our results suggest that contrary to the concentration of focal adhesion proteins (which tended to be higher on nanotubes with a larger diameter and wall thickness), the osteogenic cell differentiation is rather supported by a finer surface nanostructure, ie, by nanotubes of smaller diameter and wall thickness (10 V and 20 V nanotubes). Similar results were obtained in a study on TiO2 nanotubes that were 15 nm, 20 nm, 30 nm, 70 nm, and 100 nm in diameter. Osteocalcin production and calcium deposition by human primary osteoblasts were higher on TiO2 nanotubes 15 nm in diameter than on nanotubes 20–100 nm in diameter.16 Also, a study performed on TiO2 nanotubes showed that a nanotube diameter of 20–70 nm provided an effective length scale for the adhesion, ALP activity, and mineralization of MC3T3-E1 preosteoblasts. However, these cell functions were severely impaired on nanotube layers with 100–120 nm diameter.43
However, some studies reported opposite results, ie, that osteogenic cell differentiation increased with increasing nanotube diameter. Small nanotubes (~30 nm in diameter) promoted the adhesion of human mesenchymal stem cells without noticeable differentiation, whereas larger nanotubes (~70–100 nm in diameter) induced the differentiation of the stem cells into osteoblast-like cells, which was attributed to a dramatic cell elongation (approximately tenfold increased) followed by cytoskeletal stress.12 Similar results were reported by Brammer et al14 in MC3T3-E1 preosteoblasts cultured on TiO2 nanotube layers. Small-diameter (~30 nm) nanotubes promoted the highest degree of cell adhesion, while larger-diameter (70–100 nm) nanotubes elicited a lower population density of cells with extremely elongated cellular morphology (aspect ratio of 11:1) and much higher ALP levels and activity.14 Analogically, the longer spacing of arginylglycylaspartic acid-containing adhesion oligopeptides supported both the osteogenic and adipose differentiation of MSCs.51 Studies performed on arrays of TiO2 nanotubes 50 nm, 70 nm, and 100 nm in diameter demonstrated that nanotubes with a diameter of 70 nm were optimal for the osteogenic differentiation of human adipose-derived stem cells in vitro and new bone-matrix formation in vivo after implantation into mice. The underlying mechanism was upregulating methylation level of histone H3 at lysine 4 in the promoter regions of the osteogenic genes Runx2 and osteocalcin, by inhibiting the demethylase retinoblastoma-binding protein 2.51 In our study, the fluorescence intensity of osteocalcin increased on 20 V and 30 V nanotubes, ie, on nanotubes with diameters of 43±10 nm and 79±32 nm, respectively, which included the optimum diameter of 70 nm reported by Lv et al.52
The osteogenic differentiation of Saos-2 cells on nanotube-modified surfaces in our study was in most parameters higher than on flat-glass and Ti_C surfaces. Nanostructures in general have been observed to support the osteogenic differentiation of stem cells and osteoblasts and the osseointegration of the implants. The ALP activity of mesenchymal stem cells was slightly higher on pure TiO2 nanotubes compared to smooth Ti.53 The beneficial effect of nanotubes on the material surface and on the osteogenic differentiation of cells can be further enhanced by loading these nanotubes with bioactive molecules. For example, a more pronounced increase in the ALP activity of mesenchymal stem cells was observed on TiO2 nanotubes loaded with BMP2 and on TiO2 coated with gelatin/chitosan and loaded with BMP2.53
Anodized grade II Ti that was implanted in rabbits showed stronger removal torque after 6 weeks; however, hydrothermal treatment after anodization impaired the results.54 Concurrently, bone contact at the implants’ interface was similar. Control Ti-6Al-7Nb and anodization-cyclic precalcification heat-treated (APH) Ti6Al-7Nb were tested in vitro and implanted in vivo into rat tibias.28 Increased ALP activity was observed on APH samples on day 14 and 21 compared to the control sample. After a 4-week implantation, new bone was formed on the surface of the APH sample, but no bone was formed with the control samples. After 6 weeks, both samples were osseointegrated similarly.
Conclusion
In the present study, nanotubes of different diameter were prepared by anodic oxidation on Ti-6Al-4V at 10 V, 20 V, and 30 V. The increased voltage increased the nanotube diameter and wall thickness, and enlarged the histogram of nanotube diameters. The samples were evaluated in vitro with human osteoblast-like Saos-2 cells. Initial cell adhesion and cell proliferation were similar regardless of the nanotube size during a 7-day culture. However, the 30 V nanotube samples increased mainly the concentration of focal adhesion proteins talin and vinculin in Saos-2 cells. On the other hand, 20 V and 10 V nanotubes more effectively enhanced the osteogenic differentiation of Saos-2 cells compared to 30 V nanotubes. This was proved by the increased concentration of early and mid-term osteogenic markers, such as type I collagen, ALP, and osteopontin, compared to both the 30 V and control Ti-6Al-4V sample. Ti-6Al-4V modified with 20 V nanotubes seems to be the most promising for tissue engineering and for further in vivo evaluation on pigs, which is in progress.
Acknowledgments
This work was supported by the Grant Agency of the Ministry of Health of the Czech Republic (project NT13297-4/2012, the Grant Agency of the Czech Republic (grant 15-01558S), the Technology Agency of the Czech Republic (project TA02010409), and the BIOCEV – Biotechnology and Biomedicine Centre of the Academy of Sciences and Charles University project (CZ.1.05/1.1.00/02.0109), funded by the European Regional Development Fund. The authors thank Ivana Zajanova (Institute of Physiology, Czech Academy of Sciences, Prague) for help with immunofluorescence staining, Eva Jablonska (University of Chemistry and Technology, Prague) for preparing samples with cells for SEM images, and Mrs Paula Solon for her language revision of the manuscript.
Disclosure
The authors report no conflicts of interest in this work.
References
Candel JJ, Amigo V. Recent advances in laser surface treatment of titanium alloys. J Laser Appl. 2011;23(2):022005. | ||
Guo J, Padilla RJ, Ambrose W, De Kok IJ, Cooper LF. The effect of hydrofluoric acid treatment of TiO2 grit blasted titanium implants on adherent osteoblast gene expression in vitro and in vivo. Biomaterials. 2007;28(36):5418–5425. | ||
Chu CL, Hu T, Zhou J, et al. Effects of H2O2 pretreatment on surface characteristics and bioactivity of NaOH-treated NiTi shape memory alloy. Trans Nonferrous Metal Soc China. 2006;16(6):1295–1300. | ||
Kim HW, Koh YH, Li LH, Lee S, Kim HE. Hydroxyapatite coating on titanium substrate with titania buffer layer processed by sol-gel method. Biomaterials. 2004;25(13):2533–2538. | ||
Lu X, Zhao Z, Leng Y. Biomimetic calcium phosphate coatings on nitric-acid-treated titanium surfaces. Mater Sci Eng C Mater Biol Appl. 2007;27(4):700–708. | ||
Tamilselvi S, Raghavendran HB, Srinivasan P, Rajendran N. In vitro and in vivo studies of alkali- and heat-treated Ti-6Al-7Nb and Ti-5Al-2Nb-1Ta alloys for orthopedic implants. J Biomed Mater Res A. 2009;90(2):380–386. | ||
Nebe B, Finke B, Lüthen F, et al. Improved initial osteoblast functions on amino-functionalized titanium surfaces. Biomol Eng. 2007;24(5):447–454. | ||
Balakrishnan M, Narayanan R. Synthesis of anodic titania nanotubes in Na2SO4/NaF electrolyte: a comparison between anodization time and specimens with biomaterial based approaches. Thin Solid Films. 2013;540:23–30. | ||
Gregory CA, Gunn WG, Peister A, Prockop DJ. An Alizarin red-based assay of mineralization by adherent cells in culture: comparison with cetylpyridinium chloride extraction. Anal Biochem. 2004;329(1):77–84. | ||
Li Y, Ding D, Ning C, et al. Thermal stability and in vitro bioactivity of Ti-Al-V-O nanostructures fabricated on Ti6Al4V alloy. Nanotechnology. 2009;20(6):065708. | ||
Macak JM, Tsuchiya H, Taveira L, Ghicov A, Schmuki P. Self-organized nanotubular oxide layers on Ti-6A1-7Nb and Ti-6A1-4V formed by anodization in NH4F solutions. J Biomed Mater Res A. 2005;75A(4):928–933. | ||
Oh S, Brammer KS, Li YS, et al. Stem cell fate dictated solely by altered nanotube dimension. Proc Natl Acad Sci U S A. 2009;106(7):2130–2135. | ||
Sjöström T, Lalev G, Mansell JP, Su B. Initial attachment and spreading of MG63 cells on nanopatterned titanium surfaces via through-mask anodization. Appl Surf Sci. 2011;257(10):4552–4558. | ||
Brammer KS, Oh S, Cobb CJ, Bjursten LM, van der Heyde H, Jin S. Improved bone-forming functionality on diameter-controlled TiO2 nanotube surface. Acta Biomater. 2009;5(8):3215–3223. | ||
Brammer KS, Oh S, Frandsen CJ, Varghese S, Jin S. Nanotube surface triggers increased chondrocyte extracellular matrix production. Mater Sci Eng C Mater Biol Appl. 2010;30(4):518–525. | ||
Park J, Bauer S, Schlegel KA, Neukam FW, von der Mark K, Schmuki P. TiO2 nanotube surfaces: 15 nm – an optimal length scale of surface topography for cell adhesion and differentiation. Small. 2009;5(6):666–671. | ||
Matejka R. ALICE: fluorescent image analyser (version 1.0) [software]. Available from: http://alice.fbmi.cvut.cz. Accessed August 24, 2015. | ||
Lowry OH, Rosebrough NJ, Farr AL, Randall RJ. Protein measurement with the Folin phenol reagent. J Biol Chem. 1951;193(1):265–275. | ||
National Institute of Standards and Technology. NIST standard reference database online database list: Free standard reference databases by SRD number. 2015. Available from: http://www.nist.gov/srd/onlinelist.cfm. Accessed August 7, 2015. | ||
Habazaki H, Fushimi K, Shimizu K, Skeldon P, Thompson GE. Fast migration of fluoride ions in growing anodic titanium oxide. Electrochem Commun. 2007;9(5):1222–1227. | ||
Wang L, Zhao TT, Zhang Z, Li G. Fabrication of highly ordered TiO2 nanotube arrays via anodization of Ti-6Al-4V alloy sheet. J Nanosci Nanotechnol. 2010;10(12):8312–8321. | ||
Moon SH, Lee SJ, Park IS, et al. Bioactivity of Ti-6Al-4V alloy implants treated with ibandronate after the formation of the nanotube TiO2 layer. J Biomed Mater Res B Appl Biomater. 2012;100(8):2053–2059. | ||
Pérez-Jorge C, Conde A, Arenas MA, et al. In vitro assessment of Staphylococcus epidermidis and Staphylococcus aureus adhesion on TiO2 nanotubes on Ti-6Al-4V alloy. J Biomed Mater Res A. 2012;100(7):1696–1705. | ||
Neacsu P, Mazare A, Cimpean A, et al. Reduced inflammatory activity of RAW 264.7 macrophages on titania nanotube modified Ti surface. Int J Biochem Cell Biol. 2014;55:187–195. | ||
Sista S, Nouri A, Li Y, Wen C, Hodgson PD, Pande G. Cell biological responses of osteoblasts on anodized nanotubular surface of a titanium-zirconium alloy. J Biomed Mater Res A. 2013;101(12):3416–3430. | ||
Ross AP, Webster TJ. Anodizing color coded anodized Ti6Al4V medical devices for increasing bone cell functions. Int J Nanomedicine. 2013;8:109–117. | ||
Park JW, Kim HK, Kim YJ, Jang JH, Song H, Hanawa T. Osteoblast response and osseointegration of a Ti-6Al-4V alloy implant incorporating strontium. Acta Biomater. 2010;6(7):2843–2851. | ||
Nguyen TD, Moon SH, Oh TJ, Park IS, Lee MH, Bae TS. The effect of APH treatment on surface bonding and osseointegration of Ti-6Al-7Nb implants: an in vitro and in vivo study. J Biomed Mater Res B Appl Biomater. 2014;103(3):641–648. | ||
Weiner S, Wagner HD. The material bone: structure-mechanical function relations. Annu Rev Mater Sci. 1998;28:271–298. | ||
Kane R, Ma PX. Mimicking the nanostructure of bone matrix to regenerate bone. Mater Today (Kidlington). 2013;16(11):418–423. | ||
Minagar S, Li Y, Berndt CC, Wen C. The influence of titania-zirconia-zirconium titanate nanotube characteristics on osteoblasts cell adhesion. Acta Biomater. 2015;12:281–289. | ||
Lan MY, Liu CP, Huang HH, Lee SW. Both enhanced biocompatibility and antimicrobial activity in Ag-decorated TiO2 nanotubes. PLoS One. 2013;8(10):e75364. | ||
Czekanska EM, Stoddart MJ, Richards RG, Hayes JS. In search of an osteoblast cell model for in vitro research. Eur Cell Mater. 2012;24:1–17. | ||
Pautke C, Schieker M, Tischer T, et al. Characterization of osteosarcoma cell lines MG-63, Saos-2 cells and U-2 OS in comparison to human osteoblasts. Anticancer Res. 2004;24(6):3743–3748. | ||
Rodan SB, Imai Y, Thiede MA, et al. Characterization of a human osteosarcoma cell line (Saos-2) with osteoblastic properties. Cancer Res. 1987;47(18):4961–4966. | ||
Vandrovcova M, Jirka I, Novotna K, et al. Interaction of human osteoblast-like cells and MG-63 cells with thermally oxidized surfaces of a titanium-niobium alloy. Plos One. 2014;9(6):e100475. | ||
Ramaglia L, Postiglione L, Di Spigna G, Capece G, Salzano S, Rossi G. Sandblasted-acid-etched titanium surface influences in vitro the biological behavior of SaOS-2 human osteoblast-like cells. Dent Mater J. 2011;30(2):183–192. | ||
Minagar S, Li Y, Berndt CC, Wen C. The influence of titania-zirconia-zirconium titanate nanotube characteristics on osteoblast cell adhesion. Acta Biomater. 2015;12:281–289. | ||
Hempel U, Hefti T, Kalbacova M, Wolf-Brandstetter C, Dieter P, Schlottig F. Response of osteoblast-like SAOS-2 cells to zirconia ceramics with different surface topographies. Clin Oral Implants Res. 2010;21(2):174–181. | ||
Solař P, Kylián O, Marek A, et al. Particles induced surface nanoroughness of titanium surface and its influence on adhesion of osteoblast-like MG-63 cells. Appl Surf Sci. 2015;324:99–105. | ||
Vandrovcova M, Hanus J, Drabik M, et al. Effect of different surface nanoroughness of titanium dioxide films on the growth of human osteoblast-like MG63 cells. J Biomed Mater Res A. 2012;100(4):1016–1032. | ||
Park J, Bauer S, von der Mark K, Schmuki P. Nanosize and vitality: TiO2 nanotube diameter directs cell fate. Nano Lett. 2007;7(6):1686–1691. | ||
Yu WQ, Jiang XQ, Zhang FQ, Xu L. The effect of anatase TiO2 nanotube layers on MC3T3-E1 preosteoblast adhesion, proliferation, and differentiation. J Biomed Mater Res A. 2010;94(4):1012–1022. | ||
Kulkarni M, Mazare A, Gongadze E, et al. Titanium nanostructures for biomedical applications. Nanotechnology. 2015;26(6):062002. | ||
Bauer S, Park J, Faltenbacher J, Berger S, von der Mark K, Schmuki P. Size selective behavior of mesenchymal stem cells on ZrO2 and TiO2 nanotube arrays. Integr Biol (Camb). 2009;1(8–9):525–532. | ||
Anselme K, Ploux L, Ponche A. Cell/material interfaces: influence of surface chemistry and surface topography on cell adhesion. J Adhes Sci Technol. 2010;24(5):831–852. | ||
Gongadze E, Kabaso D, Bauer S, et al. Adhesion of osteoblasts to a nanorough titanium implant surface. Int J Nanomedicine. 2011;6:1801–1816. | ||
Webster TJ, Ergun C, Doremus RH, Siegel RW, Bizios R. Specific proteins mediate enhanced osteoblast adhesion on nanophase ceramics. J Biomed Mater Res. 2000;51(3):475–483. | ||
Gongadze E, Kabaso D, Bauer S, Park J, Schmuki P, Iglič A. Adhesion of osteoblasts to a vertically aligned TiO2 nanotube surface. Mini Rev Med Chem. 2013;13(2):194–200. | ||
Peng Z, Ni J, Zheng K, et al. Dual effects and mechanism of TiO2 nanotube arrays in reducing bacterial colonization and enhancing C3H10T1/2 cell adhesion. Int J Nanomedicine. 2013;8:3093–3105. | ||
Wang X, Yan C, Ye K, He Y, Li Z, Ding J. Effect of RGD nanospacing on differentiation of stem cells. Biomaterials. 2013;34(12):2865–2874. | ||
Lv L, Liu Y, Zhang P, et al. The nanoscale geometry of TiO2 nanotubes influences the osteogenic differentiation of human adipose-derived stem cells by modulating H3K4 trimethylation. Biomaterials. 2015;39:193–205. | ||
Hu Y, Cai K, Luo Z, et al. TiO2 nanotubes as drug nanoreservoirs for the regulation of mobility and differentiation of mesenchymal stem cells. Acta Biomater. 2012;8(1):439–448. | ||
Son WW, Zhu X, Shin HI, Ong JL, Kim KH. In vivo histological response to anodized and anodized/hydrothermally treated titanium implants. J Biomed Mater Res B Appl Biomater. 2003;66(2):520–525. |
Supplementary materials
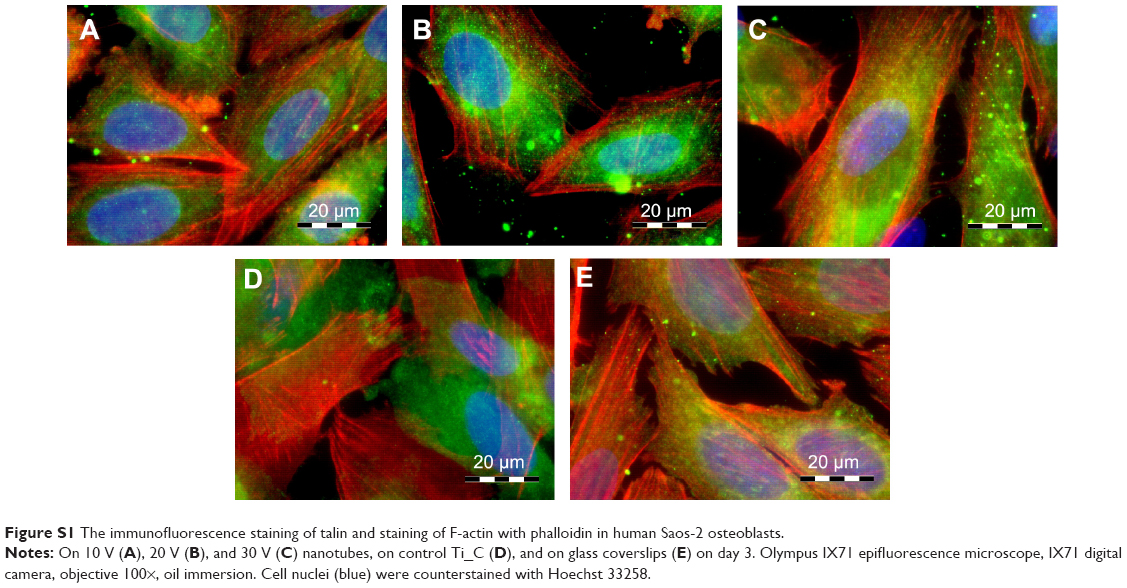 | Figure S1 The immunofluorescence staining of talin and staining of F-actin with phalloidin in human Saos-2 osteoblasts. |
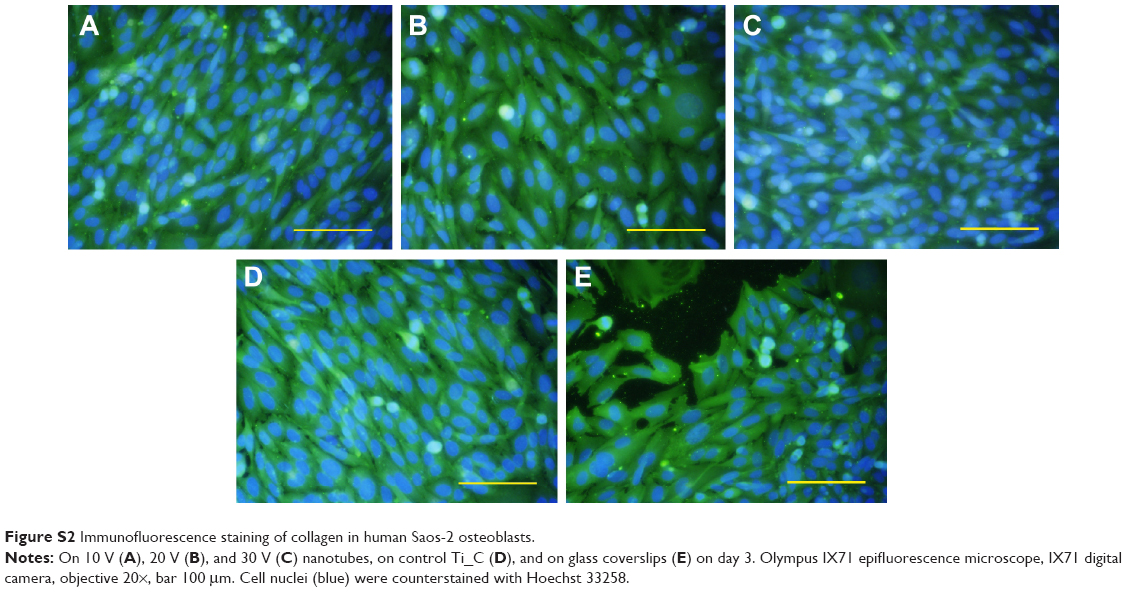 | Figure S2 Immunofluorescence staining of collagen in human Saos-2 osteoblasts. |
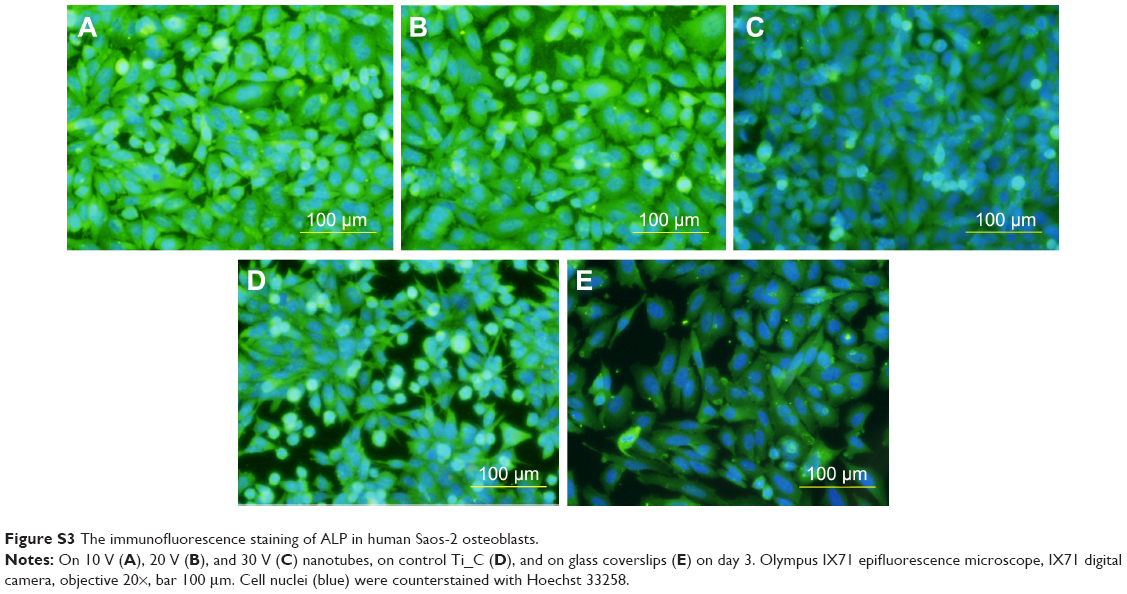 | Figure S3 The immunofluorescence staining of ALP in human Saos-2 osteoblasts. |
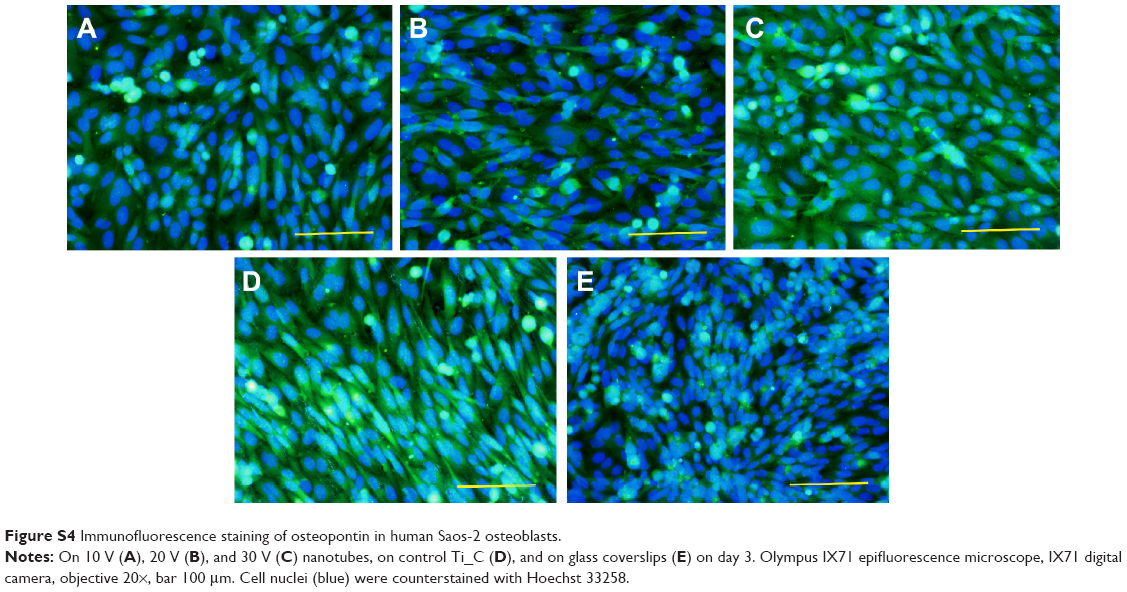 | Figure S4 Immunofluorescence staining of osteopontin in human Saos-2 osteoblasts. |
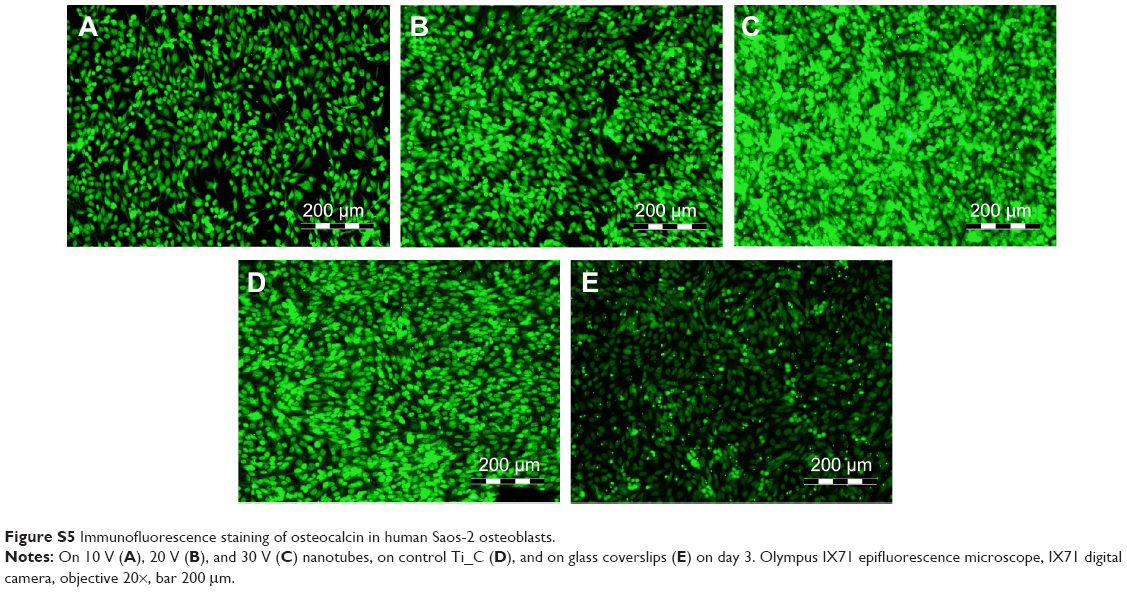 | Figure S5 Immunofluorescence staining of osteocalcin in human Saos-2 osteoblasts. |
 © 2015 The Author(s). This work is published and licensed by Dove Medical Press Limited. The
full terms of this license are available at https://www.dovepress.com/terms
and incorporate the Creative Commons Attribution
- Non Commercial (unported, 3.0) License.
By accessing the work you hereby accept the Terms. Non-commercial uses of the work are permitted
without any further permission from Dove Medical Press Limited, provided the work is properly
attributed. For permission for commercial use of this work, please see paragraphs 4.2 and 5 of our Terms.
© 2015 The Author(s). This work is published and licensed by Dove Medical Press Limited. The
full terms of this license are available at https://www.dovepress.com/terms
and incorporate the Creative Commons Attribution
- Non Commercial (unported, 3.0) License.
By accessing the work you hereby accept the Terms. Non-commercial uses of the work are permitted
without any further permission from Dove Medical Press Limited, provided the work is properly
attributed. For permission for commercial use of this work, please see paragraphs 4.2 and 5 of our Terms.