Back to Journals » Clinical Ophthalmology » Volume 10
The association of hematologic inflammatory markers with atherogenic index in type 2 diabetic retinopathy patients
Authors Akdogan M, Ustundag-Budak Y, Huysal K
Received 17 April 2016
Accepted for publication 9 August 2016
Published 16 September 2016 Volume 2016:10 Pages 1797—1801
DOI https://doi.org/10.2147/OPTH.S110749
Checked for plagiarism Yes
Review by Single anonymous peer review
Peer reviewer comments 3
Editor who approved publication: Dr Scott Fraser
Müberra Akdoğan,1 Yasemin Ustundag-Budak,2 Kagan Huysal2
1Department of Ophtalmology, 2Department of Clinical Laboratory, Yüksek İhtisas Education and Research Hospital, Bursa, Turkey
Background: Atherogenic dyslipidemia is particularly common in people with type 2 diabetes (DM2). Platelets from patients with DM2 have increased reactivity and baseline activation. The aim of the present study is to evaluate the relationship between atherogenic index and hematologic inflammatory markers and to evaluate the relationship between these parameters and associated variables in diabetic retinopathy (DR) patients.
Methods: The medical records of all patients admitted to the eye clinic between January and December 2014 were evaluated systematically. Laboratory parameters of 278 outpatients with DM2 diagnosed after the age of 30 years and 107 healthy subjects were analyzed.
Results: The DM2 + DR group consisted of 120 patients (47 males and 73 females; mean age 59.8±9.2 years). The DM2 without DR group consisted of 158 patients (59 males and 99 females; mean age 57.3±12.2 years). Mean platelet volume, platelet distribution width (PDW), platelet–lymphocyte (P/L) ratio, triglycerides, and atherogenic index were higher in DM2 patients than in control patients, but there was no difference between the DM2 + DR and the DM2 without DR groups. Only P/L ratio was different in the DM2 + DR patients compared to the DM2 without DR patients. Hemoglobin A1c levels correlated very weakly with the mean platelet volume, PDW, P/L ratio, and the red cell distribution width. The atherogenic index was very weakly correlated with the P/L ratio, PDW, and red cell distribution width.
Conclusion: Dyslipidemia-induced inflammation contributes to pathological processes that lead to retinopathy in DR patients.
Keywords: type 2 diabetes mellitus, diabetes complications, platelets, erythrocyte indices, triglycerides
Introduction
Diabetes mellitus (DM) is one of the most common chronic diseases in nearly all countries, and it has a prevalence of ~7.9% in Turkey.1,2
Microvascular complications of DM include retinopathy, nephropathy, and neuropathy. Diabetic retinopathy (DR) is responsible for decreased vision and blindness; studies estimate that 28.5%–40.3% of patients with type 2 diabetes (DM2) had DR.3 Retinal abnormalities in DR patients are microaneurysms, intraretinal hemorrhages, lipid exudates, macular edema, capillary occlusion, cotton-wool spots, retinal thickening, and neovascularization.4 The duration of hyperglycemia and abnormal blood lipid levels (such as, total cholesterol, low-density lipoprotein [LDL], and triglyceride) are defined risk factors for development and progression of DR.4
Evidence suggests that platelets from patients with DM2 have increased reactivity and baseline activation compared to healthy controls.5 Mean platelet volume (MPV) and platelet distribution width (PDW) are biomarkers of platelet activation.6,7 Recently, MPV, PDW, platelet-to-lymphocyte (P/L) ratio, and neutrophil-to-lymphocyte (N/L) ratio have been designated as predictors of microvascular complications of diabetes.8 Hematological indices, such as N/L and P/L ratios, and MPV were introduced as novel markers of systemic inflammatory responses.9 Moreover, association between MPV and impaired glucose regulation in diabetic patients has also been reported.8
Atherogenic dyslipidemia is characterized by low high-density lipoprotein cholesterol (HDL-c) and/or high triglyceride levels. This dyslipidemia is particularly common in DM2 and has been reported to be associated with both microangiopathy and residual cardiovascular risk in DM2 patients.10–12 Recently, it has been shown that LDLs, rich in triglycerides, increase platelet reactivity.13 The atherogenic index of plasma (AIP) was calculated as log10[triglyceride/HDL-c] and correlates inversely with the size of LDL particles. High AIP is shown to reflect hyperinsulinemia and high C-reactive protein levels in the Turkish population.14
The aim of the present study is to evaluate the relationship between the atherogenic index and hematologic inflammatory markers and to evaluate the relationship between these parameters and associated variables in DR patients.
Materials and methods
This was a retrospective study conducted at the Bursa Yuksek Ihtisas Research and Education Hospital, which is a governmental hospital with 1,050 beds, located in the eastern area of Bursa, Turkey. This study complies with the Declaration of Helsinki. The study was approved by the Bursa Yuksek Ihtisas Ethics Committee. Written informed consent was not required because of the retrospective nature of the study.
A total of 500 outpatients with DM2 monitored by the eye clinic between January and December 2014 and 107 healthy subjects were included in this study. DM was diagnosed according to the American Diabetes Association criteria.14
All demographic and clinical features were collected retrospectively. Inclusion criteria for healthy controls and DM2 patients were age ≥30 years, being treated with oral antidiabetic therapy (sulfonylureas), and undergoing a dilated fundus examination. The selected patients were examined by the same ophthalmologist after pupil dilation, followed by color fundus photography.
This study defines retinopathy as proliferative retinopathy characterized by neovascularization, vitreous hemorrhage, and/or ablation of the retina. The DM2 + DR group consisted of 120 patients (47 males and 73 females) with a mean age of 59.8±9.2 years. The DM2 without DR group consisted of 158 patients (59 males and 99 females) with a mean age of 57.3±12.2 years. The control group consisted of 107 healthy subjects (49 males and 58 females) with a mean age of 60.8±11.6 years.
Patients were excluded if they had macrovascular complications, severe anemia, thrombocytopenia, myelodysplastic syndrome, coagulopathy and recent blood transfusion, history of stroke or central nervous system damage, or chronic renal insufficiency requiring dialysis. A total of 222 cases were excluded.
EDTA-anticoagulated blood samples were analyzed within 1 hour of venipuncture by an automatic blood counter (Mindray BC-5800; Mindray Biomedical Electronics Co., Ltd., Shenzhen, People’s Republic of China) and used for whole blood analysis.
Hemoglobin A1c (HbA1c) levels were analyzed with the MQ-2000 PT HbA1c analyzer (Shanghai Hui Zheng Medical Technology Co., Ltd., People’s Republic of China).
The levels of creatinine, total cholesterol, triglyceride, and HDL-c were determined using commercially available assay kits (Abbott Diagnostics, Abbott Park, IL, USA) with an Architect C16000 autoanalyzer (Abbott Diagnostics), and LDL-c was estimated using the Friedewald formula. The AIP was calculated as log(triglyceride/HDL-c).14 AIP values <0.11 are associated with low risk of atherosclerosis.15
Glomerular filtration rate (GFR) was estimated using the modification of diet in renal disease abbreviated equation: (GFR =186×[serum creatinine]−1.154×[age]−0.203×[0.742 if female]).16 GFR for the detection of chronic kidney disease is <60 mL/min/1.73 m2 in adults.16
Statistical analysis
Statistical analyses were carried out using the Statistical Package for Social Sciences for Windows, Version 21.0 (IBM Corporation, Armonk, NY, USA). Descriptive statistics for each variable were determined. Continuous data were expressed as mean ± standard deviation. After analyzing the normality, statistically significant differences between parameters with Gaussian distributions were tested by a Student’s t-test; variables with a non-Gaussian distribution were compared using the Mann–Whitney U-test. Pearson’s or Spearman’s correlation coefficients (for data that were not normally distributed) were calculated to evaluate the relationship between variables. A P-value <0.05 was considered as statistically significant.
Results
Table 1 shows the following results: there was no significant difference between the three groups regarding age, sex distribution, and body mass index (P>0.05).
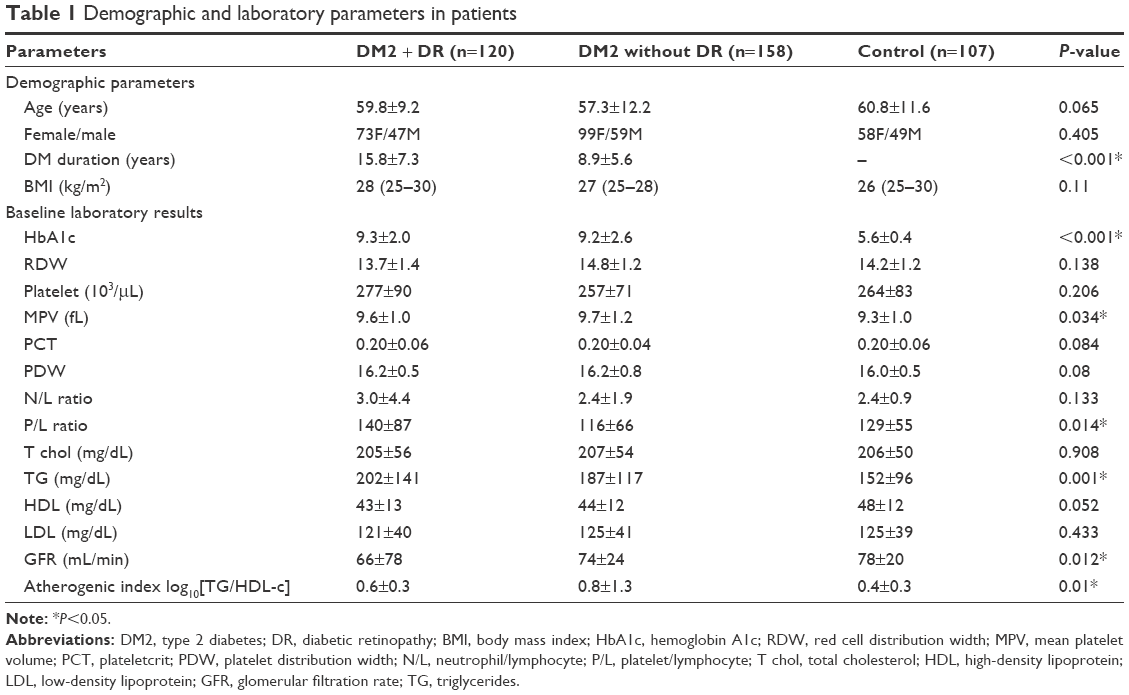 | Table 1 Demographic and laboratory parameters in patients |
The DM2 duration is longer (15.8±7.3 years vs 8.9±5.6 years) and GFR is lower in DM2 + DR compared to DM2 without DR patients.
MPV (Figure 1), PDW, triglycerides, and AIP were higher in DM2 patients compared to control patients, but there was no difference between DM2 + DR and the DM2 without DR patients. Only P/L ratio was different in the DM2 + DR patients compared to DM2 without DR and the control patients (Table 1).
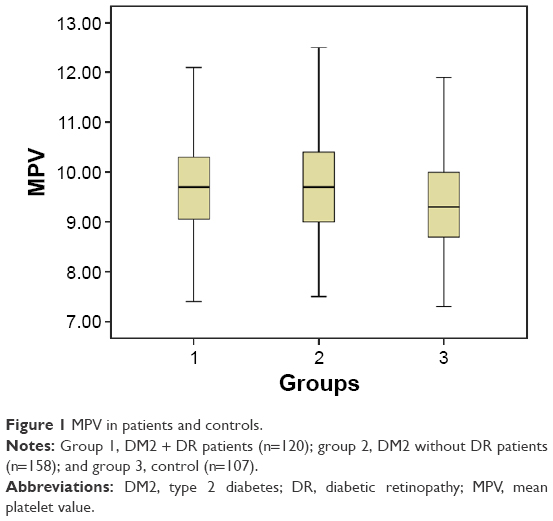 | Figure 1 MPV in patients and controls. |
There is a very weak correlation between the DM2 duration and P/L and the N/L ratios (Table 2). HbA1c levels correlated very weakly with MPV, PDW, and P/L and weakly with the red cell distribution width (RDW). The atherogenic index correlated very weakly with the P/L ratio, PDW, and RDW. None of the other correlations were statistically significant.
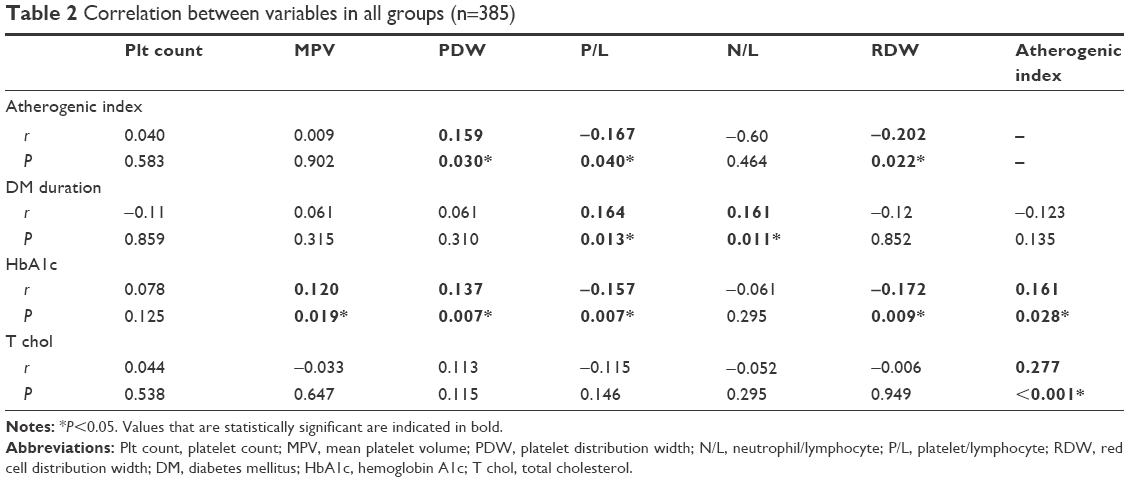 | Table 2 Correlation between variables in all groups (n=385) |
Discussion
The present study showed that inflammation was associated with platelet markers; MPV, PDW, and the P/L ratio were higher in DM2 patients than in controls, but there was no difference between patients with and without retinopathy.
MPV, the machine-calculated measure of thrombocyte volume, acts as a negative or positive acute phase reactant in different inflammatory conditions.7,17 MPV decreases in acute cases and increases in chronic cases.7 The current study is in accordance with previous studies, which showed association of increased MPV with diabetes previously.18,19 Demirtas et al8 also found that MPV, PDW, and P/L ratio were significantly higher in diabetic patients than in the control group, and MPV levels were associated with the DM2 + DR group. Although PDW was not high in DM2 patients, the PDW level correlated weakly with HbA1c in patients in the current study, similar to another recent study.20 PDW and MPV may be related to poor glycemic control, possibly due to the osmotic effect resulting from increased glucose levels and some of its metabolites in blood.21
In recent years, the P/L and N/L ratios were introduced as new inflammatory markers in different situations.22,23 The P/L ratio combines the predictive risk of platelet and lymphocyte counts.
Patients with DM2 + DR have the highest P/L ratio in the current study. An association between the P/L ratio and albuminuria in diabetic nephropathy patients has been determined previously.8,24 This relationship might be attributed to increased inflammation and impaired antioxidant status in this population. An increase in P/L ratio may reflect the increase in platelet count, and a decrease in lymphocyte count reflects an inflammatory state.25 In addition, elevated oxidative damage of lymphocytes in the hyperglycemia state causes lymphocyte apoptosis and may lead to increase in P/L ratio.26 In the current study, P/L ratio was weakly associated with the atherogenic index, suggesting that dyslipidemia-induced inflammation contributes to pathological processes that lead to retinopathy.
In the current study, HbA1c, which is a marker of long-term glycemic control, weakly correlated with MPV, PDW, RDW, P/L, and N/L ratios and atherogenic index. This is evidence that hyperglycemia induces nonenzymatic glycation of proteins on the surface of the platelets and erythrocytes, which decreases membrane fluidity and increases its reactivity.27 The link between hyperlipidemia and platelet hyperactivation is supported by the previous studies that lipid-lowering agents possess antithrombotic properties.28 Adak et al29 showed that hyperglycemia-induced oxidative stress leads to structural functional alterations in red blood cells.
Higher RDW levels were found to be associated with low HDL-c levels and unfavorable lipid profile in the normal population.30 Membrane fluidity is regulated by the cholesterol content, lipid composition, and protein–lipid interaction in cells, and cell functions are regulated by the cell membranes.31 The presence of a higher amount of cholesterol or advanced glycation end products may be responsible for creating a condition of lower fluidity. This also shows that erythrocyte membrane fatty acid components may contribute to alterations in membrane fluidity in patients with DM2, which may play an important role in the development of diabetic microangiopathy.32
Conflicting results have been reported for the relation of platelet count and diabetes. Several studies have reported no relation, while some have reported a positive association between diabetes and platelet count.33–35 The current study also found no relation between platelet count and diabetes.
This study has some limitations. It involves a single institution and may not represent the general population; the retrospective design is also a limitation of this study.
Disclosure
The authors report no conflicts of interest in this work.
References
Whiting DR, Guariguata L, Weil C, Shaw J. IDF diabetes atlas: global estimates of the prevalence of diabetes for 2011 and 2030. Diabetes Res Clin Pract. 2011;94(3):311–321. | ||
Onat A, Hergenc G, Uyarel H, Can G, Ozhan H. Prevalence, incidence, predictors and outcome of type 2 diabetes in Turkey. Anadolu Kardiyol Derg. 2006;6(4):314–321. | ||
Lee R, Wong TY, Sabanayagam C. Epidemiology of diabetic retinopathy, diabetic macular edema and related vision loss. Eye Vis (Lond). 2015;2:17. | ||
Ting DS, Cheung GC, Wong TY. Diabetic retinopathy: global prevalence, major risk factors, screening practices and public health challenges: a review. Clin Experiment Ophthalmol. 2015;44(4):260–277. | ||
Soma P, Swanepoel AC. Flow cytometric analysis of platelets type 2 diabetes mellitus reveals ‘angry’ platelets. Cardiovasc Diabetol. 2016;15:52. | ||
Budak YU, Huysal K, Demirci H. Correlation between mean platelet volume and B-type natriuretic peptide concentration in emergency patients with heart failure. Biochem Med. 2015;25(1):97–102. | ||
Margetic S. Inflammation and haemostasis. Biochem Med. 2012;22:49–62. | ||
Demirtas L, Degirmenci H, Akbas EM, et al. Association of haematological indices with diabetes, impaired glucose regulation and microvascular complications of diabetes. Int J Clin Exp Med. 2015;8:11420–11427. | ||
Qin B, Ma N, Tang Q, et al. Neutrophil to lymphocyte ratio (NLR) and platelet to lymphocyte ratio (PLR) were useful markers in assessment of inflammatory response and disease activity in SLE patients. Mod Rheumatol. 2016;26(3):372–376. | ||
Hermans MP, Ahn SA, Rousseau MF. The atherogenic dyslipidemia ratio [log(TG)/HDL-C] is associated with residual vascular risk, beta-cell function loss and microangiopathy in type 2 diabetes females. Lipids Health Dis. 2012;11:132. | ||
Onat A, Can G, Kaya H, Hergenç G. Atherogenic index of plasma (Log10 triglyceride/high-density lipoprotein-cholesterol) predicts high blood pressure, diabetes, and vascular events. J Clin Lipidol. 2010;4:89–98. | ||
Akbas EM, Timuroglu A, Ozcicek A, et al. Association of uric acid, atherogenic index of plasma and albuminuria in diabetes mellitus. Int J Clin Exp Med. 2014;7(12):5737–5743. | ||
Pedreño J, Hurt-Camejo E, Wiklund O, Badimón L, Masana L. Platelet function in patients with familial hypertriglyceridemia: evidence that platelet reactivity is modulated by apolipoprotein E content of very-low-density lipoprotein particles. Metabolism. 2000;49(7):942–949. | ||
American Diabetes Association. Classification and diagnosis of diabetes. Diabetes Care. 2016;39:S13–S22. | ||
Dobiasova M, Frohlich J. The plasma parameter log (TG/HDL-C) as an atherogenic index: correlation with lipoprotein particle size and esterification rate in apo B-lipoprotein-depleted plasma. Clin Biochem. 2001;34:583–588. | ||
Levey AS, Coresh J, Greene T, et al; Chronic Kidney Disease Epidemiology Collaboration. Using standardized serum creatinine values in the modification of diet in renal disease study equation for estimating glomerular filtration rate. Ann Intern Med. 2006;145(4):247–254. | ||
Ustundag-Budak Y, Polat M, Huysal K. The use of platelet indices, plateletcrit, mean platelet volume and platelet distribution width in emergency non-traumatic abdominal surgery: a systematic review. Biochem Med. 2016;26(2):178–193. | ||
Ozder A, Eker HH. Investigation of mean platelet volume in patients with type 2 diabetes mellitus and in subjects with impaired fasting glucose: a cost-effective tool in primary health care? Int J Clin Exp Med. 2014;7(8):2292–2297. | ||
Bavbek N, Kargili A, Kaftan O, Karakurt F, Kosar A, Akcay A. Elevated concentrations of soluble adhesion molecules and large platelets in diabetic patients: are they markers of vascular disease and diabetic nephropathy? Clin Appl Thromb Hemost. 2007;13(4):391–397. | ||
Alhadas K, Santos SN, Freitas MMS, Viana SMSA, Ribeiro LC, Costa MB. Are platelet indices useful in the evaluation of type 2 diabetic patients? J Bras Patol Med Lab. 2016;52:96–102. | ||
Dalamaga M, Karmaniolas K, Lekka A, et al. Platelet markers correlate with glycemic indices in diabetic, but not diabetic-myelodysplastic patients with normal platelet count. Dis Markers. 2010;29(1):55–61. | ||
Wu Y, Chen Y, Yang X, Chen L, Yang Y. Neutrophil-to-lymphocyte ratio (NLR) and platelet-to-lymphocyte ratio (PLR) were associated with disease activity in patients with systemic lupus erythematosus. Int Immunopharmacol. 2016;36:94–99. | ||
Kaya A, Kurt M, Tanboga IH, et al. Relation of neutrophil to lymphocyte ratio with the presence and severity of stable coronary artery disease. Clin Appl Thromb Hemost. 2014;20(5):473–477. | ||
Navarro JF, Mora C, Maca M, Garca J. Inflammatory parameters are independently associated with urinary albumin in type 2 diabetes mellitus. Am J Kidney Dis. 2003;42(1):53–61. | ||
Balta S, Demirkol S, Kucuk U. The platelet lymphocyte ratio may be useful inflammatory indicator in clinical practice. Hemodial Int. 2013;17:668–669. | ||
Adaikalakoteswari A, Rema M, Mohan V, Balasubramanyam M. Oxidative DNA damage and augmentation of poly (ADP-ribose) polymerase/nuclear factor-kappa B signaling in patients with type 2 diabetes and microangiopathy. Int J Biochem Cell Biol. 2007;39(9):1673–1684. | ||
Winocour PD, Watala C, Kinlough-Rathbone RL. Membrane fluidity is related to the extent of glycation of proteins, but not to alterations in the cholesterol to phospholipid molar ratio in isolated platelet membranes from diabetic and control subjects. Thromb Haemost. 1992;67(5):567–571. | ||
Tehrani S, Mobarrez F, Antovic A, et al. Atorvastatin has antithrombotic effects in patients with type 1 diabetes and dyslipidemia. Thromb Res. 2010;126(3):e225–e231. | ||
Adak S, Chowdhury S, Bhattacharyya M. Dynamic and electrokinetic behavior of erythrocyte membrane in diabetes mellitus and diabetic cardiovascular disease. Biochim Biophys Acta. 2008;1780(2):108–115. | ||
Lippi G, Sanchis-Gomar F, Danese E, Montagnana M. Association of red blood cell distribution width with plasma lipids in a general population of unselected outpatients. Kardiol Pol. 2013;71(9):931–936. | ||
Bernhardt I, Ellory JC. Red Cell Membrane Transport in Health and Diseases. Berlin, Heidelberg: Springer; 2003:2. | ||
Bakan E, Yildirim A, Kurtul N, Polat MF, Dursun H, Cayir K. Effects of type 2 diabetes mellitus on plasma fatty acid composition and cholesterol content of erythrocyte and leukocyte membranes. Acta Diabetol. 2006;43(4):109–113. | ||
Erdoğan S, Ozdemir O, Doğan HO, et al. Liver enzymes, mean platelet volume, and red cell distribution width in gestational diabetes. Turk J Med Sci. 2014;44(1):121–125. | ||
Akinsegun A, Akinola Olusola D, Sarah JO, et al. Mean platelet volume and platelet counts in type 2 diabetes: mellitus on treatment and non-diabetic mellitus controls in Lagos, Nigeria. Pan Afr Med J. 2014;18:42. | ||
Lippi G, Salvagno GL, Nouvenne A, Meschi T, Borghi L, Targher G. The mean platelet volume is significantly associated with higher glycated hemoglobin in a large population of unselected outpatients. Prim Care Diabetes. 2015;9(3):226–230. |
 © 2016 The Author(s). This work is published and licensed by Dove Medical Press Limited. The
full terms of this license are available at https://www.dovepress.com/terms
and incorporate the Creative Commons Attribution
- Non Commercial (unported, 3.0) License.
By accessing the work you hereby accept the Terms. Non-commercial uses of the work are permitted
without any further permission from Dove Medical Press Limited, provided the work is properly
attributed. For permission for commercial use of this work, please see paragraphs 4.2 and 5 of our Terms.
© 2016 The Author(s). This work is published and licensed by Dove Medical Press Limited. The
full terms of this license are available at https://www.dovepress.com/terms
and incorporate the Creative Commons Attribution
- Non Commercial (unported, 3.0) License.
By accessing the work you hereby accept the Terms. Non-commercial uses of the work are permitted
without any further permission from Dove Medical Press Limited, provided the work is properly
attributed. For permission for commercial use of this work, please see paragraphs 4.2 and 5 of our Terms.