Back to Journals » International Journal of Nanomedicine » Volume 13
Targeted delivery of reduced graphene oxide nanosheets using multifunctional ultrasound nanobubbles for visualization and enhanced photothermal therapy
Authors Liu Z ![]() , Zhang J, Tian Y, Zhang L, Han X, Wang Q, Cheng W
, Zhang J, Tian Y, Zhang L, Han X, Wang Q, Cheng W ![]()
Received 24 July 2018
Accepted for publication 23 September 2018
Published 22 November 2018 Volume 2018:13 Pages 7859—7872
DOI https://doi.org/10.2147/IJN.S181268
Checked for plagiarism Yes
Review by Single anonymous peer review
Peer reviewer comments 2
Editor who approved publication: Dr Linlin Sun
Zhao Liu,1,* Jia Zhang,2,* Yuhang Tian,1 Lei Zhang,1 Xue Han,1 Qiucheng Wang,1 Wen Cheng1
1Department of Ultrasound, Harbin Medical University Cancer Hospital, Nangang District, Harbin 150080, China; 2Key Laboratory of Microsystems and Microstructure Manufacturing, Ministry of Education, Harbin Institute of Technology, Harbin 150080, China
*These authors contributed equally to this work
Abstract: Ultrasound molecular imaging as a promising strategy, which involved the use of molecularly targeted contrast agents, combined the advantages of contrast-enhanced ultrasound with the photothermal effect of reduced graphene oxide (rGO).
Methods and results: The heparin sulfate proteoglycan glypican-3 (GPC3) is a potential molecular target for hepatocellular carcinoma (HCC). In this study, we covalently linked biotinylated GPC3 antibody to PEGylated nano-rGO to obtain GPC3-modified rGO-PEG (rGO-GPC3), and then combined rGO-GPC3 with avidinylated nanobubbles (NBs) using biotin-avidin system to prepare NBs-GPC3-rGO with photothermal effect and dispersibility, solubility in physiological environment. The average size of NBs-GPC3-rGO complex was 700.4±52.9 nm due to the polymerization of biotin-avidin system. Scanning electron microscope (SEM) showed NBs-GPC3-rGO attached to human hepatocellular carcinoma HepG2 cell. The ultrasound-targeted nanobubble destruction (UTND) technology make use of the physical energy of ultrasound exposure for the improvement of rGO delivery. Compared with other control groups, the highest nanobubble destruction efficiency of NBs-GPC3-rGO was attributed to the dissection effect of rGO on UTND. This is a positive feedback effect that leads to an increase in the concentration of rGO around the HepG2 cell. So NBs-GPC3-rGO using UTND and near-infrared (NIR) irradiation resulted in cell viability within 24 h, 48 h, 72 h lower than other treatment groups.
Conclusion: This work established NBs-GPC3-rGO as an ultrasonic photothermal agent due to its suitable size, imaging capability, photothermal efficiency for visual photothermal therapy in vitro.
Keywords: reduced graphene oxide, ultrasound-targeted nanobubble destruction, glypican-3, HepG2 cell, photothermal therapy
Corrigendum for this paper has been published
Introduction
Hepatocellular carcinoma (HCC) is the sixth most common malignant neoplasm in the world due to its high rates of recurrence and metastasis.1 A lot of progress has been made both in surgical and non-surgical therapies; however, patients are still subject to a very poor prognosis.1,2 Because of the propensity for metastasis, the 5-year survival rate of HCC patients is still very poor, and about 600,000 HCC patients die each year.3 Therefore, a novel therapeutic method is of high importance. Photothermal therapy (PTT), a non-invasive, highly selective and potentially efficient cancer therapy, has attracted significant attention in recent years.4,5 In typical PTT, photosensitizing materials are utilized by cells to generate a localized temperature increase upon light absorption, leading to photoablation of the cancer cells and subsequent cell death. For this reason, the photosensitizing materials must possess a high selectivity to tumor cells to avoid killing the healthy cells.6 In addition, the material should be able to strongly absorb near-infrared (NIR) light,7 which is considered to be the optimal optical window for PTT due to a high transparency of biological tissue, blood and water.8,9
Recently, graphene has attracted extensive attention in many fields owing to its excellent properties.10–17 In biomedicines, the high specific surface area and multi-functionalization allow graphene to be widely used as a carrier for both drug and gene delivery.18–21 In addition, the high photothermal responsivity and low toxicity of reduced nanosized graphene oxide (nano-rGO) make it a promising photo-absorbing agent for PTT.6 Nevertheless, the current performance evaluation relies heavily on imaging techniques, such as CT, MRI and fluorescence imaging, which must be carried out several hours to days after PTT treatment. What is worse, previous results indicate that rGO does not have imaging capabilities during the tumor ablation process. As a result, there is still lack of photosensitizing materials, which possess the capabilities of both transporting and imaging in real time.
Contrast-enhanced ultrasound as a mature technology has been applied for HCC patients for years in many countries. Over recent decades, ultrasound molecular imaging based on the advantage of contrast-enhanced ultrasound has attracted significant attention in preclinical research of HCC diagnosis and therapy.22,23 It is a promising imaging strategy with great potential for improving diagnostic accuracy compared to conventional ultrasound imaging in HCC detection.24 With the rapid development of ultrasound molecular imaging bionanotechnology, the nanobubble (NB) as an ultrasound contrast agent has been established. Subsequently, NBs can access the extravascular space and provide unique advantages for targeted specific ultrasound imaging due to their small size, stability, and novel physical and surface properties.22 Recently, ultrasound-targeted NB destruction (UTND), as a safe and effective method, has been able to destruct contrast agents in ultrasound-irradiated locations, which plays a substantial role in improving the efficient delivery of exogenous genes and drugs noninvasively by sonoporation of NBs.22,23,25,26 As a result, a novel contrast agent having a combination of rGO sheets with NBs can be synthesized, which has both ultrasound molecular imaging and photothermal capabilities; thus allowing monitoring of the PTT process in real time.
Herein, we synthesized a new theranostic nanoparticle containing nano-rGO-encapsulated NBs, which can achieve visualization and enhance the effect of PTT. In order to target the contrast agents, the composition was linked to a novel HCC biomarker, the heparin sulfate proteoglycan glypican-3 (GPC3), which is highly expressed in most HCC patients’ cancer cells, but not in normal adult tissues.27–33 Thus, given the HCC-specific nature of GPC3 expression, we hypothesized that ultrasound molecular imaging using GPC3-targeted NBs would allow transfecting of rGO sheets to the HCC cell membrane and highly accurate monitoring of the PTT process in real time. To the best of our knowledge, application of GPC3-coated and rGO-loaded NBs as ultrasonic photothermal agent directed at HCC cells has not been reported elsewhere, and is considered innovative.
Experimental section
Materials and synthesis process
Synthesis of avidinylated NBs
The biotin-avidin system can be used as a link to integrate large amounts of biotin-labeled agents with avidinlyated NBs, due to its unique properties, which is extremely stable over a wide range of temperature and pH value.34–36 The avidinylated NBs were synthesized by a modified emulsification process.37,38 In brief, three types of liposomes, 1,2-distearoyl-sn-glycero-3-phosphocholine (DSPC); 1, 2-distearoyl-sn-glycero-3-phosphoethanolamine-N-[methoxy(polyethylene glycol)-2000] (DSPE-PEG2000); and 1,2-distearoyl-sn-glycero-3-phosphoethanolamine-N-[biotinyl(polyethylene glycol)-2000] (DSPE-PEG2000-biotin), were purchased from Avanti Polar Lipids (Alabaster, AL, USA) and mixed in the molar ratio of 9:0.5:0.5. A certain amount of phospholipids were dissolved in the solvent of chloroform and methanol (2:1, v:v), and then the mixture was transferred into a rotary vacuum evaporator to remove the solvent at 55°C. Repeated dissolution and evaporation was carried out for three times. Then, the dried phospholipid compounds were hydrated in 5 mL of PBS (pH 7.4) at room temperature. The liposomal suspension was then transferred into a small sample vial, and the air above the solution was sucked and replaced with perfluoropropane (C3F8, Research Institute of Physical and Chemical Engineering of Nuclear Industry, Tianjin, China) gas. The admixture was then mechanically vibrated for 45 seconds in a dental amalgamator (YJT Medical Apparatuses and Instruments, Shanghai, China), and resuspended in 5 mL of sterile PBS. The supernatant was collected to acquire the non-targeted NBs. The NBs were subsequently washed with PBS and centrifuged at 800 rpm for 3 minutes to remove the unbound lipids. Finally, the concentration of NBs was estimated to be ~2×10⁸/mL by using a hemocytometer (Bürker-Türk, Wertheim, Germany). The size and dispersion of the NBs were detected by microscope (DM3000, Leica, Wetzlar, Germany) and the morphology of the NBs was examined using a transmission electron microscope (TEM) (JEM-1011, JEOL, Inc., Peabody, MA, USA).
To prepare fluorescence-labeled NBs, 50 μg of FITC-labeled avidin (SA, Beijing Biosynthesis Biotechnology Co., Ltd., Beijing, China) for each 1×10⁸/mL NBs was added and incubated for 30 minutes at room temperature.39 The avidinylated NBs were washed with 3 mL PBS three times and then centrifuged at 800 rpm for 3 minutes. FITC-labeled avidinylated NBs were observed by fluorescence microscope.
Synthesis of PEG functionalized graphene oxide (rGO-PEG)
Graphene oxide (GO) was synthesized using a modified Hummers’ method.20,40–42 The nano-size GO (nano-GO) was obtained after immersion sonication for 2 hours. To functionalize the nano-GO, 1.2 g of sodium hydroxide (NaOH) was added to the nano-GO suspension (1 mg/mL, 10 mL) and bath sonicated for 3 hours, followed by adjusting its pH value to one using hydrochloric acid (1 M). The mixture was neutralized and purified by repeated washing and centrifugation. Then, amine terminated six-arm branched PEG (2 mg/mL) was added into the abovementioned GO solution (1 mg/mL), and subjected to sonication for 5 minutes. N-(3-dimethylaminopropyl-N′-ethylcarbodiimide) hydrochloride (EDC; Sigma-Aldrich Co., St Louis, MO, USA) was then added to the mixture in two equal portions to give a final concentration of 1 mg/mL in total, followed by sonication for another 1 hour. The solution was then centrifuged at 10,000 rpm for 10 minutes in PBS for three times to remove any aggregates or multilayered GO sheets. The reaction mix was stirred overnight at room temperature, yielding a GO-PEG solution.
Hydrazine monohydrate was added into the nano-GO solution and heated at 80°C for 20 minutes to get aggregated nano-rGO sheets. These nano-rGO sheets were resuspended by bath sonication for 1 hour and then adjusted to a pH of 8.2 by adding NaOH. Centrifugation and dialysis was necessary to remove any aggregated sheets and oxygenic functional groups. The supernatant was collected after centrifugation and washed three times with 100 kDa molecular weight cutoff (MWCO) Millipore (EMD Millipore, Billerica, MA, USA) centrifuge filter at 4,000 rpm. Finally, nano-rGO-PEG solution was prepared and stored at 4°C for further usage. The covalent bonds in nano-GO-PEG and nano-rGO-PEG sheets were confirmed by various instrumental techniques such as Fourier transform infrared (FTIR, Nicolet 380, Thermo Electron Corporation, USA) analysis and X-ray diffraction (XRD) (Empyrean; Malvern Panalytical B.V., Almelo, the Netherlands) analysis.
Synthesis of biotinylated rGO-GPC3
Biotinylated cy7-conjugated GPC3 (Beijing Biosynthesis Biotechnology Co., Ltd.) antibody was dissolved in PBS as the stock solution (1 mg/mL). A solution of 20 μL of biotinylated cy7-conjugated anti-GPC3 was added to the rGO-PEG (20 mg/L, 1 mL) and the mixture was bath sonicated for 5 minutes. EDC was then added to the mixture to give a final concentration of 1 mg/mL. The mixture was stirred overnight at room temperature. Excess biotinylated cy7-conjugated anti-GPC3 was removed by centrifuge filtration through Amicon centrifugal filters (EMD Millipore) with 100 kDa MWCO and washed with distilled water for 4–5 times. UV-vis spectra of nano-GO, nano-rGO, rGO-GPC3-cy7 and free cy7 were performed using a UV-vis spectrometer (Lambda 35, PerkinElmer, Waltham, MA, USA).
Synthesis of NBs-GPC3-rGO
Next, 20 μL of biotinylated rGO-GPC3 per 108 NBs was added to the avidinylated NBs and incubated at 4°C for 1 hour. The mixture was then washed with PBS to remove unbound rGO-GPC3 and obtain NBs-GPC3-rGO. The size distribution and the zeta potential of NBs, avidinlyated NBs, NBs-GPC3-rGO solution were determined by dynamic light scattering measurements using Zetasizer Nano ZS90 analyzer (Malvern Instruments Ltd., Malvern, UK).
Detection of FITC-labeled biotinylated rGO-GPC3 conjugated with avidinylated NBs
Since the emission of Cy7 is near infrared, we used another dye, FITC, to prove the linkage of NBs-GPC3-rGO by using luminescence image. For the linkage, FITC-labeled biotinylated anti-GPC3 antibody (Beijing Biosynthesis Biotechnology Co., Ltd.) was added in the GPC3-rGO solution and incubated in the dark area. The fluorescence intensity of the biotinylated FITC-labeled rGO-GPC3 bound to avidinylated NBs was assessed by a flow cytometer (Becton Dickinson Co., Ltd., Franklin Lakes, NJ, USA).
Cell culture
HepG2 cells, a human HCC cell line, were purchased from Shanghai Yu Bo Biotech Co. Ltd and were cultured in minimum Eagle medium (MEM, Invitrogen, Carlsbad, CA, USA) supplemented with 10% FBS (Gibco, Carlsbad, CA, USA), and 1% penicillin/streptomycin. The cell cultures were maintained in a humidified atmosphere of 5% CO2 at 37°C with the medium changed every other day. The total cell count was determined by a hemocytometer (Bürker-Türk). Exponentially growing cells were used for all experiments.
Targeted binding of NBs-GPC3-rGO to HepG2 cells in vitro
The binding capacity of NBs-GPC3-rGO was tested on GPC3 receptor-positive HCC cells. HepG2 cells (5×10⁴/mL) were incubated in Costar six-well plates as monolayers in 90% MEM containing 10% FBS with 1% penicillin/streptomycin at 37°C in a humidified atmosphere containing 5% CO2 for 24 hours. After that, NBs-GPC3-rGO (1×10⁸/mL) was added into the cell medium in the six-well plates and incubated with HepG2 cells. After 1 hour of static exposure, the medium was removed and cells were washed with PBS three times to remove the unbound NBs-GPC3-rGO. After fixation, dehydration, drying and other steps, the NBs-GPC3-rGO bound to the HepG2 cells were examined by scanning electron microscope (SEM) (S-4100L, Hitachi, Tokyo, Japan).
Ultrasound destructibility of various nanoparticles in vitro
Ultrasound-mediated NBs destructibility analysis was performed by a previously developed method.43 In brief, NBs were exposed to ultrasound at a frequency of 1 MHz and an output intensity of 3.5 W/cm2 using a 20-mm probe (Institute of Ultrasound Imaging, Second Affiliated Hospital of Chongqing Medical University, Chongqing, China). There were three groups of NBs: blank (no sonication), avidinylated NBs and NBs-GPC3-rGO. Each ultrasound cycle included four frames of 30 seconds at a duty cycle of 50%. After ultrasound exposure, the concentrations of various NBs were assessed on a hemocytometer (Bürker-Türk). Each type of sample was treated and measured three times.
Cell toxicity assessment
PEGylated nano-rGO toxicity was determined by Cell Counting Kit-8 (CCK-8) assay. HepG2 cells growing in log phase were seeded at a density of 8×10³ cells/well (100 μL in volume per well) in 96-well assay plates for 24 hours and then treated with various concentrations of PEGylated nano-rGO for 48 hours. After washing the culture with PBS solution three times, 10 μL of CCK-8 solution was added to each well for 2 hours. The cell toxicity was measured with a microplate reader (BioTek, Winooski, VT, USA) at an absorbance of 450 nm.
Detection of reactive oxygen species (ROS)
Under NIR (808 nm) irradiation, extracellular ROS may be generated from two components, which are pure water and NBs-GPC3-rGO solution (20 mg/L). The extracellular ROS of a sample was detected using 1, 3-diphenylisobenzofuran (DPBF) as a probe. In brief, 30 μL of N, N-dimethylformamide solution containing DPBF (1 mg/mL) was added into a control group of 3 mL of the above two solutions. Then, these two solutions were irradiated under a NIR laser for various durations. After centrifugation, the optical absorbance of each solution at 410 nm was measured on a spectrophotometer (U-4100, Hitachi).
In vitro PTT after UTND
HepG2 cells were plated in 96-well plates at a density of 8×10³ cells/well in MEM complete media. After 1 hour of incubation at 37°C with NBs-GPC3-rGO, or control, the vials containing cell pellets were stored in ice until irradiation. The cells were incubated with NBs-GPC3-rGO (20 mg/L) or control at 37°C in a humidified atmosphere containing 5% CO2. After 1 hour of incubation, the wells were washed with PBS three times. The cell wells were divided into seven groups: 1) HepG2 cells with MEM only (negative control); 2) UTND only; 3) laser only; 4) NBs-GPC3-rGO only; 5) NBs-GPC3-rGO + UTND; 6) NBs-GPC3-rGO + laser; 7) NBs-GPC3-rGO + UTND + laser. UTND parameters were as follows: frequency (1 MHz); output intensity (1.0 W/cm2); and irradiation (1 minute/well). Laser parameters were as follows: wavelength (808 nm); output intensity (2.0 W/cm2) and irradiation (10 minutes/well). After the process, 100 μL of fresh medium was then added into each well. The plates were kept in the incubator for 24, 48 and 72 hours. Cell viability was estimated by the CCK-8 assay as described.
Statistical analysis
The SPSS 13.0 software package (SPSS Inc., Chicago, IL, USA) was used for statistical analysis. The level of significance in all statistical analyses was set at a probability of P<0.05. Data were presented as mean ± SD. The various groups were analyzed by analysis of variance and Student’s t-tests.
Results and discussion
The noninvasive ultrasound molecular imaging combined with the advantages of contrast-enhanced ultrasound can characterize neoplastic processes on a molecular level. It’s gaining acceptance is due in part to some of the inherent advantages of ultrasound, namely its lack of ionizing radiation, noninvasiveness, and high spatial and temporal sensitivity. It has many potential applications in the early detection of cancer, monitoring tumor characterization treatment response and guiding cancer therapies. Ultrasound molecular imaging contrast agents also have potential applications in the field of hyperthermia for the delivery of chemotherapeutic drugs and gene therapy. NBs as one of the promising contrast agents were widely used in drug delivery and they were also used to increase the location concentration of carrier loads upon ultrasonication. Herein, the avidinylated NBs were synthesized by a modified emulsification process (Figure 1).37,38 For the synthesis, DSPE-PEG2000 and DSPE-PEG2000-biotin were chosen as self-assembled shell of the NBs to encapsulate C3F8 gas. Also, they played a key role in stable dispersion of loads, which will be explained in detail later in the paper. These liposome NBs in suspension are a milk white color with a diameter of 292.2±13.3 nm (Figure 2A and Figure S1A and D) with a concentration of ~2×10⁸/mL. TEM image (Figure 2A inset) shows the spherical morphology of the NBs and confirms the range of size distribution. To prove the avidinylation of NBs, green dye FITC-labeled avidinylated NBs were synthesized and characterized by fluorescence microscopy. Figure 2C shows the green fluorescence emission from different parts, which correlates with the NB locations (Figure 2B), indicating the successful avidinylation of NBs. Meanwhile, the size distribution of these avidinylated of NBs increased to 467.6±11.5 nm (Figure S1B and E).
 | Figure 1 Schematic diagram of synthesis of NBs-GPC3-rGO constructed for rGO targeted delivery and photothermal therapy. |
 | Figure 2 Characterization of nanobubbles, proof the chains are convelent together. |
GO was prepared by a modified Hummers’ method42 with an initial lateral size of ~5 μm and single layer. To make it fit for injection, nano-GO sheets were obtained by horn ultrasonication. Figure 3A shows a typical AFM image of nano-GO sheets with a size of 50±13 nm. Then, amine-terminated six-arm branched PEG was covalently linked to the carboxylic acid group by amide reaction, which makes the nano-GO-PEG soluble and stable dispersive in buffer solution. Furthermore, hydrazine monohydrate was added into the nano-GO-PEG solution and heated at 80°C for 20 minutes. The color of this solution gradually changed from yellow to black during the heating, indicating the reduction of GO and formation of nano-rGO-PEG. UV-vis spectra of both nano-GO-PEG and nano-rGO-PEG are shown in Figure 3B; the shift of absorption peak (from ~230 to ~275 nm) and an increased absorption in visible and NIR region (Figure 3B inset) also confirm the recovery of conjugated π structure of graphene.44,45 Raman spectroscopy of nano-GO and nano-rGO was performed at room temperature using a Raman Microprobe (LabRAM HR800; Horiba Scientific, Jobin-Yvon, France) (Figure S2). For the nano-rGO-PEG sample, there was one peak at ~21.69° in XRD pattern, indicating that most oxygen functional groups were removed thereby leading to a successful reduction of GO (Figure S3).46,47 As absorption of NIR increased, about 9.2 times at 808 nm (Figure 3B), the photothermal heating became more effective, which is one of the key elements to phototherapy. The new broad peak that appeared at ~2,860 cm−1 both in nano-GO-PEG and nano-rGO-PEG samples in the FTIR spectra (Figure 2D) can be assigned to the symmetric stretching mode of the methylene groups of the PEG, indicating the PEG molecules were successfully conjugated to GO sheets, and such conjugation is quite stable even after chemical reduction. In addition, a strong peak at ~1,100 cm−1 in the nano-GO-PEG sample may be attributed to the vibration of −C–O– groups of PEG. The strong peaks at ~3,400 cm−1 and 1,650 cm−1 were probably due to many more −OH groups in nano-GO-PEG compared that in nano-rGO-PEG sample.
 | Figure 3 Characterization of reduced graphene oxide (rGO) sheets. (A) An AFM image of reduced nanographene oxide (nano-rGO). The image is on a 10 nm height scale. (B) A UV-vis-near-infrared (NIR) spectrum of nano-GO-polyethylene glycol (PEG) and nano-rGO-PEG solution. (C) Photothermal heating curves of the nano-rGO-PEG and nano-GO-PEG solutions and the deionized water (DIW) exposed to the 808 nm laser at a power density of 2 W/cm2. Black curve is 1 mL of solutions with 20 mg/L concentration of nano-rGO-PEG, red curve is nano-GO-PEG and dark blue curve is DIW. |
After conjugation to PEG, the nano-rGO-PEG solution was grafted with cy7-labled GPC3 biotin solution. The UV-vis spectra of pure cy7 dye showed a strong absorption peak at 749 nm with a small shoulder (Figure 2E), which was also visible after grafting with nano-rGO-PEG, confirming the conjugation of GPC3-Cy7 to the PEG. Furthermore, the fluorescence intensities of avidinylated NBs after incubation with FITC-labeled biotinylated rGO-GPC3 indicated that about 86.5% of avidinylated NBs were successfully conjugated with biotinylated rGO-GPC3 (Figure 2F). Finally, the size distribution increased to 700.4±52.9 nm (Figure S1C and F). The gradually increasing size of NBs also gives evidence for successful connecting of different parts. In addition, the zeta potential of NBs-GPC3-rGO (−18.74±2.02 mV) was lower than that of the NBs (−24.39±2.40 mV) indicating a slight decrease in its stability and dispersivity, as shown in Figure S4.
To evaluate the photothermal heating performance, the rise in temperature was plotted as the function of irradiation time of deionized water (DI water), nano-GO (20 mg/L) and nano-rGO (20 mg/L) at a power density of 2 W/cm2 of NIR (808 nm) shown in Figure 3C. The temperature of DI water increased slowly from 23°C to 30°C within 10 minutes, while that of the nano-GO solution exhibited a similar behavior with maximum value of 39°C within 10 minutes. This can be explained by the very weak absorption of DI water and nano-GO solution at a wavelength of 808 nm (Figure 3B). By contrast, the temperature of nano-rGO solution increased rapidly to 60°C at the same condition. Significantly, it readily reached 50°C (threshold of photoablation) within 3.4 minutes compared with that of 5 minutes in Dai’s work,6 indicating a more efficient photothermal heating of our nano-rGO solution. Furthermore, the nano-rGO solution showed a monotonical enhancement of photothermal heating performance with increasing concentration. The time required to reach the temperature of 50°C was about 4.7, 3.4 and 2.6 minutes for the concentrations of 10, 20 and 40 mg/L, respectively. The more nano-rGO the sheets contains, the more absorption of NIR, which is transformed to heat.
Furthermore, the avidinated NBs were linked to the nano-rGO-PEG-GPC3-biotin by the avidin-biotin system and formed the expected contrast-targeted delivery particles. (Figure 1). Then, it was incubated with the HepG2 cells in the Costar six-well plates. SEM image shows that a large amount of NBs-GPC3-rGO was targeted to the surface of HepG2 cells successfully (Figures 1, 2H and I bottom panel), while the original cell had a very clean surface (Figure 2G).
Ultrasound-targeted NB destructibility was assessed for avidinylated NBs, NBs-GPC3-rGO and Blank (NB solution without sonication). Figure 4A shows the concentration of NBs as a function of sonication time, from which the values of attenuation half-life (t/2) were 85 seconds and 54 seconds for the avidinylated NBs and NBs-GPC3-rGO, respectively, with significant difference between the two types of NBs and the Blank group (P<0.05). However, there was a statistically significant difference between avidinylated NBs and NBs-GPC3-rGO (P<0.05). The highest NB destruction efficiency of NBs-GPC3-rGO may be attributed to the dissection effect of rGO on UTND.
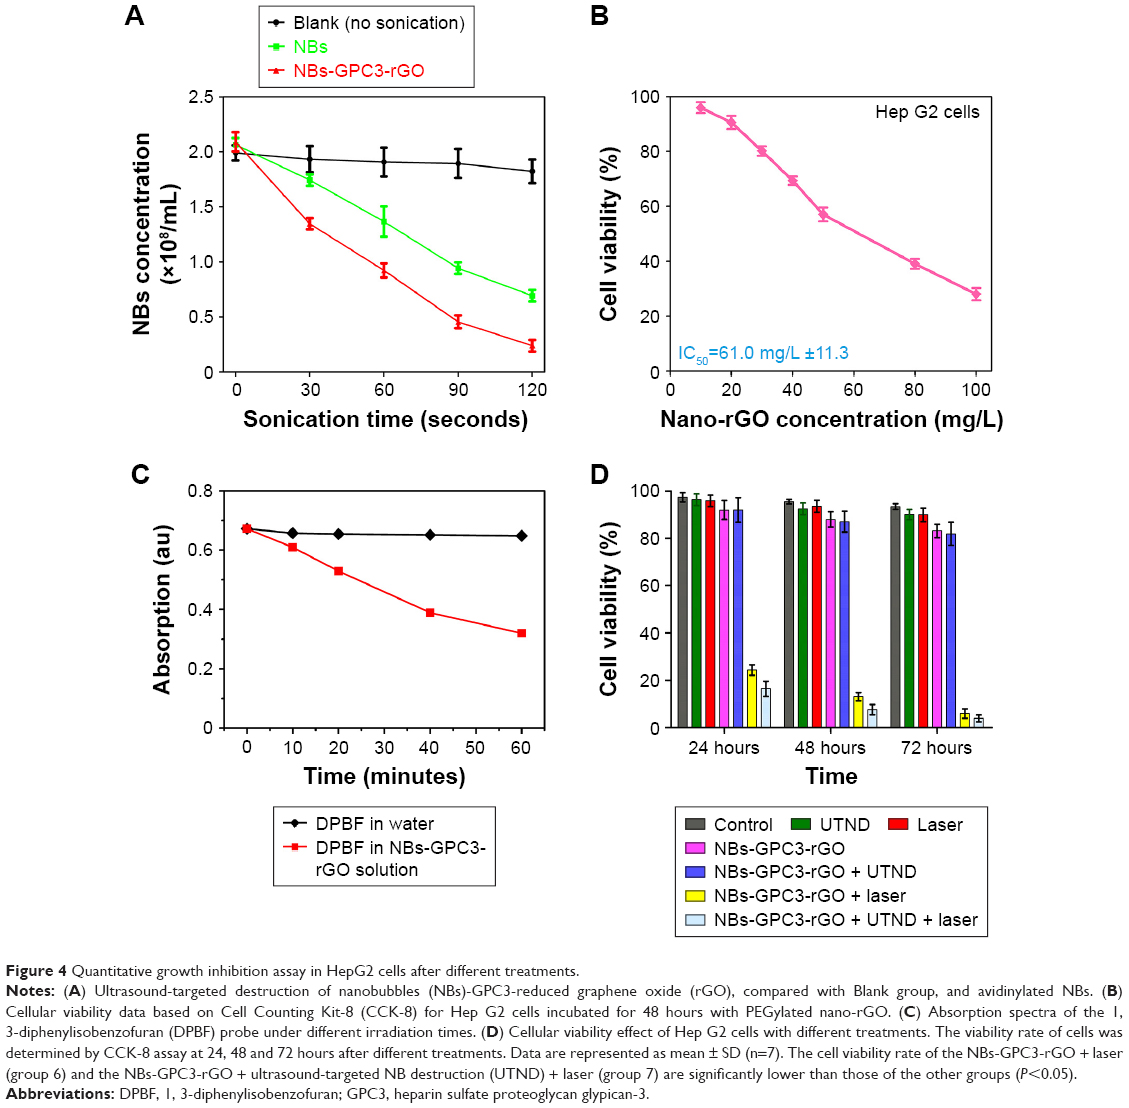 | Figure 4 Quantitative growth inhibition assay in HepG2 cells after different treatments. |
Further, we examined the biocompatibility of covalently PEGylated nano-rGO with HepG2 cell lines. The half maximal inhibitory concentration of nano-rGO-PEG was found to be ~61 mg/L for human HCC cell line HepG2 (Figure 4B). It is smaller than previously reported, however PEGylated nano-rGO decreased the viability of MCF-7 cells (a human breast cancer cell line) at ~80 mg/L. It shows that nano-rGO-PEG has a satisfactory toxicity assessment result. So, the concentration of nano-rGO should be much lower than 61 mg/L to ensure that the cell-killing ability comes from PTT and not from the toxicity itself. Also, the concentration-depended photothermal efficiency should be considered (Figure S5). As a result, a moderate concentration of 20 mg/L was taken except for special instruction while ensuring the better photothermal efficiency (Figure S5) and the lower cytotoxicity (Figure 4B) of nano-rGO in our experiments.
Moreover, photodynamic therapy (PDT) is a type of therapeutic approach that requires a photosensitizer to generate ROS to eliminate cancer tissues.48,49 For this purpose, the extracellular ROS generation of a sample was detected using DPBF as a probe. A decrement of DPBF characteristic absorption could be observed, accordingly. As shown in Figure 4C, the absorbance of the DPBF solution with NBs-GPC3-rGO decreased significantly as irradiation time went on, suggesting the sufficient ROS level was induced by NBs-GPC3-rGO. By contrast, the pure water led to very limited ROS generation with the same laser irradiation. Therefore, NBs-GPC3-rGO was used as a photosensitizer for executing PDT, which can be used as a supplementary treatment for PTT.
Finally, the effect of thermal therapy of our samples was evaluated by index of cell viability using CCK-8 assay. Figure 4D shows the cell viability rates of different treatment groups at 24, 48 and 72 hours. Almost all HepG2 cells incubated with NBs-GPC3-rGO were destroyed due to irradiation with 2 W/cm2 NIR light for 10 minutes with (group 7) or without (group 6) UTND, while all other groups showed near 100% viability. Compared with other treatment groups, the cell viability rates of groups (6) and (7) showed significantly lower efficiency (P<0.05), suggesting that NBs-GPC3-rGO with laser irradiation was the main factor of killing cells. Although there was no statistical difference between groups 6 and 7 (P>0.05), UTND had a positive effect on laser irradiation in reducing cell viability.
Upon the UTND, the NBs were found to be destroyed within a short time (Figure 4A). The rGO nanosheets were known as nano-knife or nano-blade and were used to cut bacteria and cell membrane with their sharp edges.50 Analogously, rGO nanosheet would also perform as a blade to cut the NBs, especially upon ultrasonication. As a result, the UTND efficiency is significantly improved by 50% at the same sonication time (Figure 4A) after linking the rGO nanosheets. Moreover, a large number of rGO sheets were covered with NBs through avidin-biotin system and kept in close contact with each other. When NBs-GPC3-rGO are destroyed using UTND, rGO-GPC3 can be released to increase the concentration of rGO around the HepG2 cells. rGO-GPC3 can be attached to the surface of the HepG2 cells due to the targeting effect of GPC3 antibodies. The nano-rGO solutions exhibited a concentration-dependent photothermal heating effect,6 which is in accordance with our results (Figures 3C and S5). In addition, UTND facilitates the transfer of extracellular molecules into cells via sonoporation. Therefore, in terms of the cell viability test, we noticed that the PTT effect of NBs-GPC3-rGO is the best compared with other groups, and its 72-hour cell viability rate is 2.26% (Figure 4D).
Conclusion
In summary, we have developed a new ultrasound contrast agent containing nano-rGO encapsulated NBs, which can achieve visualization and enhanced PTT. GPC3 works as a target probe molecule to specific sites on the surface of HepG2 cells. NBs-GPC3-rGO was destroyed under the ultrasound, which boosted the local concentration of rGO thereby enhancing the photothermal ablation of cancer cells under the NIR irradiation. As a result, within 72 hours, viability rate of cancer cells treated by PTT was approximately 2.26% under UTND and NIR laser treatment. Our results lay the foundation for further study and clinical application of GPC3-targeted ultrasound imaging in noninvasive surveillance during the process of PTT using rGO.
Acknowledgments
This work was supported by the National Natural Science Foundation of China (grant nos 81571682 and 61771156), HAI YAN Science Foundation of Harbin Medical University Cancer Hospital (grant no JJQN2018-18), Open Found of Key Laboratory of Microsystems and Microstructure Manufacturing Ministry of Education (HIT) (grant no 2016KM010).
Disclosure
The authors report no conflicts of interest in this work.
References
Global Burden of Disease Cancer Collaboration; Fitzmaurice C, Allen C, Barber RM, et al. Global, Regional, and National Cancer Incidence, Mortality, Years of Life Lost, Years Lived With Disability, and Disability-Adjusted Life-years for 32 Cancer Groups, 1990 to 2015: A Systematic Analysis for the Global Burden of Disease Study. JAMA Oncol. 2017;3(4):524–548. | ||
Song P, Tobe RG, Inagaki Y, et al. The management of hepatocellular carcinoma around the world: a comparison of guidelines from 2001 to 2011. Liver Int. 2012;32(7):1053–1063. | ||
Yu J, Xu QG, Wang ZG, et al. Circular RNA cSMARCA5 inhibits growth and metastasis in hepatocellular carcinoma. J Hepatol. 2018;68(6):1214–1227. | ||
Chen Z, Wang Q, Wang H, et al. Ultrathin PEGylated W18O49 nanowires as a new 980 nm-laser-driven photothermal agent for efficient ablation of cancer cells in vivo. Adv Mater. 2013;25(14):2095–2100. | ||
Yang K, Yang G, Chen L, et al. FeS nanoplates as a multifunctional nano-theranostic for magnetic resonance imaging guided photothermal therapy. Biomaterials. 2015;38:1–9. | ||
Robinson JT, Tabakman SM, Liang Y, et al. Ultrasmall reduced graphene oxide with high near-infrared absorbance for photothermal therapy. J Am Chem Soc. 2011;133(17):6825–6831. | ||
Liu Y, Ashton JR, Moding EJ, et al. A Plasmonic Gold Nanostar Theranostic Probe for In Vivo Tumor Imaging and Photothermal Therapy. Theranostics. 2015;5(9):946–960. | ||
Zha Z, Yue X, Ren Q, Dai Z. Uniform polypyrrole nanoparticles with high photothermal conversion efficiency for photothermal ablation of cancer cells. Adv Mater. 2013;25(5):777–782. | ||
Markovic ZM, Harhaji-Trajkovic LM, Todorovic-Markovic BM, et al. In vitro comparison of the photothermal anticancer activity of graphene nanoparticles and carbon nanotubes. Biomaterials. 2011;32(4):1121–1129. | ||
Bitounis D, Ali-Boucetta H, Hong BH, Min DH, Kostarelos K. Prospects and challenges of graphene in biomedical applications. Adv Mater. 2013;25(16):2258–2268. | ||
Feng L, Liu Z. Graphene in biomedicine: opportunities and challenges. Nanomedicine. 2011;6(2):317–324. | ||
Feng L, Zhang S, Liu Z. Graphene based gene transfection. Nanoscale. 2011;3(3):1252–1257. | ||
Yang X, Wang Y, Huang X, et al. Multi-functionalized graphene oxide based anticancer drug-carrier with dual-targeting function and pH-sensitivity. J Mater Chem. 2011;21(10):3448–3454. | ||
Ma X, Tao H, Yang K, et al. A functionalized graphene oxide-iron oxide nanocomposite for magnetically targeted drug delivery, photothermal therapy, and magnetic resonance imaging. Nano Res. 2012;5(3):199–212. | ||
Yang K, Feng L, Shi X, Liu Z. Nano-graphene in biomedicine: theranostic applications. Chem Soc Rev. 2013;42(2):530–547. | ||
Shen H, Zhang L, Liu M, Zhang Z. Biomedical applications of graphene. Theranostics. 2012;2(3):283–294. | ||
Shi X, Gong H, Li Y, Wang C, Cheng L, Liu Z. Graphene-based magnetic plasmonic nanocomposite for dual bioimaging and photothermal therapy. Biomaterials. 2013;34(20):4786–4793. | ||
Sun X, Liu Z, Welsher K, et al. Nano-Graphene Oxide for Cellular Imaging and Drug Delivery. Nano Res. 2008;1(3):203–212. | ||
Zhang L, Xia J, Zhao Q, Liu L, Zhang Z. Functional graphene oxide as a nanocarrier for controlled loading and targeted delivery of mixed anticancer drugs. Small. 2010;6(4):537–544. | ||
Liu Z, Robinson JT, Sun X, Dai H. PEGylated nanographene oxide for delivery of water-insoluble cancer drugs. J Am Chem Soc. 2008;130(33):10876–10877. | ||
Wang Y, Wang K, Zhao J, et al. Multifunctional mesoporous silica-coated graphene nanosheet used for chemo-photothermal synergistic targeted therapy of glioma. J Am Chem Soc. 2013;135(12):4799–4804. | ||
Kaneko OF, Willmann JK. Ultrasound for molecular imaging and therapy in cancer. Quant Imaging Med Surg. 2012;2(2):87. | ||
Mullick Chowdhury S, Wang TY, Bachawal S, et al. Ultrasound-guided therapeutic modulation of hepatocellular carcinoma using complementary microRNAs. J Control Release. 2016;238:272–280. | ||
Zheng SG, Xu HX, Liu LN. Management of hepatocellular carcinoma: The role of contrast-enhanced ultrasound. World J Radiol. 2014;6(1):7–14. | ||
Wu M, Zhao H, Guo L, et al. Ultrasound-mediated nanobubble destruction (UMND) facilitates the delivery of A10-3.2 aptamer targeted and siRNA-loaded cationic nanobubbles for therapy of prostate cancer. Drug Deliv. 2018;25(1):226–240. | ||
Song Z, Wang Z, Shen J, Xu S, Hu Z. Nerve growth factor delivery by ultrasound-mediated nanobubble destruction as a treatment for acute spinal cord injury in rats. Int J Nanomedicine. 2017;12:1717–1729. | ||
Yang X, Liu H, Sun CK, et al. Imaging of hepatocellular carcinoma patient-derived xenografts using 89Zr-labeled anti-glypican-3 monoclonal antibody. Biomaterials. 2014;35(25):6964–6971. | ||
Hsu HC, Cheng W, Lai PL. Cloning and expression of a developmentally regulated transcript MXR7 in hepatocellular carcinoma: biological significance and temporospatial distribution. Cancer Res. 1997;57(22):5179–5184. | ||
Gao W, Kim H, Feng M, et al. Inactivation of Wnt signaling by a human antibody that recognizes the heparan sulfate chains of glypican-3 for liver cancer therapy. Hepatology. 2014;60(2):576–587. | ||
Filmus J. Glypicans in growth control and cancer. Glycobiology. 2001;11(3):19R–23R. | ||
Shirakawa H, Kuronuma T, Nishimura Y, et al. Glypican-3 is a useful diagnostic marker for a component of hepatocellular carcinoma in human liver cancer. Int J Oncol. 2009;34(3):649–656. | ||
Wang HL, Anatelli F, Zhai QJ, Adley B, Chuang ST, Yang XJ. Glypican-3 as a useful diagnostic marker that distinguishes hepatocellular carcinoma from benign hepatocellular mass lesions. Arch Pathol Lab Med. 2008;132(11):1723–1728. | ||
di Tommaso L, Franchi G, Park YN, et al. Diagnostic value of HSP70, glypican 3, and glutamine synthetase in hepatocellular nodules in cirrhosis. Hepatology. 2007;45(3):725–734. | ||
Teulon JM, Delcuze Y, Odorico M, et al. Single and multiple bonds in (strept)avidin-biotin interactions. J Mol Recognit. 2011;24(3):490–502. | ||
Weber PC, Ohlendorf DH, Wendoloski JJ, Salemme FR. Structural origins of high-affinity biotin binding to streptavidin. Science. 1989;243(4887):85–88. | ||
Holmberg A, Blomstergren A, Nord O, Lukacs M, Lundeberg J, Uhlén M. The biotin-streptavidin interaction can be reversibly broken using water at elevated temperatures. Electrophoresis. 2005;26(3):501–510. | ||
Zhang Y, Chang R, Li M, Zhao K, Zheng H, Zhou X. Docetaxel-loaded lipid microbubbles combined with ultrasound-triggered microbubble destruction for targeted tumor therapy in MHCC-H cells. Onco Targets Ther. 2016;9(Issue 1):4763. | ||
Kang J, Wu X, Wang Z, et al. Antitumor effect of docetaxel-loaded lipid microbubbles combined with ultrasound-targeted microbubble activation on VX2 rabbit liver tumors. J Ultrasound Med. 2010;29(1):61–70. | ||
Stieger SM, Dayton PA, Borden MA, et al. Imaging of angiogenesis using Cadence contrast pulse sequencing and targeted contrast agents. Contrast Media Mol Imaging. 2008;3(1):9–18. | ||
Hummers WS, Offeman RE. Preparation of Graphitic Oxide. J Am Chem Soc. 1958;80(6):1339. | ||
Yang K, Zhang S, Zhang G, Sun X, Lee ST, Liu Z. Graphene in mice: ultrahigh in vivo tumor uptake and efficient photothermal therapy. Nano Lett. 2010;10(9):3318–3323. | ||
Zhang J, Hu P, Zhang R, et al. Soft-lithographic processed soluble micropatterns of reduced graphene oxide for wafer-scale thin film transistors and gas sensors. J Mater Chem. 2012;22(2):714–718. | ||
Tinkov S, Winter G, Coester C, Bekeredjian R. New doxorubicin-loaded phospholipid microbubbles for targeted tumor therapy: Part I – Formulation development and in-vitro characterization. J Control Release. 2010;143(1):143–150. | ||
Kim J, Kim F, Huang J. Seeing graphene-based sheets. Mater Today. 2010;13(3):28–38. | ||
Acik M, Lee G, Mattevi C, Chhowalla M, Cho K, Chabal YJ. Unusual infrared-absorption mechanism in thermally reduced graphene oxide. Nat Mater. 2010;9(10):840–845. | ||
Zhang J, Li J, Wang Z, et al. Low-Temperature Growth of Large-Area Heteroatom-Doped Graphene Film. Chemistry of Materials. 2014;26(7):2460–2466. | ||
Wojtoniszak M, Chen X, Kalenczuk RJ, et al. Synthesis, dispersion, and cytocompatibility of graphene oxide and reduced graphene oxide. Colloids Surf B Biointerfaces. 2012;89(1):79–85. | ||
Kuo WS, Chang YT, Cho KC, et al. Gold nanomaterials conjugated with indocyanine green for dual-modality photodynamic and photothermal therapy. Biomaterials. 2012;33(11):3270–3278. | ||
Rc L, Zhong CN, Rm L. A Multifunctional Anticancer Platform for Multimodal Imaging and Visible Light Driven Photodynamic/Photothermal Therapy. Chem Mater. 2015;(27):1751–1763. | ||
Papi M, Palmieri V, Bugli F, et al. Biomimetic antimicrobial cloak by graphene-oxide agar hydrogel. Sci Rep. 2016;6(1):12. |
Supplementary materials
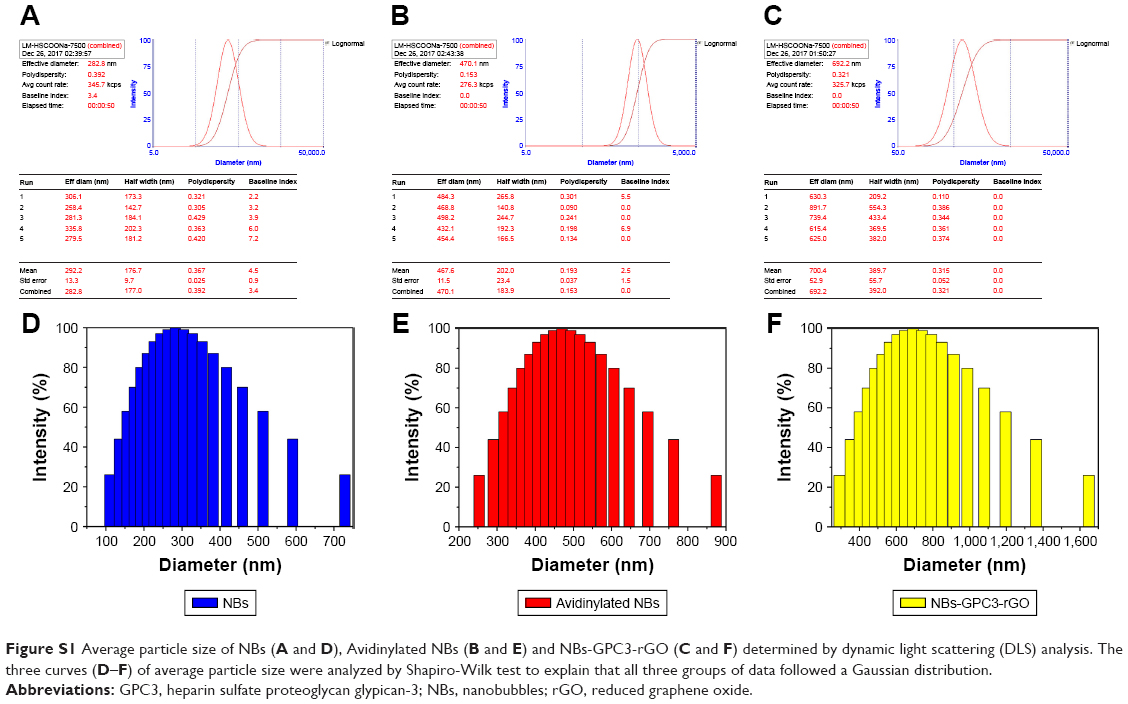 | Figure S1 Average particle size of NBs (A and D), Avidinylated NBs (B and E) and NBs-GPC3-rGO (C and F) determined by dynamic light scattering (DLS) analysis. The three curves (D–F) of average particle size were analyzed by Shapiro-Wilk test to explain that all three groups of data followed a Gaussian distribution. |
 | Figure S2 Raman spectroscopy was performed at room temperature using a Raman Microprobe (LabRAM HR800; Horiba Scientific, Jobin-Yvon, France). |
 | Figure S3 XRD patterns of nano-GO-PEG and nano-rGO-PEG. |
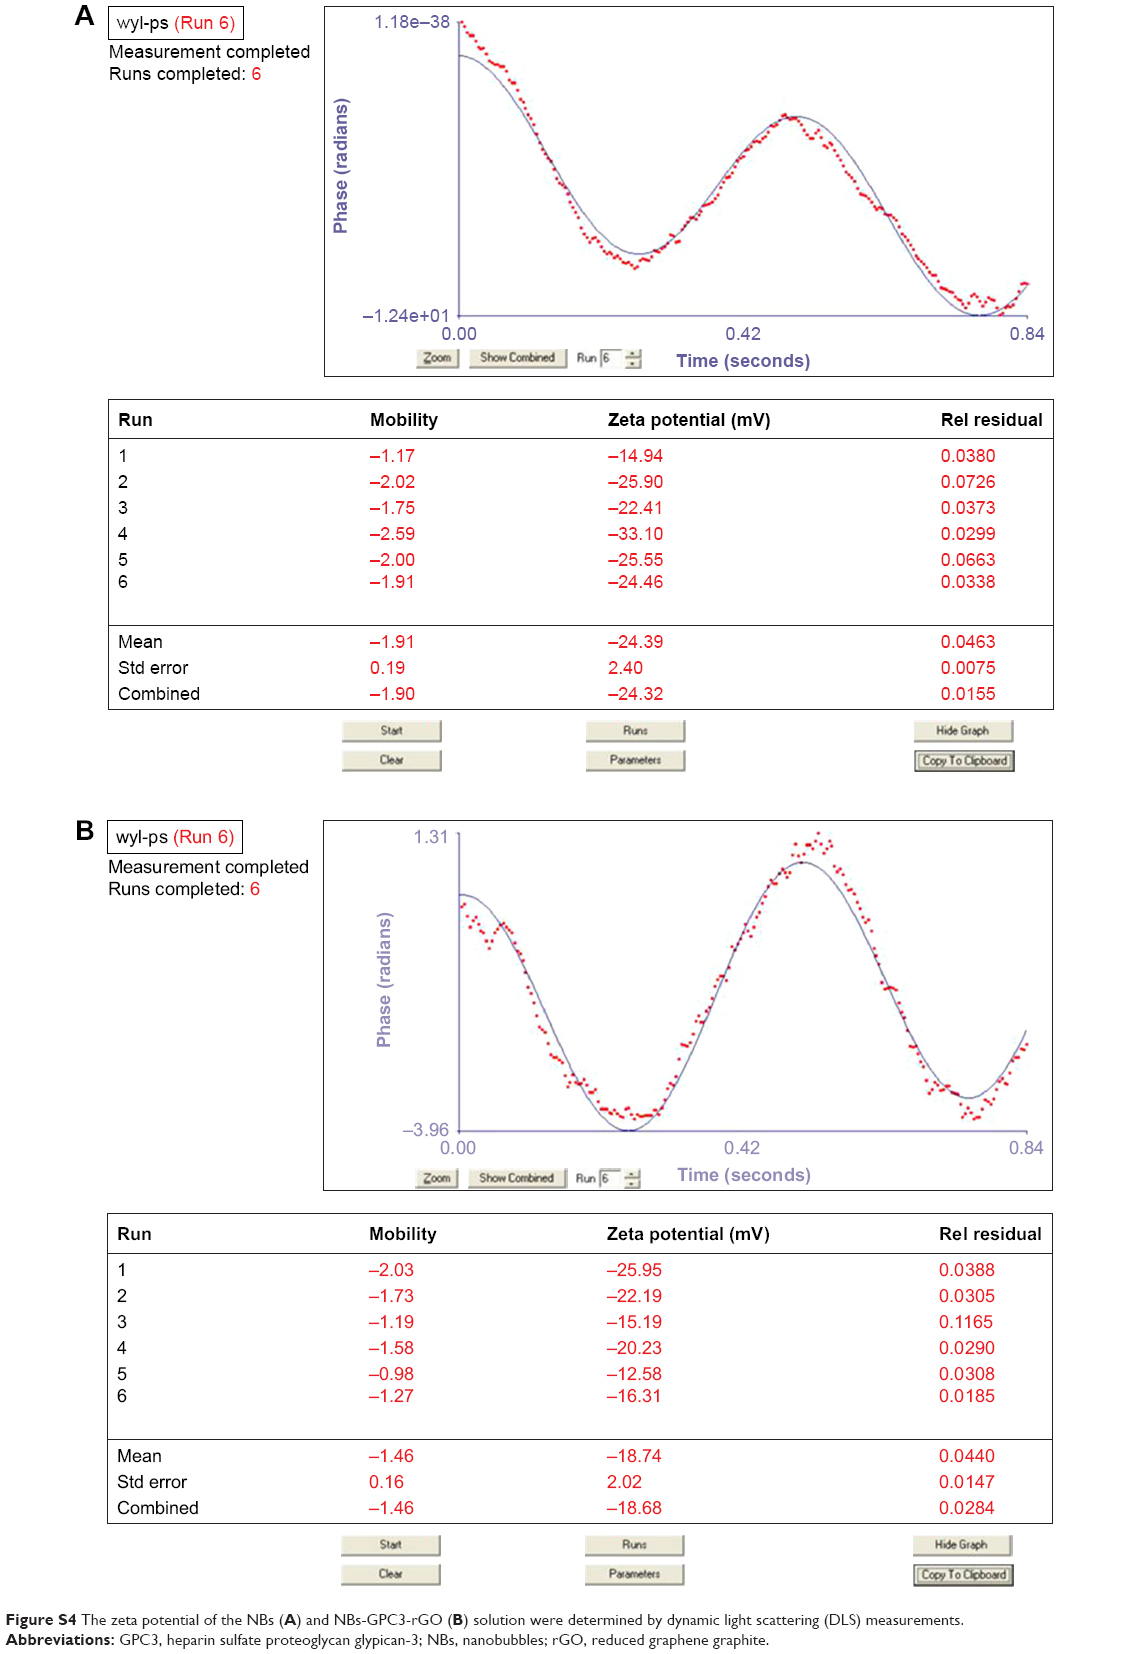 | Figure S4 The zeta potential of the NBs (A) and NBs-GPC3-rGO (B) solution were determined by dynamic light scattering (DLS) measurements. |
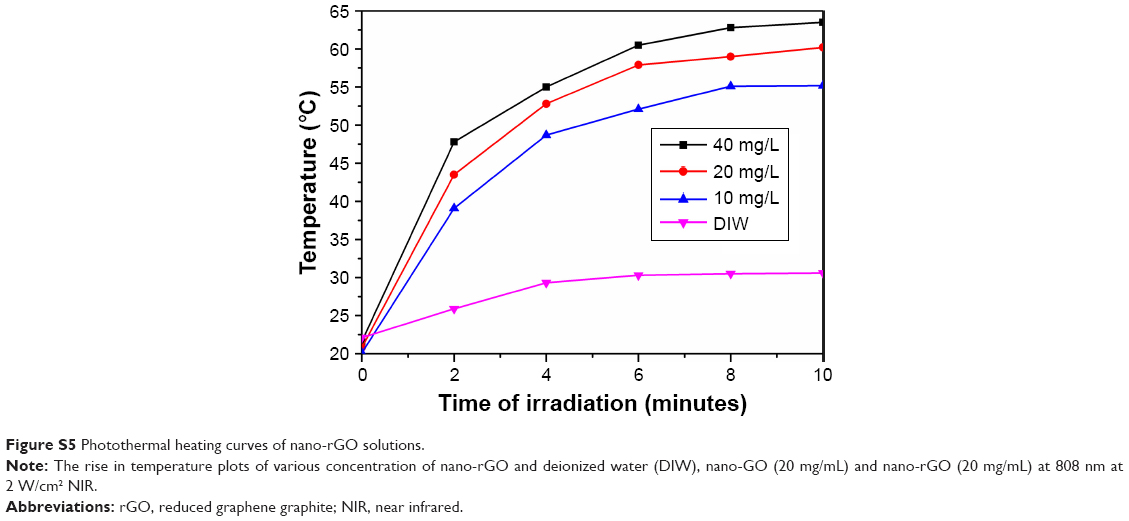 | Figure S5 Photothermal heating curves of nano-rGO solutions. |
 © 2018 The Author(s). This work is published and licensed by Dove Medical Press Limited. The
full terms of this license are available at https://www.dovepress.com/terms
and incorporate the Creative Commons Attribution
- Non Commercial (unported, 3.0) License.
By accessing the work you hereby accept the Terms. Non-commercial uses of the work are permitted
without any further permission from Dove Medical Press Limited, provided the work is properly
attributed. For permission for commercial use of this work, please see paragraphs 4.2 and 5 of our Terms.
© 2018 The Author(s). This work is published and licensed by Dove Medical Press Limited. The
full terms of this license are available at https://www.dovepress.com/terms
and incorporate the Creative Commons Attribution
- Non Commercial (unported, 3.0) License.
By accessing the work you hereby accept the Terms. Non-commercial uses of the work are permitted
without any further permission from Dove Medical Press Limited, provided the work is properly
attributed. For permission for commercial use of this work, please see paragraphs 4.2 and 5 of our Terms.