Back to Journals » International Journal of Nanomedicine » Volume 13
Surface-enhanced Raman spectroscopy of blood serum based on gold nanoparticles for tumor stages detection and histologic grades classification of oral squamous cell carcinoma
Authors Xue L, Yan B, Li Y ![]() , Tan Y, Luo X, Wang M
, Tan Y, Luo X, Wang M
Received 13 March 2018
Accepted for publication 5 June 2018
Published 31 August 2018 Volume 2018:13 Pages 4977—4986
DOI https://doi.org/10.2147/IJN.S167996
Checked for plagiarism Yes
Review by Single anonymous peer review
Peer reviewer comments 2
Editor who approved publication: Dr Linlin Sun
Lili Xue,1 Bing Yan,2 Yi Li,3 Yingyun Tan,4 Xianyang Luo,2 Min Wang1
1State Key Laboratory of Oral Diseases & National Clinical Research Center for Oral Diseases & Department of Prosthodontics, West China Hospital of Stomatology, Sichuan University, Chengdu, China; 2Department of Otolaryngology Head and Neck Surgery, The First Affiliated Hospital of Xiamen University, Xiamen, China; 3Department of Head and Neck Oncology, West China Hospital of Stomatology, Sichuan University, Chengdu, China; 4Department of Implant, Stomatological Hospital of Chongqing Medical University, Chongqing, China
Background: Tumor stages detection and histologic grades classification are essential for the diagnosis and prognosis of oral squamous cell carcinoma (OSCC). In this research, we apply surface-enhanced Raman spectroscopy (SERS) of blood serum to detect the tumor stages and histologic classification of OSCC.
Methods: According to TNM classification and World Health Organization histologic grading system, the blood serum samples were collected from a total of 135 OSCC patients in the different tumor stages and histologic grades. Then the SERS spectra of serum samples from OSCC patients were diagnosed and classified into different groups using principal component analysis (PCA) and linear discriminant analysis (LDA) based on the tumor sizes, lymph node metastasis and histologic grades.
Results: The SERS spectra of blood serum samples have shown the distinct changes and differences compared with each other, which were assigned to the biomolecule alterations (nucleic acids, proteins, lipids, and so on) in blood serums. And all accuracies of detection and classification reached above 85%.
Conclusion: This study demonstrated that the SERS based on blood serum test had an enormous potential to carry out the preoperative assessment and prediction of the OSCC patients in different tumor stages and histologic classification.
Keywords: SERS, OSCC, TNM classification, histologic grades, diagnosis
Corrigendum for this paper has been published
Introduction
Oral squamous cell carcinoma (OSCC) is one of the most prevalent head and neck squamous cell carcinoma worldwide with an increasing annual incidence, especially in Western and Asian countries.1,2 In China, it was reported that its annual incidence is 3.29 per 100,000 and the mortality is 1.49 per 100,000.3 Moreover, the 5-year survival rate of OSCC remains ~50%, without a remarkable improvement in the recent years.2 The survival of OSCC patients is related to the several clinical and pathologic parameters such as tumor size, lymph nodal stage, pathologic status, and successful initial treatment.4 The preoperative evaluation of the tumor size, lymph nodal stage, and pathologic status correlates to the successful selection of initial treatment methods, and thus it is very important for increasing the survival rate. Although the tumor size and lymph nodal stage can be evaluated preoperatively by the conventional computed tomography, magnetic resonance, and even positron emission tomography, these imaging technologies could not provide the exact size evaluation because of the oral anatomic structure or an expensive cost to the patients. Meanwhile, the pathologic diagnosis is still considered the golden standard of OSCC, but it depends on the oral biopsy, which is time consuming, labor intensive, and invasive.2,5 Thus, a quick, convenient, and accurate method is pressingly needed for the preoperative evaluation of the tumor size, lymph nodal stage, and pathologic status of the OSCC patient to make the appropriate treatment to increase the survival rate.
The surface-enhanced Raman spectroscopy (SERS) has been successfully used to detect oncologic diseases in different sites based on the fingerprint information of biomolecule. SERS can enhance the Raman signals of absorbed molecules on Au or Ag nanoparticles as much as 105–1014 times.2,6–8 The SERS has other advantages such as more precise spectral widths, multiple labels detection under the single-wavelength laser, and no photobleaching issues for SERS labels.7 With these advantages, the SERS can even detect the trace of tumor metabolism and the changes of biochemical components in biofluids.2,6,9 Therefore, the spectral detection of the biofluids using the SERS is considered a noninvasive and convenient method for OSCC diagnosis.2 In our previous study, the SERS can be applied to detect and analyze the different biochemical metabolism in the serum samples to successfully discriminate the OSCC patients from the salivary mucoepidermoid carcinoma patients and normal volunteers.2 The SERS technique not only can diagnose the various tumors by the blood samples but also can detect the different stages of the same tumor. It was reported that a label-free blood plasma test based on SERS for tumor size stages detection in nasopharyngeal cancer has been developed successfully, which can distinguish the T1 stage nasopharyngeal cancer from the T2–T4 stages.7 These findings prove that the SERS technique has the great potential to identify and diagnose the different tumor sizes.
We propose to use blood serum detection by SERS to assess the different tumor size, lymph nodal stages, and pathologic status of OSCC because of its potential and feasibility. To the best of our knowledge, it is the first report on the serum detection using SERS in order to diagnose preoperatively the different tumor size, lymph nodal stages, and pathologic status of OSCC, which is helpful for the evaluation of patients’ conditions and decisions of optimal treatments.
Patients and methods
Subject and protocol
A total of 135 patients with primary OSCC who were not treated and did not have any other systemic diseases or drug abuse prior to this study were selected in this study. All patients received surgical treatments, and their diagnoses were carried out by two senior pathologists according to the International Union Against Cancer TNM classification and the World Health Organization (WHO) histologic grading system.10 The subjects were grouped by the evaluation of the tumor size, positive lymph nodes, metastases, and histologic grades. All patients who participated in this study were informed in detail and their written informed consents were obtained at the beginning of this study. No authors had access to information that could identify individual participants in this study. This study was approved by the Ethics Committees of the First Affiliated Hospital of Xiamen University (reference no. KY2013-01) and followed the guidelines of the Declaration of Helsinki. Detailed information on the subjects is shown in Table 1.
 | Table 1 Detailed information of the subjects in this study |
Preparation of gold nanoparticles
Gold nanoparticles were prepared as per the method reported in our previous study.2,6 A total of 100 mL of 0.1 g/L HAuCl4 was heated to the rolling boil and then 0.7 mL of 10 g/L trisodium citric acid was quickly added. The mixed solution was heated to keep boiling and stirred continuously for 30 minutes. In this process, the change of color of the mixed solution from pale yellow to burgundy indicated the successful production of the gold nanoparticles. To keep the consistency of the shape and volume of the gold nanoparticles, the experimental conditions of every batch were controlled very carefully. Additionally, the shape and volume of the prepared gold nanoparticles were detected by the scanning electron microscopy and the ultraviolet (UV)–visible spectroscopy analysis.
Preparation of blood sample
After 10 hours of overnight fasting, 5 mL of peripheral blood was obtained from each subject. Then the peripheral blood was deposited without any anticoagulant at 4°C for 4 hours. To remove the blood cells, fibrinogen, and platelet, the blood was centrifuged at 3,400 rpm. Then 1 mL supernatant of the centrifuged blood was collected as the blood serum sample and stored at −20°C for SERS detection.
SERS detection
Before the SERS detection, 4 mL of gold nanoparticles was centrifuged at 6,000 rpm for 10 minutes. Then the supernatant was discarded and a 0.4 mL blood serum sample was added to the gold nanoparticles. To obtain the homogeneous distribution of the nanoparticles in the serum sample, the mixture of serum and gold particles was vibrated by ultrasonic oscillator for 5 minutes. After 2 hours of incubation at 4°C, a drop of the mixture of serum and nanoparticles was transferred onto a coverslip for the SERS detection. The surface-enhanced Raman spectra of the serum were detected by using the confocal Raman micro-spectrometer system (Renishaw Ltd., Gloucestershire, UK) with the 633 nm excitation laser. The 400 mW excitation laser was focused on the serum sample through a 50× objective lens. The recorded Raman shift region was selected between 200 and 1,800 cm−1 and the spectral resolution was set as 2 cm−1. Every spectrum of serum sample was integrated for 10 seconds and averaged over two accumulations.
Groups of Raman spectra
The different Raman spectra were classified into different groups according to the TNM classification system and histologic grading. According to the tumor size, the Raman spectra were classified into four groups as T1, T2, T3, and T4. According to the lymph nodal involvement, the Raman spectra were classified into N0, N1, and N2. As the patients with the N3 grading achieved not only the surgical operation but also the chemotherapy, these patients were excluded from this study, and all subjects in this study had M0 grading. According to the WHO histologic grading, the Raman spectra were classified into three groups grade I, grade II, and grade III.
Data analysis
Before the multivariate analysis of the Raman data, the raw Raman spectra were preprocessed to remove the noisy interferences, oversaturated spectra, and autofluorescence backgrounds, and they were smoothed by using WiRE 2.0 software (Renishaw Ltd.) and LABSPEC 2.0 software (HORIBA Scientific, Paris, France). The baseline correction and normalization were carried out before the comparison and multivariate analysis of different Raman spectra. The mean spectra of different groups of Raman spectra and subtracted Raman spectra of different groups were obtained through the OriginPro 8.0 software (OriginLab, Northampton, MA, USA).
In the multivariate analysis process, principal component analysis (PCA) and linear discriminant analysis (LDA) were employed to reduce the dimensions of the numerous Raman data, generate principal components, and classify the different Raman spectra of serum. In this study, the generated principal components that account for above 90% of the whole variance in original spectra were selected as statistical variables in LDA. To estimate and evaluate the prediction performance of the diagnostic model established by PCA-LDA, the leave-one-out cross-validation was employed. In this study, the Raman spectra were classified and diagnosed by PCA-LDA according to the different TNM grading and histologic grading.
Result
In the SEM image shown in Figure 1A, the gold nanoparticles produced by the above method were almost spherical and the mean diameter was ~55 nm. As shown in Figure 1B, the UV–visible absorption band of the pure gold nanoparticles appeared at around 530 nm. The intensity of this absorption band was reduced when the serum was mixed with the gold nanoparticles. This decrease was believed to originate from the localized surface plasmon resonance of the combination of the gold nanoparticles and biochemical substances in the serum samples.2,6 Figure 1C–E showed the SERS spectrum of serum, regular Raman spectrum of serum, and the Raman spectrum of pure gold nanoparticles. The pure gold nanoparticles showed a very weak background, but intensities of the SERS spectrum were enhanced and increased enormously when the gold nanoparticles were added in the serum sample. A total of 135 SERS spectra were obtained from the clinically confirmed OSCC subjects. And these spectra were grouped, respectively, according to the TNM classification and histologic grades for the next analysis.
 | Figure 1 (A) The scanning electron microscopy images of the gold nanoparticles. (B) The UV–visible absorption of the gold nanoparticles and the gold nanoparticles with serum. (C) SERS spectrum of serum, regular Raman spectrum of serum, and Raman spectrum of the gold nanoparticles. (D) Enlarged figure of regular Raman spectrum of serum. (E) Enlarged figure of Raman spectrum of the gold nanoparticles. |
Raman spectra of different tumor size
According to the TNM classification, a total of 135 SERS spectra were classified into the T1, T2, T3, and T4 groups. There were 10 spectra in the T1 group, 46 spectra in the T2 group, 25 spectra in the T3 group, and 54 spectra in the T4 group. Compared with the different mean spectra, the main Raman peaks appeared at 294, 724, 748, 1,136, 1,263, 1,374, 1,448, 1,491, and 1,583 cm−1 from the 200 cm−1 to 1,800 cm−1 Raman shift region (Figure 2A). These peaks were assigned to biomolecular structures and biochemical components according to the reported literatures and previous studies (Table 2).2,6,11 As the result of the PCA-LDA process, eight of ten spectra in the T1 group, 33 of 46 spectra in the T2 group, 20 of 25 spectra in the T3 group, and 42 of 54 spectra in the T4 group were classified into the accurate groups, respectively. The accuracy of the T1 and T3 group classification that reached 80.0% was the highest, and the total accuracy of the diagnostic model established by PCA-LDA was 76.3%. The total accuracy of the leave-one-out cross-validation was 68.9%, which demonstrated the stable prediction performance of the diagnostic model (Table 3). The two-dimensional scatter plot diagram of discrimination scores demonstrated a clear classification of the four groups (Figure 2B).
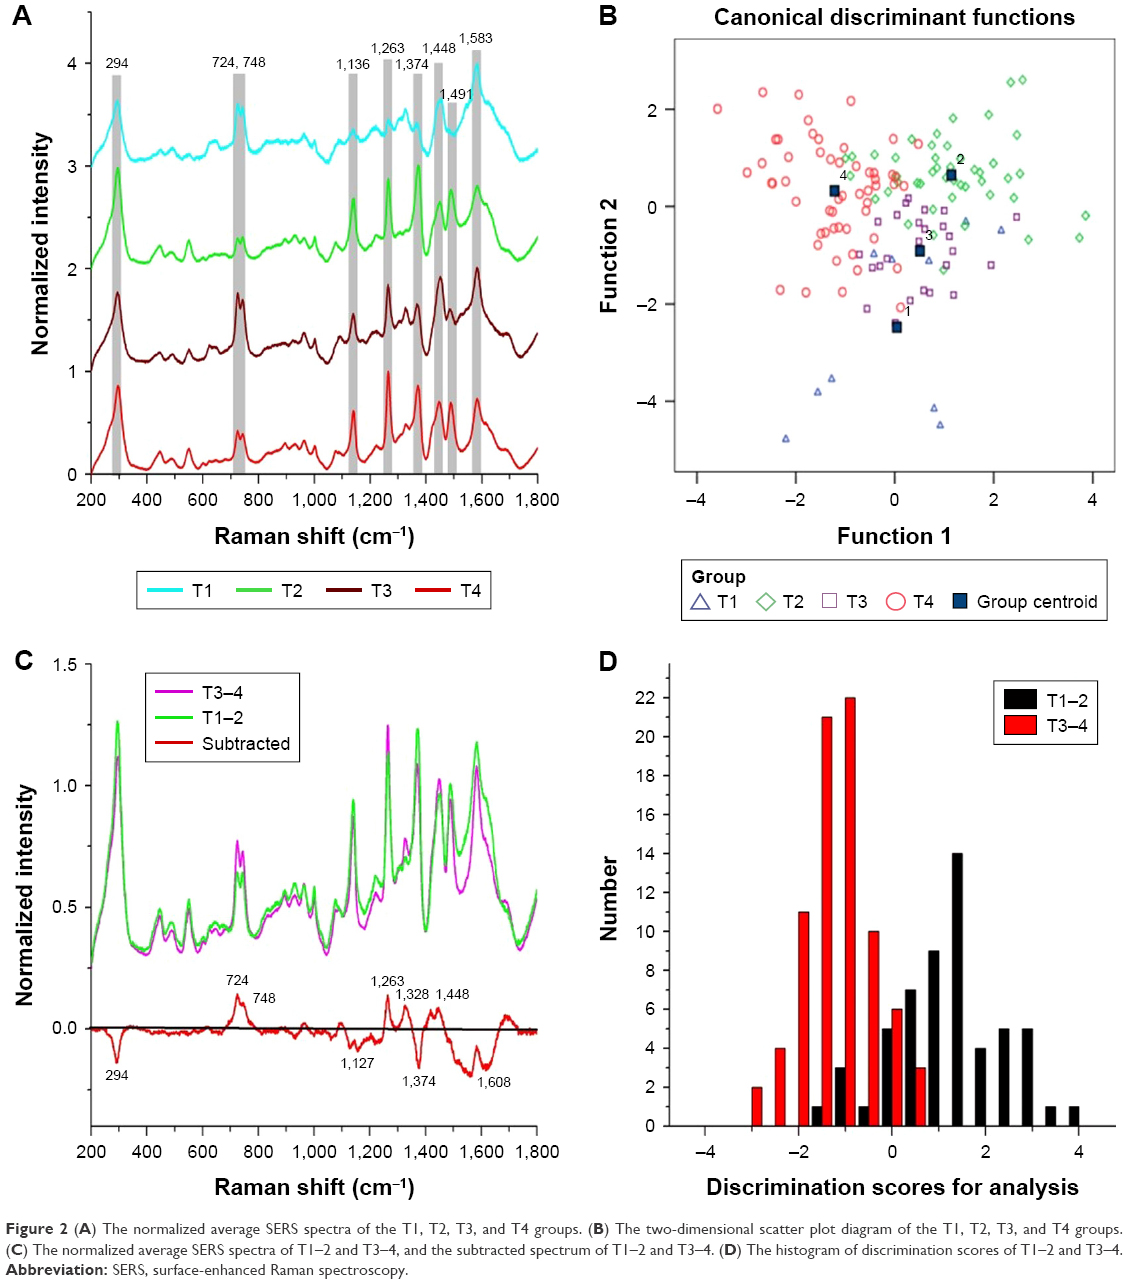 | Figure 2 (A) The normalized average SERS spectra of the T1, T2, T3, and T4 groups. (B) The two-dimensional scatter plot diagram of the T1, T2, T3, and T4 groups. (C) The normalized average SERS spectra of T1–2 and T3–4, and the subtracted spectrum of T1–2 and T3–4. (D) The histogram of discrimination scores of T1–2 and T3–4. |
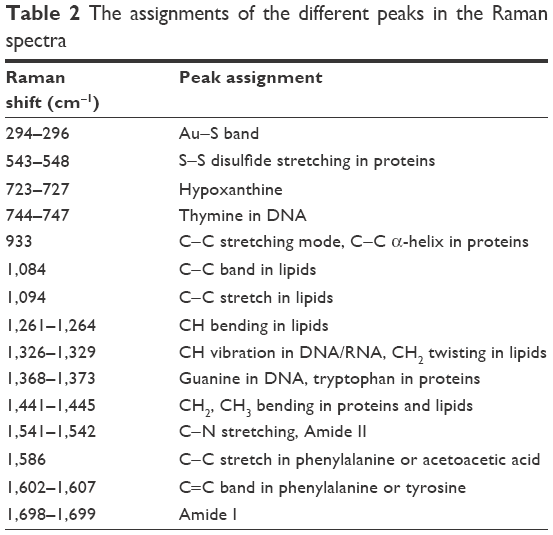 | Table 2 The assignments of the different peaks in the Raman spectra |
 | Table 3 The results of the classification of different T stage groups |
Due to the different clinical managements, a total of 56 spectra of the early T stage (T1 and T2) were selected as the T1–2 group, and the 79 spectra of the advanced T stage (T3 and T4) were selected as the T3–4 group. Compared with the mean SERS spectrum of the T1–2 group, the spectrum of T3–4 group showed an increase in the peaks at 724, 746, 1,263, 1,328, and 1,448 cm−1, but a decrease in the peaks at 294, 1,127, 1,374, and 1,608 cm−1 (Figure 2C). These differences of the peaks in the subtracted spectrum were assigned to the changes of the biochemical components such as DNA, proteins, and lipids (Table 2). The spectral data of the two groups were also processed by PCA-LDA. As a result, the 49 of 56 spectra in the T1–2 group and the 73 of 79 spectra in the T3–4 group were classified into the accurate groups successfully (Table 4). The total accuracy of the diagnostic model established by PCA-LDA was 90.4%. The total accuracy of the leave-one-out cross-validation was 85.9%, which demonstrated the excellent prediction performance of the diagnostic model. The histogram of discrimination scores of the two groups demonstrated a clear classification (Figure 2D).
 | Table 4 The results of the classification of T1–2 and T3–4 stage groups |
Raman spectra of different lymph nodal involvement
In this study, the patients in the N3 stage were excluded because they received the chemotherapy before the surgical treatment. According to the TNM classification, a total of 135 SERS spectra were classified into the N0, N1, and N2 groups. There were 53 spectra in the N0 group, 32 spectra in the N1 group, and 50 spectra in the N2 group. Compared with the different mean spectra, the intensities of peaks at 272, 748, 1,094, 1,328, 1,445, 1,586, and 1,691 cm−1 in the Raman spectra increased from the N0 group to the N2 group (Figure 3A). According to the reported literatures and previous studies (Table 2), these peaks were assigned to the structures and components of nucleic acids and proteins. However, there were also decreased peaks at 296 and 1,549 cm−1 in the spectra from N0 to N2, which were assigned to the Au−S band and amide II components.
 | Figure 3 (A) The normalized average SERS spectra of N0, N1, and N2 groups and the subtracted spectra of different N groups. (B) The two-dimensional scatter plot diagram of the N0, N1, and N2 groups. |
The classification and diagnosis of the different N stage groups were also carried out by the PCA-LDA method. The results showed that 40 of 50 spectra in the N0 group, 30 of 32 spectra in the N1 group, and 46 of 50 spectra in the N2 group were classified into the accurate groups, respectively. The accuracy of N1 group classification that reached 93.8% was the highest, and the total accuracy of the diagnostic model established by PCA-LDA was 85.9%. The total accuracy of the leave-one-out cross-validation was 79.3%, which demonstrated the stable prediction performance of the diagnostic model (Table 5). The two-dimensional scatter plot diagram of discrimination scores demonstrated a clear classification of the three different groups (Figure 3B).
 | Table 5 The results of the classification of different N stage groups |
Raman spectra of different histologic grades
According to the WHO histologic grading system, the histologic grades of OSCC were classified into SCC I, II, and III grades, in which the SCC III grade was the poorest differentiation and prognosis. In this study, there were 39 spectra in the SCC-I group, 49 spectra in the SCC-II group, and 47 spectra in the SCC-III group, respectively. Compared with the different mean spectra, the main Raman peaks appeared at 292, 547, 933, 1,264, and 1,368 cm−1 from the 200–1,800 cm−1 Raman shift region (Figure 4A). In the subtracted spectra between SCC-II and SCC-I, the intensities of the peaks at 292, 547, 933, 1264, and 1368 cm−1 decreased, but the intensities of these peaks increased in the subtracted spectra between SCC-III and SCC-II. These peaks were also assigned to the structures and components of nucleic acids and proteins according to the reported literatures and previous studies (Table 2).
 | Figure 4 (A) The normalized average SERS spectra of the SCC-I, SCC-II, and the SCC-III groups and the subtracted spectra of different SCC groups. (B) The two-dimensional scatter plot diagram of the SCC-I, SCC-II, and the SCC-III groups. |
To classify and discriminate the 135 spectra of different histologic grade groups, the PCA-LDA algorithm was also employed. As the result of the PCA-LDA process, 36 of 39 spectra in the SCC-I group, 44 of 49 spectra in the SCC-II group, and 42 of 47 spectra in the SCC-III group were classified into the corresponding groups. The accuracy of SCC-I group classification that reached above 92.0% was the highest, and the total accuracy of the diagnostic model established by PCA-LDA was 90.4%. The total accuracy of the leave-one-out cross-validation was 83.0%, which demonstrated the stable prediction performance of the diagnostic model (Table 6). The two-dimensional scatter plot diagram of discrimination scores demonstrated a clear classification of the three groups (Figure 4B).
 | Table 6 The results of the classification of different histologic grade groups |
Discussion
SERS was employed to detect and diagnose the different diseases by the blood or other body fluid samples.2,6,8,12 Compared with the healthy samples, the intensities of different peaks in the SERS spectra of diseased samples were altered, which were assigned to different vibration modes of various biomolecules.13 According to the differences between the diseased and the healthy SERS spectra, numerous algorithms were applied to diagnose the various diseases successfully. The OSCC patients were also successfully discriminated from the healthy volunteers by the SERS spectra of the blood serum samples,2 but to our knowledge, it was not reported that SERS was utilized to detect and classify the different stages of OSCC patients. The correct diagnosis of the different stages of OSCC patients played a significant role in the management and prognosis.14,15 Although there were numerous algorithms to analyze and classify the spectral data,6,16–18 the PCA-LDA was mostly employed in the classification of Raman spectra and had a perfect performance.2,7,19 In this study, it was the first time to classify and diagnose the different TNM stages and histologic grades of OSCC by using SERS and PCA-LDA based on the serum samples.
In the comparison of the spectra of different T stages, the intensities of peaks at 724 and 748 cm−1 increased in the SERS spectra of the advanced T stage (T3 and T4 groups) compared to the early T stage (T1 and T2 groups). This result indicated that there was an increase in the relative amount of nucleic acid bases in the advanced T stage of OSCC, which resulted from the abnormal metabolism of DNA or RNA bases such as cell apoptosis and necrosis in the blood of OSCC.6,7 Our data are consistent with Lin’s study on increased Raman signals assigned to nucleic acids in the SERS spectra of the blood plasma samples from the advanced T stage group of nasopharyngeal cancer.7 The intensities of peaks at 1,328 and 1,448 cm−1 in the SERS spectra of the advanced T stage group were unique with a similar increase in the blood plasma spectra of OSCC reported in Rekha’s study.11 All of the above indicated that the amount of nucleic acids and proteins in the serums of OSCC patients increased as the tumor size enlarged. This change of nucleic acids can be explained by the increased cell-free nucleic acids, which originated from the apoptosis, necrosis, and release of intact cells in the bloodstream and their subsequent lysis.6 The increase of proteins in serums could be related to the redistribution or translocation of blood free amino acids in cancer patients reported in the previous literature.6 As the result of the PCA-LDA classification, the total accuracy of ~80% shows that the SERS had a giant potential to detect and diagnose the different T stages of OSCC. The accuracy was higher in the classification of T1–2 and T3–4 stages.
The regional lymph node metastasis would occur in the early stages of OSCC, which also played an important role in the management and prognosis.20 However, there is not a preoperative technology as the golden standard to detect the regional lymph node metastasis in OSCC patients. Raman spectroscopy was used successfully for the intraoperative assessment of axillary lymph nodes, but there was no study to report the application of SERS to detect and assess the lymph node metastasis by the serum samples.21 In this study, the differences in intensities of peaks shown in the SERS spectra indicated the alterations of the biomolecular structures and compositions such as nucleic acids and proteins in the serums of different N stages.22–24 It was similar to the spectra of different T stage groups that the intensities of peaks at 724 and 748 cm−1 appeared to increase in the SERS spectra as the N stage increased. This result suggested that the amount of nucleic acids basis increased in the serums of regional lymph node metastasis compared to the serums of a negative regional lymph node. The classification of various N stage groups was based on these above-mentioned differences of peaks in the SERS spectra. The PCA-LDA also had a perfect performance in the classification of different N stages with the total accuracy of 85.9%, which indicated that SERS could be also used to assess the regional lymph node metastasis.
The histologic grading system of OSCC was based on the architectural and cytologic alterations, which was dependent on the pathologists’ observation and experiences.25,26 The histologic grade was also an important predictor of patients’ prognosis.27 In this study, the PCA-LDA was applied to classify and diagnose the different histologic grades spectra and achieved a total accuracy of ~90%. However, there were some inexplicable changes of peaks in the SERS spectra of different histologic grades of OSCC. The intensities of peaks at 292, 547, 933, 1,264, and 1,368 cm−1 increased in the spectra of SCC II grade compared to SCC I grade, but all these intensities decreased in the spectra of SCC III compared to SCC II grade. The intensities of peaks did not always increase as the histologic grade increased. This result indicated that the histologic observation and pathologic manifestation could not represent all the biochemical changes and molecular alterations. Li et al also found that Raman spectroscopy could detect the biochemical variations in oral normal, OSCC, and dysplastic tissues, which were not explained by the current WHO histologic classification system.17 Although this result would need a further study, it could suggest that the histologic grading system could need further improvements to focus on not only the pathologic manifestation but also the biochemical changes.17,28
Acknowledgments
We would like to acknowledge the support from Prof Bin Ren and Dr Xiaoshan Zheng (State Key Laboratory of Physical Chemistry of Solid Surfaces, Xiamen University, China). This study was supported by the National Natural Science Foundation of China (grant no. 81172578), the Project of Medical innovation of Fujian Province (grant no. 2015-CXB-35), the Natural Science Foundation of Fujian Province (grant no. 2017J357), and the Project of Science and Technology of Xiamen City (grant no. 3502Z20134007).
Disclosure
The authors report no conflicts of interest in this work.
References
Hung KF, Liu CJ, Chiu PC, et al. MicroRNA-31 upregulation predicts increased risk of progression of oral potentially malignant disorder. Oral Oncol. 2016;53:42–47. | ||
Tan Y, Yan B, Xue L, Li Y, Luo X, Ji P. Surface-enhanced Raman spectroscopy of blood serum based on gold nanoparticles for the diagnosis of the oral squamous cell carcinoma. Lipids Health Dis. 2017;16(1):73. | ||
Fu JY, Gao J, Zhang ZY, et al. Tea consumption and the risk of oral cancer incidence: a case-control study from China. Oral Oncol. 2013;49(9):918–922. | ||
Garzino-Demo P, dell’acqua A, Dalmasso P, et al. Clinicopathological parameters and outcome of 245 patients operated for oral squamous cell carcinoma. J Craniomaxillofac Surg. 2006;34(6):344–350. | ||
Kumar S, Kumar S, Tiwari S, et al. Highly sensitive protein functionalized nanostructured hafnium oxide based biosensing platform for non-invasive oral cancer detection. Sens Actuators B Chem. 2016;235:1–10. | ||
Yan B, Li B, Wen Z, Luo X, Xue L, Li L. Label-free blood serum detection by using surface-enhanced Raman spectroscopy and support vector machine for the preoperative diagnosis of parotid gland tumors. BMC Cancer. 2015;15:650. | ||
Lin D, Pan J, Huang H, et al. Label-free blood plasma test based on surface-enhanced Raman scattering for tumor stages detection in nasopharyngeal cancer. Sci Rep. 2014;4:4751. | ||
Wang J, Lin D, Lin J, et al. Label-free detection of serum proteins using surface-enhanced Raman spectroscopy for colorectal cancer screening. J Biomed Opt. 2014;19(8):087003. | ||
Sahu A, Nandakumar N, Sawant S, Krishna CM. Recurrence prediction in oral cancers: a serum Raman spectroscopy study. Analyst. 2015;140(7):2294–2301. | ||
Gale N, Plich BZ, Sidransky D, Westra W, Califano J. World Health Organization classification of tumors. In: Barnes L, Eveson JW, Reichart P, Sidransky D, editors. Pathology and Genetics in Head and Neck Tumors. Lyon: IARC Press; 2005:246. | ||
Rekha P, Aruna P, Bharanidharan G, Koteeswaran D, Baludavid M, Ganesan S. Near infrared Raman spectroscopic characterization of blood plasma of normal, oral premalignant and malignant conditions-a pilot study. J Raman Spectrosc. 2015;46(9):735–743. | ||
Wei Y, Zhu Y-Y, Wang M-L. Surface-enhanced Raman spectroscopy of gastric cancer serum with gold nanoparticles/silicon nanowire arrays. Optik. 2016;127(19):7902–7907. | ||
Feng S, Chen R, Lin J, et al. Nasopharyngeal cancer detection based on blood plasma surface-enhanced Raman spectroscopy and multivariate analysis. Biosens Bioelectron. 2010;25(11):2414–2419. | ||
Wagner VP, Webber LP, Curra M, et al. Bryne’s grading system predicts poor disease-specific survival of oral squamous cell carcinoma: a comparative study among different histologic grading systems. Oral Surg Oral Med Oral Pathol Oral Radiol. 2017;123(6):688–696. | ||
Jain D, Tikku G, Bhadana P, Dravid C, Grover RK. A semi-quantitative World Health Organization grading scheme evaluating worst tumor differentiation predicts disease-free survival in oral squamous carcinoma patients. Ann Diagn Pathol. 2017;29:1–6. | ||
Yang Y, Xie F, Yan B, et al. A reliable multiclass classification model for identifying the subtypes of parotid neoplasms constructed with variable combination population analysis and partial least squares regression based on Raman spectra. Chemometr Intell Lab Syst. 2017;170:102–108. | ||
Li B, Gu ZY, Yan KX, et al. Evaluating oral epithelial dysplasia classification system by near-infrared Raman spectroscopy. Oncotarget. 2017;8(44):76257–76265. | ||
Sikirzhytskaya A, Sikirzhytski V, Mclaughlin G, Lednev IK. Forensic identification of blood in the presence of contaminations using Raman microspectroscopy coupled with advanced statistics: effect of sand, dust, and soil. J Forensic Sci. 2013;58(5):1141–1148. | ||
Feng S, Chen R, Lin J, et al. Gastric cancer detection based on blood plasma surface-enhanced Raman spectroscopy excited by polarized laser light. Biosens Bioelectron. 2011;26(7):3167–3174. | ||
Kane SV, Gupta M, Kakade AC, Cruz AD. Depth of invasive is the most significant histological predictor of subclinical cervical lymph node metastasis in early squamous carcinomas of the oral cavity. J Cancer Surg. 2006;32:795–803. | ||
Horsnell JD, Smith JA, Sattlecker M, et al. Raman spectroscopy – a potential new method for the intra-operative assessment of axillary lymph nodes. Surgeon. 2012;10(3):123–127. | ||
Yan B, Li Y, Yang G, Wen ZN, Li ML, Li LJ. Discrimination of parotid neoplasms from the normal parotid gland by use of Raman spectroscopy and support vector machine. Oral Oncol. 2011;47(5):430–435. | ||
Xue L, Sun P, Ou D, Chen P, Chen M, Yan B. Diagnosis of pathological minor salivary glands in primary Sjogren’s syndrome by using Raman spectroscopy. Lasers Med Sci. 2014;29(2):723–728. | ||
Long S-Y, Chen Z-P, Chen Y, Yu R-Q, Rq Y. Quantitative detection of captopril in tablet and blood plasma samples by the combination of surface-enhanced Raman spectroscopy with multiplicative effects model. J Raman Spectrosc. 2015;46(7):605–609. | ||
The Working Committee for New Histopathological Criteria for Borderline Malignancies of the Oral Mucosa, the Japanese Society of Oral Pathology. Carcinoma in-situ of the oral mucosa: its pathological diagnostic concept based on the recognition of histological varieties proposed in the JSOP Oral CIS Catalog. J Oral Maxillofac Surg Med Pathol. 2014;26:397–406. | ||
Kadoo P, Dandekar R, Kulkarni M, Mahajan A, Kumawat R, Parate N. Correlation of mitosis obtained by using 1% crystal violet stain with Ki67LI in histological grades of oral squamous cell carcinoma. J Oral Biol Craniofac Res. 2017. In press 2017. | ||
Costa AL, Araújo Júnior RF, Ramos CC. Correlation between TNM classification and malignancy histological feature of oral squamous cell carcinoma. Braz J Otorhinolaryngol. 2005;71(2):181–187. | ||
Kujan O, Oliver RJ, Khattab A, Roberts SA, Thakker N, Sloan P. Evaluation of a new binary system of grading oral epithelial dysplasia for prediction of malignant transformation. Oral Oncol. 2006;42(10):987–993. |
 © 2018 The Author(s). This work is published and licensed by Dove Medical Press Limited. The
full terms of this license are available at https://www.dovepress.com/terms
and incorporate the Creative Commons Attribution
- Non Commercial (unported, 3.0) License.
By accessing the work you hereby accept the Terms. Non-commercial uses of the work are permitted
without any further permission from Dove Medical Press Limited, provided the work is properly
attributed. For permission for commercial use of this work, please see paragraphs 4.2 and 5 of our Terms.
© 2018 The Author(s). This work is published and licensed by Dove Medical Press Limited. The
full terms of this license are available at https://www.dovepress.com/terms
and incorporate the Creative Commons Attribution
- Non Commercial (unported, 3.0) License.
By accessing the work you hereby accept the Terms. Non-commercial uses of the work are permitted
without any further permission from Dove Medical Press Limited, provided the work is properly
attributed. For permission for commercial use of this work, please see paragraphs 4.2 and 5 of our Terms.