Back to Journals » Clinical Interventions in Aging » Volume 14
Specific higher levels of serum uric acid might have a protective effect on bone mineral density within a Chinese population over 60 years old: a cross-sectional study from northeast China
Authors Chen F, Wang Y, Guo Y, Wang J, Yang A, Lv Q, Liu Y, Ma G ![]() , Liu Y, Wang D
, Liu Y, Wang D
Received 5 September 2018
Accepted for publication 17 February 2019
Published 12 June 2019 Volume 2019:14 Pages 1065—1073
DOI https://doi.org/10.2147/CIA.S186500
Checked for plagiarism Yes
Review by Single anonymous peer review
Peer reviewer comments 3
Editor who approved publication: Dr Zhi-Ying Wu
Feng Chen,1 Yingfang Wang,1 Yan Guo,1 Jiabei Wang,1 Aolin Yang,2 Qingqing Lv,2 Yixuan Liu,1 Guojing Ma,1 Ying Liu,3 Difei Wang1
1Department of Geriatrics, The First Affiliated Hospital of China Medical University, Shenyang, Liaoning 110001, People’s Republic of China; 2Department of Nutrition, the First Affiliated Hospital of China Medical University, Shenyang, Liaoning 110001, People’s Republic of China; 3Department of Biochemistry and Molecular Biology, China Medical University, Shenyang, Liaoning 110122, People’s Republic of China
Background and objective: Oxidative stress has been demonstrated to be a mechanism that leads to bone mass reduction, and according to many studies, serum uric acid (UA) is a strong endogenous antioxidant that can protect bone mineral density (BMD). To date, there have been no large-scale, cross-sectional studies based on the population in northeast China to assess the relationship between serum UA and BMD. Therefore, we examined the association between serum UA and BMD among a Chinese population older than 60 years old in northeast China.
Methods: This research was a cross-sectional study of 3465 Chinese individuals over 60 years old in nine communities from the city of Shenyang, which is the capital of northeast China’s Liaoning Province. Participants were stratified into three groups by serum UA or BMD levels, and then Pearson’s correlation analysis and multiple regression analysis were used to study the relationship between serum UA and BMD.
Results: We found that participants with higher serum UA levels had significantly greater BMD and T-values compared to those of participants with lower serum UA levels. After adjusting for confounding factors, Pearson’s correlation analysis and multiple regression analysis showed that higher serum UA levels remained associated with higher BMD levels (P<0.05). In different models, the prevalence of osteoporosis (OP) among participants with higher serum UA levels was reduced by 23% to 26% (P<0.05) compared to that in individuals with lower serum UA levels. In addition, serum UA levels were negatively correlated with estimated glomerular filtration rate (eGFR) and positively correlated with 25-hydroxy vitamin D3 [25-(OH)D3] (P<0.05).
Conclusion: We concluded that higher serum UA levels are associated with greater BMD, and serum UA might have a protective effect on bone metabolism due to its antioxidant properties.
Keywords: serum uric acid, bone mineral density, osteoporosis
Introduction
Osteoporosis (OP) is a chronic metabolic bone disease caused by a variety of factors and characterized by a reduction in bone mass, destruction of the bone microstructure, and an increase in bone fragility, leading to increased fracture risk.1 Age is one of the most important factors affecting BMD. With population ageing, the prevalence of OP has increased exponentially, according to statistics,the prevalence of OP in people older than 50 years old in the United States was 10.3% in 2010, and the prevalence of OP in 2020 and 2030 is predicted to reach 19% and 32%, respectively.39 Further, the number of individuals at high risk for osteoporosis fractures worldwide will grow from 158 million in 2010 to 316 million in 2040.40 In addition, the increased disease prevalence has also increased social and economic burden.2
In recent studies, oxidative stress has been reported to be a fundamental pathological process leading to bone loss and bone degradation.3,4 For example, reactive oxygen species (ROS) can inhibit the formation and differentiation of osteoblasts and enhance the development and activity of this pathological process. Lower levels of serum antioxidants were related to a higher risk of OP and osteoporotic fractures in humans.5–8 Serum UA, which is the final product of purine metabolism in humans, has the dual effects of antioxidation and pro-oxidation. Many studies have shown that, although UA excess can cause gout, kidney stones and inflammatory reactions, it can play a protective role in humans owing to its antioxidant effect in oxidative stress.9,10 Therefore, a hypothesis was proposed that serum UA might facilitate fracture healing and protect the body from OP owing to its antioxidant effects.11 In addition to its antioxidant properties, UA may affect BMD by other factors. Studies have found that a significant positive correlation between serum 25(OH)D and serum UA levels,12 and men with lower UA levels had an impaired 25-hydroxylation of vitamin D.41 Subsequently, a series of observational studies or epidemiological studies were conducted on the possible effects of UA on BMD. In 2011, Nabipour et al were the first to report a positive correlation between serum UA and BMD in a large-scale population study of older men.12 In addition, studies from other countries have also confirmed that high levels of serum UA can protect BMD.13–24 However, Zhang et al found that serum UA was independent of BMD after adjusting for confounding variables and applying multivariate analysis in a large-sample study based on the American adult population.25 Therefore, the relationship between serum UA and BMD is still not identical, and more in-depth research is needed to determine whether serum UA has an effect on bone metabolism.
OP is currently a serious public health problem in China, where population ageing is becoming more serious. Epidemiological studies based on the Chinese population have confirmed that higher levels of serum UA play a protective role in BMD.18–21 However, except for studies by Dong et al,20 the majority of the above studies were limited to southern China, the sample sizes were small, and most of the subjects were male or hospital patients. To date, there have been no large-scale, cross-sectional studies based on the population in northeast China to assess the relationship between serum UA and BMD. Therefore, we conducted this cross-sectional study among the Chinese population older than 60 years old in the city of Shenyang to investigate the association between serum UA and BMD.
Materials and methods
Study population
From September 2016 to August 2017, we conducted this cross-sectional study in nine communities in the city of Shenyang, which is the capital of northeast China’s Liaoning Province. In this study, we cooperated with nine community health service centres. Community staff members made telephone appointments with residents older than 60 years old, they informed the residents of the contents of this study in detail, and signed written informed consent forms were provided by the residents.To participate in the study, participants had to be 60 years old or older. During the period, a total of 5694 individuals participated in the study. The exclusion criteria were as follows: secondary osteoporosis; rheumatoid arthritis; gout; malignant tumours; hepatic failure; renal failure; thyroid disease; use of active vitamin D or treatment with non-active vitamin D of >800 U/d within the previous six months or use of these drugs for more than six months; taking drugs that affect bone metabolism within previous six months, such as bisphosphonates or glucocorticoids; and taking drugs that affect UA metabolism, such as allopurinol, febuxostat or benzbromarone. In addition, individuals without complete information or those who dropped out halfway were excluded. Finally, a total of 3465 eligible participants were included in the study. This study was conducted in accordance with the Declaration of Helsinki and was approved by the Ethics Committee of the First Affiliated Hospital of China Medical University (Shenyang, China, ethical approval project identification code: AF-SOP-07-1.0-01). The original data have been registered at the China Clinical Trial Center (Registration No. ChiCTR-ERC-17011100).Written informed consent was obtained from each participant.
General data collection
Standardized questions were asked in our investigation during face-to-face interviews to collect general information about the participants, such as age, gender, ethnicity, education, history of smoking, history of drinking, illnesses, and medications, such as drugs affecting bone metabolism, including hormone therapy, bisphosphonates, calcitonin, vitamin D and calcium or other multivitamin supplements. In addition, a physical examination was performed on each participant to measure height, weight, waist circumference (WC), etc. Participants were asked to wear light clothing and no shoes, and then height and weight were measured. Height was measured to the nearest 0.01 cm, and weight was recorded to the nearest 0.01 kg. The WC was measured to the nearest 0.1 cm, using a non-elastic tape at the umbilicus. Body mass index (BMI) was calculated as body weight divided by height in metres squared(kg/m2).
Biochemical measurements
The participants were asked to fast for 12 h before morning blood collection. Blind duplicate blood samples were collected to analyse the following parameters: serum UA, total cholesterol (TC), triglyceride (TG), high density lipoprotein cholesterol (HDL-C), low density lipoprotein cholesterol (LDL-C), and serum calcium (Ca). In addition, serum 25-hydroxyvitamin D3 [25(OH)D3] was measured by liquid chromatography-tandem mass spectrometry (LC-MS/MS). Estimated glomerular filtration rate [eGFR; (ml/min/1.73 m2)] was calculated using the Chronic Kidney Disease Epidemiology Association (CKD-EPI) formula.
BMD measurements
The heel BMD was measured using an ultrasonic bone densitometer (Hologic Sahara ultrasound bone density densitometer, software:version 3.1, American Hologic Corporation). The ultrasonic bone densitometer uses sonic conduction velocity (SOS) and amplitude attenuation (BUA) to reflect the bone mineral content, bone structure and bone strength, which have good correlations with dual energy X-ray absorption measurement (DEXA). In this study, according to the 1994 WHO recommended criteria, normal BMD was diagnosed by T-scores ≥-1 standard deviation (SD), osteopenia was diagnosed at −2.5< T-scores <-1.0 SD, and osteoporosis was diagnosed at T-scores ≤-2.5 SD.
Statistical analysis
Statistical analysis was performed using SPSS software, version 19.0. The participants were divided into three groups according to their T-scores (normal BMD, osteopenia, and osteoporosis) or divided into three groups according to tertiles of serum UA. Continuous variables were reported as the mean ± SD, and one-way analysis of variance (ANOVA) was used for comparison between groups. Normal distribution data were analysed using analysis of variance (ANOVA), and non-normal distribution data were analysed using the rank sum test. Categorical variables were reported as percentages (%), and the chi-square test was used for comparisons between groups. Pearson’s correlation analysis was used to study the relationship between serum UA and BMD; partial correlation analysis was used to reassess the relationship between serum UA and BMD after adjusting for potential confounding factors, such as age, gender, BMI, history of drinking, history of smoking, illnesses, TC, TG, HDL, LDL, eGFR, serum Ca, and 25(OH)D3. Multivariate regression analysis was then performed to investigate the association between UA and BMD after adjusting for potential confounders in different models. The accepted level of statistical significance was P<0.05.
Results
The baseline characteristics and laboratory parameters of the study population stratified by T-scores are shown in Table 1. A total of 3465 participants were included, of whom 2226 were female and 1239 were male. The participants were stratified into three groups based on their T-scores as follows: the control group (T-scores ≥-1 SD), the osteopenia group (−2.5< T-scores <-1.0 SD) and the osteoporosis group (OP group, T-scores ≤-2.5 SD). There were 1540 participants suffering from osteopenia and 1296 participants suffering from osteoporosis, accounting for 44.4% and 37.4% of our study population, respectively.
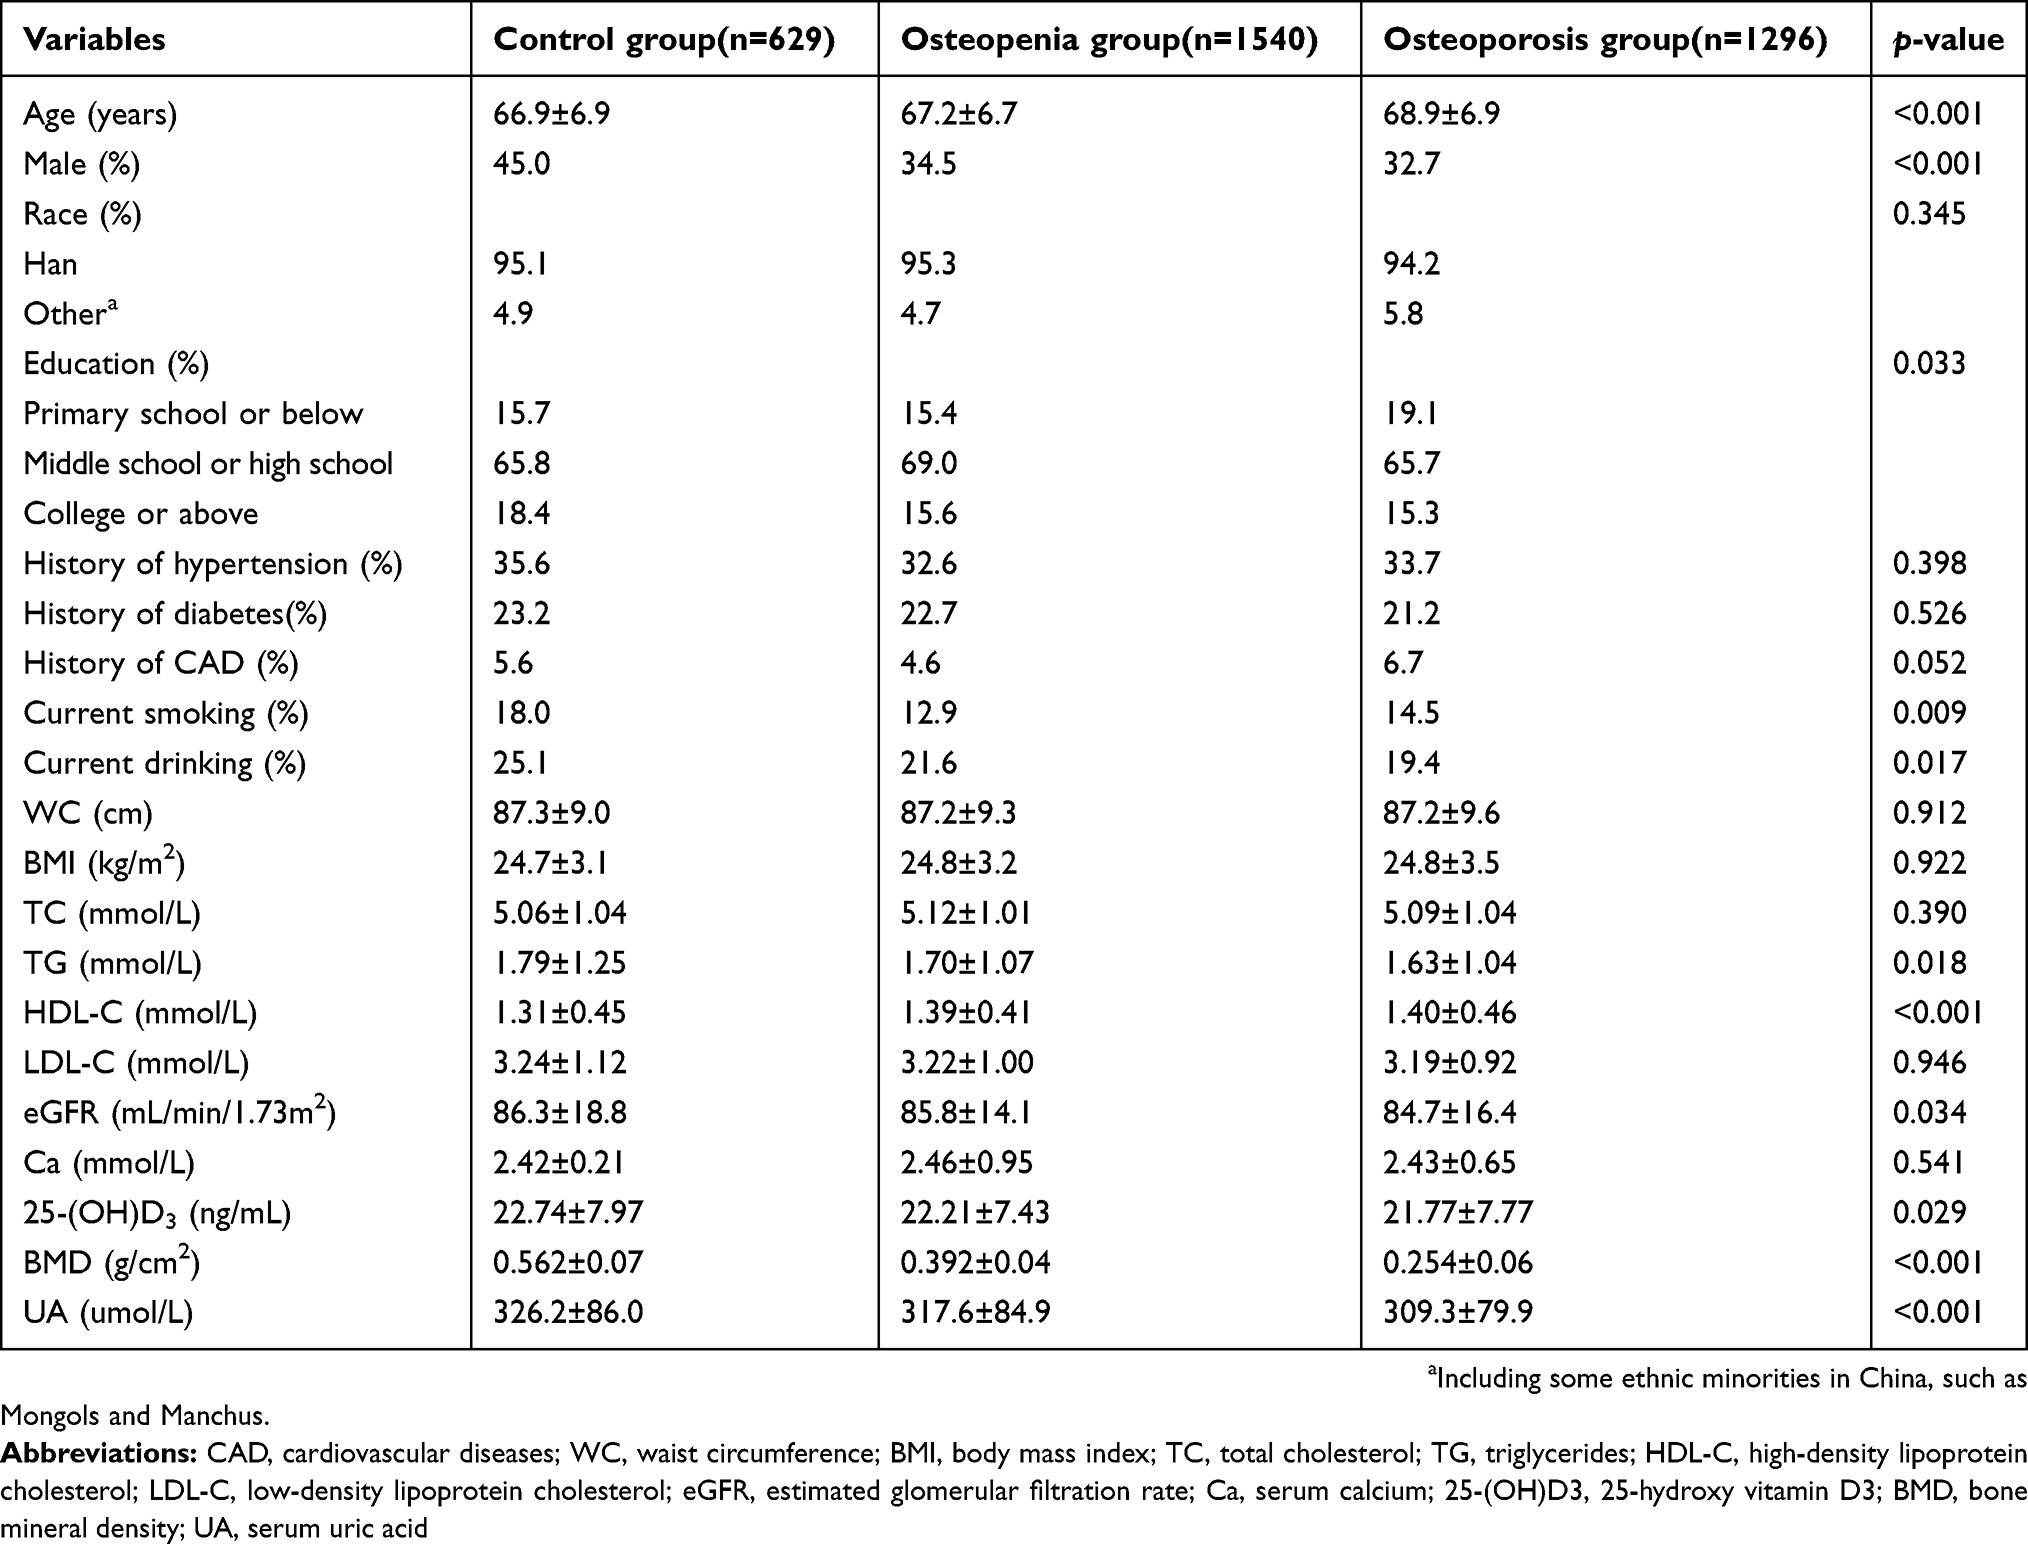 | Table 1 Baseline characteristics and laboratory parameters of the study population stratified by T-score |
Compared to the control group, the individuals in the other two groups were older (P<0.001), and the proportion of male OP was significantly lower than that of female OP(32.7% versus 67.3%, P<0.001, data not shown). The individuals with OP had lower levels of TG (P<0.05), 25-(OH)D3 (P<0.05), eGFR(P<0.05) and UA (P<0.001) than the individuals in the other two groups, whereas the levels of HDL-C showed the opposite trend (P<0.001). Individuals with OP tended to be female, smoke, drink and have a lower education level (all P<0.05). However, there were no significant differences in ethnicity, WC, BMI, TC, LDL-C, serum Ca, or history of hypertension, diabetes, and cardiovascular disease (all P>0.05) among the three groups. In addition, the individuals in the OP group had significantly lower levels of serum UA than those in the other two groups (P<0.001).
To better understand the clinical implications of the study, we reclassified the individuals into three groups according to the serum UA concentrations (low UA group: 29–277 µmol/L, middle UA group: 278–344 µmol/L and high UA group: 345–989 µmol/L, Table 2), with 1166, 1152 and 1147 participants, respectively. Individuals with higher levels of serum UA tended to be older, male, to smoke, drink, have hypertension, obesity, dyslipidaemia and have a lower education level (all P<0.05). In addition, the individuals in the high UA group had significantly lower eGFR than those with lower UA concentrations (P<0.001), with significantly higher 25-(OH)D3 and T-values (P<0.001). However, there were no significant differences in ethnicity, history of diabetes or cardiovascular disease (all P>0.05) among the three groups.
 | Table 2 Baseline characteristics and laboratory parameters of the study population stratified by levels of UA |
The individuals with higher serum UA levels had significantly higher BMD (P<0.001, Figure 1A), and male BMD was higher than female BMD in the three groups (P<0.05, Figure 1B). Similarly, after the individuals were divided into three age groups, we found that older participants tended to have lower BMD (P<0.001, Figure 1C). Among individuals in the 70–79-year-old and >80-year-old groups, male BMD was higher than female BMD (P<0.001, Figure 1D). In the 60–69-year-old group, male BMD levels were slightly higher than female levels, but the difference was not statistically significant (P>0.05, Figure 1d).
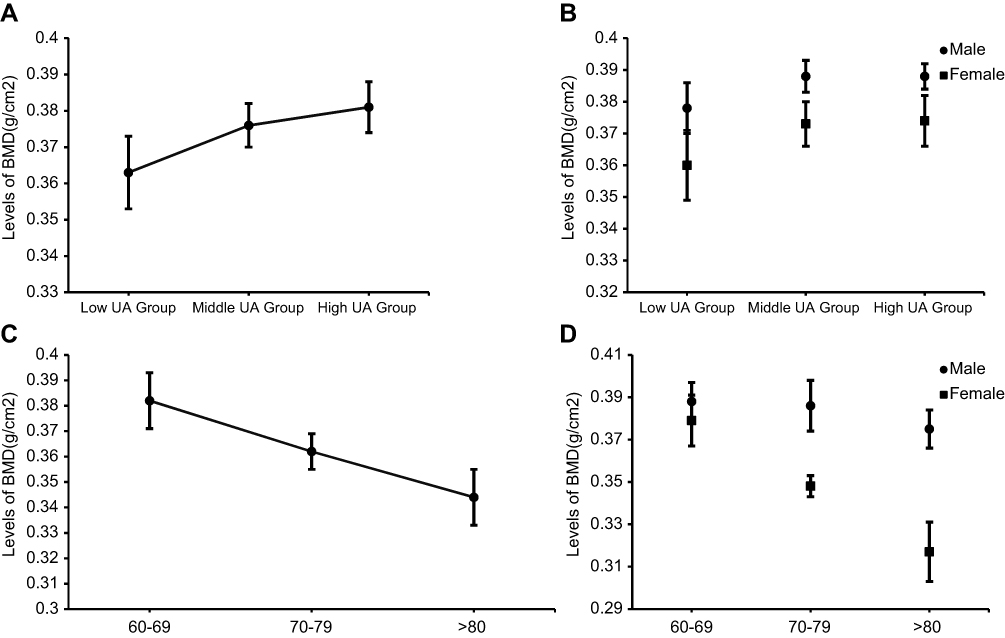 | Figure 1 (A) Levels of BMD in different groups stratified by levels of UA. (B) Levels of BMD in males and females stratified by levels of UA. (C) Levels of BMD in different age groups. (D) Levels of BMD in males and females stratified by classification of age. |
Pearson’s correlation analysis showed a positive correlation between the serum UA levels and BMD (r=0.131, P<0.001) (Table 3). Confounding factors, such as age (r=0.042, P=0.014), gender (r=−0.318, P<0.001), hypertension (r=0.101, P<0.001), smoking (r=0.102, P<0.001), drinking (r=0.173, P<0.001),WC (r=0.252, P<0.001), BMI (r=0.182, P<0.001), TC (r=−0.048, P=0.005), TG (r=0.143, P<0.001), eGFR (r=−0.191, P<0.001), and VitD3 (r=0.112, P<0.001) were all associated with serum UA levels. After adjusting for confounding factors in model 2 (r=0.126, P<0.001) and model 3 (r=0.111, P<0.001), partial correlation analysis was used to examine the association between the serum UA levels and BMD, and we found that the correlation between serum UA levels and BMD remained significant (Table 3). Multiple linear regression analysis showed that the serum UA levels remained correlated with BMD after adjusting for confounding factors in models 1 and 2 (R2=0.019 in model 1 and 0.021 in model 2,P<0.05, Table 4).
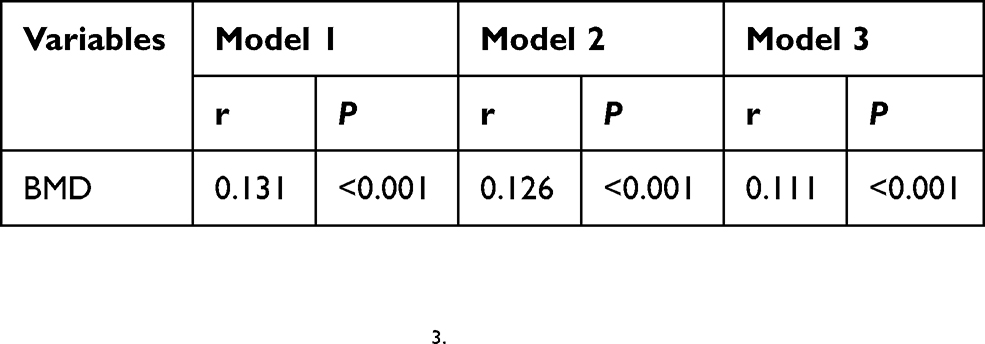 | Table 3 Correlation analysis of the relationship between leves of serum uric acid and BMD in different models |
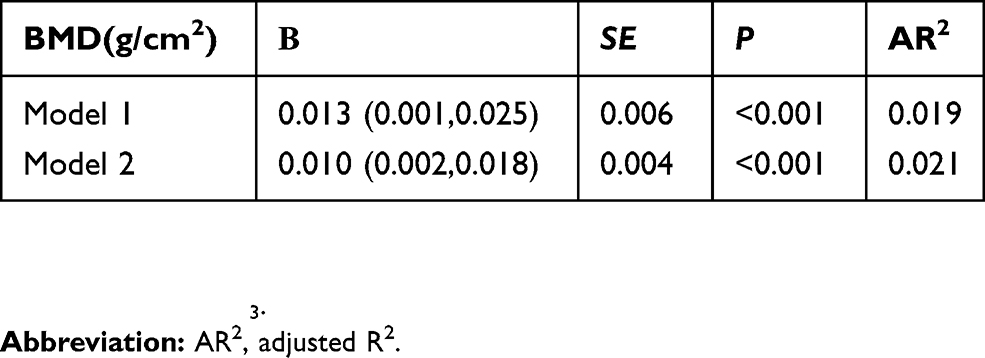 | Table 4 Multiple linear regression analysis of the relationship between the serum UA levels and BMD in different models |
The proportion of participants with OP was 37.4% (1296/3465) in this study. The proportions of participants with OP from the lowest UA group (low UA group) to the highest UA group (high UA group) were 41.8% (487/1166), 35.7% (411/1152) and 34.7% (398/1147), respectively. After adjusting for potential confounding factors, multiple logistic regression analysis showed that the the exponent of B-coefficients [Exp(B)] for OP decreased gradually from the low UA group to the high UA group (P<0.05; Table 5). In model 3, after adjusting for age, gender, WC, hypertension, smoking, drinking, BMI, TC, TG, eGFR and 25-(OH)D3, the possibility for OP was 21% lower in the middle UA group and 23% lower in high UA group than in the high UA group.
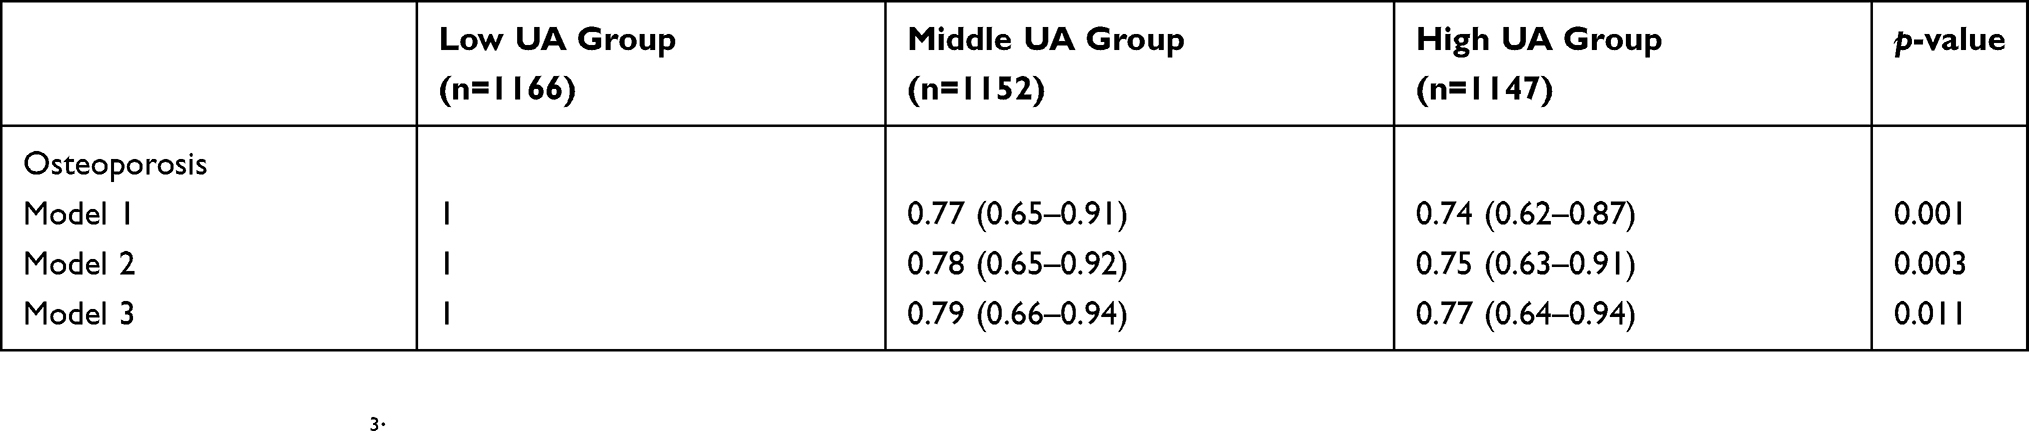 | Table 5 The risk of osteoporosis in relation to different levels of serum UA |
Discussion
In this cross-sectional study of 3465 Chinese subjects older than 60 years old, after adjusting for confounding factors, partial correlation analysis and multiple regression analysis, were used to examine the association between serum UA levels and BMD. We found that higher serum UA levels were associated with greater BMD, and higher serum UA could have a protective effect on BMD. These results indicated that specific higher levels of serum UA have a protective effect on bone metabolism.
With the ageing of the population, OP, hyperuricaemia and other chronic diseases affecting the health and quality of life of the elderly have increased. Knowledge of the diagnosis and treatment of these diseases has increased, and the need to identify associations with these diseases has driven additional research. As a large developing country, China has marked regional differences and different populations. The differences in regional environment,climate and lifestyle can lead to differences in BMD. Compared to southern China, the city of Shenyang is located in northeast China, where the winter is long and cold, from November to April of the following year; consequently, residents of this area have fewer daily activities and insufficient sunlight exposure, which can result in insufficient vitamin D synthesis, leading to a higher prevalence of OP than in other regions. In addition, the residents prefer high protein and high fat foods, and they consume more meat, pickles and alcohol than residents elsewhere. As a result, the prevalence of hyperuricaemia in northeast China was relatively higher than in other areas. However, related studies have found that the prevalence of hyperuricaemia in northeast China was relatively higher than in other parts of China,26,27 but the prevalence of osteoporosis was not significantly higher than in the south.28,29 Similarly, a meta-analysis of 33 studies conducted in 2010–2016 showed that the overall prevalence of OP in the Chinese population older than 60 years old was 36%.29 In this study, we found that the prevalence of OP was 37.4%, when compared to other regions, which has not significantly increased. Since hyperuricaemia means elevated UA, we speculated that the cause of this phenomenon was that higher levels of serum UA could have a protective effect on BMD. This result was consistent with our previous speculation.
To date, the protective mechanism of serum UA on BMD has not been completely understood; therefore, this mechanism was hypothesized in this study as follow. First, oxidative stress is a mechanism that can potentially inhibit osteoblastogenesis and bone formation.3,4,30 For example, ROS have been shown to suppress osteoblast proliferation and differentiation by regulating the redox signalling pathways, as well as promoting osteoclast differentiation and enhancing osteoblast development and activity.5–8,31,32 Serum UA is an important endogenous antioxidant that may directly participate in the pathogenesis of OP based on its antioxidant properties, thereby reducing bone loss and increasing BMD. This is consistent with the results that subjects with higher serum UA levels have greater BMD in our study. Second, Nabipour et al12 found that higher serum UA is associated with higher levels of serum 25 (OH) D3 and speculated that serum UA may increase Ca absorption and increase BMD by increasing the active vitamin D levels. In this study, serum UA level correlated positively with serum 25 (OH) D3, confirming that serum UA might have a protective effect on BMD by increasing the active vitamin D levels.
In this study, participants with higher serum UA levels tended to be male and older, whereas subjects with higher BMD tended to be male and younger. It is well known that age and gender are both factors influencing BMD and UA. A large number of epidemiological studies have confirmed that hyperuricaemia is significantly different between the sexes.33,37,38The serum UA levels in men were significantly higher than in women within the same age range, indicating that UA was affected by sex hormones. This mechanism is due to androgen inhibition of UA excretion and promotion of reabsorption, leading to a rise in UA levels.33 Many studies have reported that sex hormones are factors influencing bone metabolism. BMD in men in the same age group decreased slowly compared with menopausal women. It has been speculated that oestrogen can enhance osteoblast differentiation, which is involved in the maintenance of bone mass. In addition, oestrogen promotes apoptosis of osteoclasts, and their precursor cells were significantly weakened once oestrogen was absent.34 Age was an independent risk factor for OP, and related studies have shown that serum UA levels increased with increased age. The mechanism could include renal arteriosclerosis, renal blood perfusion, glomerular filtration rate (GFR) and decreased renal tubular excretion function leading to an increase in serum UA levels. In our study, there was still a positive correlation between serum UA levels and BMD after adjusting for age and gender.
Although higher levels of serum UA have a protective effect on BMD, studies in patients with gout and kidney disease have found that excessive UA can act to reduce serum 1,25(OH)2D3 by inhibiting 1α-hydroxylase activity, resulting in significant decreases in intestinal calcium absorption, and a negative calcium balance, causing adverse effects on bone health.35,36 Moreover, urate can inhibit the formation of osteoblasts and strengthen the role of osteoclasts when it is deposited in the joints, resulting in reduced bone formation and increased bone resorption.22 In conclusion, serum UA could have a dual impact on the body. Physiological concentrations of serum UA have a protective effect in stabilizing bone mass, while excessive serum UA has the opposite effect. Therefore, monitoring of BMD and serum UA levels dynamically, as well as keeping serum UA levels at their normal high values, is not only beneficial to reducing the prevalence of chronic diseases in the older population but also contributes to stabilizing the patient’s bone mass and reducing the incidence of bone loss and OP, thereby preventing the occurrence of subsequent fragility fractures.
Conclusion
In conclusion, our study showed that there is a positive correlation between serum UA and BMD after adjusting for confounding factors in the elderly population older than 60 years old in the city of Shenyang, which is located in northeast China. These results indicated that specific higher levels of serum UA have a protective effect on bone metabolism. Considering that different levels of UA have the diametrically opposite effect on BMD, large-sample, epidemiological studies and basic research or in-depth research are needed to determine the specific values of serum UA and to clarify its exact mechanism.
Limitations of this study
There were a few limitations to this study. First, this study was a cross-sectional study. We could not determine the causal relationship between serum UA and BMD due to the limitations of the data. Second, the participants in our study were from the elderly population older than 60 years old in the city of Shenyang, which is located in northeast China. Our study population might not be representative of the general population and could have a certain degree of bias. Third, although we have studied a variety of factors related to serum UA and BMD,such as age,gender, there remain some possible confounding factors that were not detected.
Data sharing statement
The authors do not intend to share personally identifiable participant data.
Disclosure
The authors report no conflicts of interest in this work.
References
1. Lane NE. Epidemiology, etiology, and diagnosis of osteoporosis. Am J Obstet Gynecol. 2006;194(2):S3–S11. doi:10.1016/j.ajog.2005.08.047
2. Reginster JY, Burlet N. Osteoporosis: a still increasing prevalence. Bone. 2006;38(2):4–9. doi:10.1016/j.bone.2005.07.016
3. Karasik D, Cohenzinder M. The genetic pleiotropy of musculoskeletal aging. Front Physiol. 2012;3(3):303. doi:10.3389/fphys.2012.00303
4. Wilson C. Bone: oxidative stress and osteoporosis. Nat Rev Endocrinol. 2014;10(1):3.
5. Kousteni S. FoxOs: unifying links between oxidative stress and skeletal homeostasis. Curr Osteoporos Rep. 2011;9(2):60–66. doi:10.1007/s11914-011-0054-3
6. Meng SJ, Yu LJ. Oxidative stress, molecular inflammation and sarcopenia. Int J MolSci. 2010;11(4):1509–1526. doi:10.1155/2010/354189
7. Mainini G, Rotondi M, Di NK, et al. Oral supplementation with antioxidant agents containing alpha lipoic acid: effects on postmenopausal bone mass. Clin Exp Obstet Gynecol. 2012;39(4):489–493.
8. Mlakar SJ, Osredkar J, Prezelj J, Marc J. The antioxidant enzyme GPX1 gene polymorphisms are associated with low BMD and increased bone turnover markers. Dis Markers. 2010;29(2):71–80. doi:10.1155/2010/354189
9. Keizman D, Ishshalom M, Berliner S, et al. Low uric acid levels in serum of patients with ALS: further evidence for oxidative stress? J Neurol Sci. 2009;285(1):95–99. doi:10.1016/j.jns.2009.06.002
10. Sautin YY, Johnson RJ. Uric acid: the oxidant-antioxidant paradox. Nucleosides Nucleotides. 2008;27(6–7):608–619. doi:10.1080/15257770802138558
11. Donghui MM. Moderate levels of plasma uric acid could promote fracture healing. Med Hypotheses. 2010;75(6):682. doi:10.1016/j.mehy.2010.07.054
12. Nabipour I, Sambrook PN, Blyth FM, et al. Serum uric acid is associated with bone health in older men: a cross‐sectional population‐based study. J Bone Miner Res. 2011;26(5):955–964. doi:10.1002/jbmr.286
13. Ahn SH, Lee SH, Kim BJ, et al. Higher serum uric acid is associated with higher bone mass, lower bone turnover, and lower prevalence of vertebral fracture in healthy postmenopausal women. Osteoporos Int. 2013;24(12):2961–2970. doi:10.1007/s00198-013-2377-7
14. Makovey J, Macara M, Chen JS, et al. Serum uric acid plays a protective role for bone loss in peri- and postmenopausal women: a longitudinal study. Bone. 2013;52(1):400–406. doi:10.1016/j.bone.2012.10.025
15. Kaushal N, Vohora D, Jalali RK, Jha S. Raised serum uric acid is associated with higher bone mineral density in a cross-sectional study of a healthy Indian population. Ther Clin Risk Manag. 2018;14:75–82. doi:10.2147/TCRM.S147696
16. Ishii S, Miyao M, Mizuno Y, Tanaka-Ishikawa M, Akishita M, Ouchi Y. Association between serum uric acid and lumbar spine bone mineral density in peri- and postmenopausal Japanese women. Osteoporos Int. 2014;25(3):1099–1105. doi:10.1007/s00198-013-2571-7
17. Kim BJ, Baek S, Ahn SH, et al. Higher serum uric acid as a protective factor against incident osteoporotic fractures in Korean men: a longitudinal study using the National Claim Registry. Osteoporos Int. 2014;25(7):1837–1844. doi:10.1007/s00198-014-2697-2
18. Chen L, Peng Y, Fang F, Chen J, Pan L, You L. Correlation of serum uric acid with bone mineral density and fragility fracture in patients with primary osteoporosis: a single-center retrospective study of 253 cases. Int J Clin Exp Med. 2015;8(4):6291–6294.
19. Zhao DD, Jiao PL, Yu JJ, et al. Higher serum uric acid is associated with higher bone mineral density in chinese men with type 2 diabetes mellitus. Int J Endocrinol. 2016,(2016-2-28). 2016;2016(6):2528956. doi:10.1155/2016/2528956
20. Dong X, Tian H, He J, Wang C, Qiu R, Chen Y. Elevated serum uric acid is associated with greater bone mineral density and skeletal muscle mass in middle-aged and older adults. PLoS One. 2016;11(5):e0154692. doi:10.1371/journal.pone.0154692
21. Xiao J, Chen W, Feng X, et al. Serum uric acid is associated with lumbar spine bone mineral density in healthy Chinese males older than 50 years. Clin Interv Aging. 2017;12:445–452. doi:10.2147/CIA.S130690
22. Sritara C, Ongphiphadhanakul B, Chailurkit L, Yamwong S, Ratanachaiwong W, Sritara P. Serum uric acid levels in relation to bone-related phenotypes in men and women. J Clin Densitom. 2013;16(3):336–340. doi:10.1016/j.jocd.2012.05.008
23. Muka T, de Jonge EA, Kiefte-de Jong JC, et al. The influence of serum uric acid on bone mineral density, hip geometry and fracture risk: the Rotterdam Study. J Clin Endocrinol Metab. 2015;101(3):jc20152446.
24. Veronese N, Bolzetta F, De RM, et al. Serum uric acid and incident osteoporotic fractures in old people: the PRO.V.A study. Bone. 2015;79:183–189. doi:10.1016/j.bone.2015.06.005
25. Zhang D, Bobulescu IA, Maalouf NM, et al. Relationship between serum uric acid and bone mineral density in the general population and in rats with experimental hyperuricemia. J Bone Miner Res. 2015;30(6):992–999. doi:10.1002/jbmr.2430
26. Liu R, Han C, Wu D, et al. prevalence of hyperuricemia and gout in Mainland China from 2000 to 2014: a systematic review and meta-analysis. Biomed Res Int. 2015;2015(15, supplement):1–12.
27. Qiu L, Cheng XQ, Wu J, et al. Prevalence of hyperuricemia and its related risk factors in healthy adults from Northern and Northeastern Chinese provinces. BMC Public Health. 2013;13(1):664. doi:10.1186/1471-2458-13-664
28. Peng C, Li Z, Hu Y. Prevalence of osteoporosis in China: a meta-analysis and systematic review. BMC Public Health. 2016;16(1):1039. doi:10.1186/s12889-016-3712-7
29. He L, Sun Y, Yao W, Pan K. The prevalence rate of osteoporosis in the elderly in China between 2010 and 2016: a meta-analysis of single rate. Chin J Osteoporos. 2016;22(12):1590–1596. (Chinese).
30. Cornelius C, Koverech G, Crupi R, et al. Osteoporosis and alzheimer pathology: role of cellular stress response and hormetic redox signaling in aging and bone remodeling. Front Pharmacol. 2014;5:120. doi:10.3389/fphar.2014.00120
31. Wauquier F, Leotoing L, Coxam V, Guicheux J, Wittrant Y. Oxidative stress in bone remodelling and disease. Trends Mol Med. 2009;15(10):468–477. doi:10.1016/j.molmed.2009.08.004
32. Bai XC, Lu D, Liu AL, et al. Reactive oxygen species stimulates receptor activator of NF-kappaB ligand expression in osteoblast. J Biol Chem. 2005;280(17):17497. doi:10.1074/jbc.M409332200
33. Reed DR, Price RA. X-linkage does not account for the absence of father-son similarity in plasma uric acid concentrations. Am J Med Genet. 2000;92(2):142–146.
34. Stern A, Laughlin GA, Bergstrom J, Barrett-Connor E. The sex-specific association of serum OPG and RANKL with bone mineral density in older adults: the Rancho Bernardo Study. Eur J Endocrinol. 2007;156(5):555. doi:10.1530/EJE-06-0753
35. Takahashi S, Yamamoto T, Moriwaki Y, Tsutsumi Z, Yamakita J, Higashino K. Decreased serum concentrations of 1,25(OH)2-vitamin D3 in patients with gout. Adv Exp Med Biol. 1998;431:336.
36. Jarrar K, Amasheh RA, Graef V, Weidner W. Relationship between 1,25-dihydroxyvitamin-D, calcium and uric acid in urinary stone formers. Urol Int. 1996;56(1):16–20. doi:10.1159/000282801
37. Krishnan E, Pandya BJ, Chung L, Dabbous O. Hyperuricemia and the risk for subclinical coronary atherosclerosis - data from a prospective observational cohort study. Arthritis Res Ther. 2011;13(2):R66. doi:10.1186/ar3322
38. Li YH, Lin GM. Sex differences in the association between serum uric acid and cardiac mortality in Asian patients with established coronary artery disease: a revisit of the ET-CHD registry in Taiwan, 1997–2003. J Cardiol. 2016;68(5):461. doi:10.1016/j.jjcc.2016.02.008
39. Wright NC, Looker AC, Saag KG, et al. The recent prevalence of osteoporosis and low bone mass in the United States based on bone mineral density at the femoral neck or lumbar spine. J Bone Miner Res. 2014;29(11):2520–2526. doi:10.1002/jbmr.2269
40. Odén A, McCloskey EV, Kanis JA, Harvey NC, Johansson H. Burden of high fracture probability worldwide: secular increases 2010–2040. Osteoporos Int. 2015;26(9):2243–2248. doi:10.1007/s00198-015-3154-6
41. Le Couteur DG, Everitt A, Lebel M. The aging liver. Geriatr Aging. 2009;12:319–322.
 © 2019 The Author(s). This work is published and licensed by Dove Medical Press Limited. The
full terms of this license are available at https://www.dovepress.com/terms
and incorporate the Creative Commons Attribution
- Non Commercial (unported, 3.0) License.
By accessing the work you hereby accept the Terms. Non-commercial uses of the work are permitted
without any further permission from Dove Medical Press Limited, provided the work is properly
attributed. For permission for commercial use of this work, please see paragraphs 4.2 and 5 of our Terms.
© 2019 The Author(s). This work is published and licensed by Dove Medical Press Limited. The
full terms of this license are available at https://www.dovepress.com/terms
and incorporate the Creative Commons Attribution
- Non Commercial (unported, 3.0) License.
By accessing the work you hereby accept the Terms. Non-commercial uses of the work are permitted
without any further permission from Dove Medical Press Limited, provided the work is properly
attributed. For permission for commercial use of this work, please see paragraphs 4.2 and 5 of our Terms.