Back to Journals » International Journal of Nanomedicine » Volume 14
Size- and cell type-dependent cellular uptake, cytotoxicity and in vivo distribution of gold nanoparticles
Authors Xia Q, Huang J, Feng Q, Chen X, Liu X, Li X, Zhang T, Xiao S ![]() , Li H, Zhong Z, Xiao K
, Li H, Zhong Z, Xiao K ![]()
Received 30 April 2019
Accepted for publication 6 August 2019
Published 28 August 2019 Volume 2019:14 Pages 6957—6970
DOI https://doi.org/10.2147/IJN.S214008
Checked for plagiarism Yes
Review by Single anonymous peer review
Peer reviewer comments 2
Editor who approved publication: Dr Mian Wang
Qiyue Xia,1,2,* Jinxing Huang,1,* Qiyi Feng,1 Xuanming Chen,1 Xinyi Liu,1 Xiaojie Li,1 Ting Zhang,3 Shuwen Xiao,1 Hongxia Li,1 Zhihui Zhong,3,4 Kai Xiao1,4
1National Chengdu Center for Safety Evaluation of Drugs and National Clinical Research Center for Geriatrics, West China Hospital of Sichuan University, Chengdu, Sichuan Province, China; 2Toxicology Department, Sichuan Center for Disease Control and Prevention, Chengdu, Sichuan Province, China; 3Laboratory of Nonhuman Primate Disease Modeling Research, State Key Laboratory of Biotherapy, West China Hospital, Sichuan University, Chengdu, China; 4Sichuan Kangcheng Biotech Co., Ltd, Chengdu, Sichuan Province, China
Correspondence: Kai Xiao
National Chengdu Center for Safety Evaluation of Drugs and National Clinical Research Center for Geriatrics, West China Hospital, Sichuan University, 28 Gaopeng Ave, High-Tech Development Zone, Chengdu 610041, Sichuan Province, People’s Republic of China
Tel +86 288 332 6313
Fax +86 288 517 3043
Email [email protected]
*These authors contributed equally to this work
Background: Gold nanoparticles (AuNPs) have shown great promise in biomedical applications. However, the interaction of AuNPs with biological systems, its underlying mechanisms and influencing factors need to be further elucidated.
Purpose: The aim of this study was to systematically investigate the effects of particle size on the uptake and cytotoxicity of AuNPs in normal cells and cancer cells as well as their biological distribution in vivo.
Results: Our data demonstrated that the uptake of AuNPs increased in HepG2 cancer cells but decreased in L02 normal cells, with the increase of particle size (5-50 nm). In both cancer cells and normal cells, small (5 nm) AuNPs exhibited greater cytotoxicity than large ones (20 and 50 nm). Interestingly, 5 nm AuNPs induced both apoptosis and necrosis in HepG2 cells through the production of reactive oxygen species (ROS) and the activation of pro-caspase3, whereas it mainly induced necrosis in L02 cells through the overexpression of TLR2 and the release of IL-6 and IL-1a cytokines. Among them, 50 nm AuNPs showed the longest blood circulation and highest distribution in liver and spleen, and the treatment of 5 nm AuNPs but not 20 nm and 50 nm AuNPs resulted in the increase of neutrophils and slight hepatotoxicity in mice.
Conclusion: Our results indicate that the particle size of AuNPs and target cell type are critical determinants of cellular uptake, cytotoxicity and underlying mechanisms, and biological distribution in vivo, which deserves careful consideration in the future biomedical applications.
Keywords: gold nanoparticles, particle size, uptake, toxicity, biodistribution
Introduction
Owing to the straightforward synthesis, easy surface modification and unique physical, chemical and photonic properties, gold nanoparticles (AuNPs) have shown great promise in biosensors,1–3 cellular and animal imaging,4 photo-thermal therapy,5–7 and targeted delivery of drugs, genes and diagnostic agents.8 In consideration of their increasing biomedical applications, it is imperative to thoroughly understand the interaction between AuNPs with biological systems, potential mechanisms and safety concerns. Gold materials are generally considered to be bio-inert, nontoxic and biocompatible. However, AuNPs may have much higher bioactivity due to their high surface area to volume ratio.9 In recent years, the toxicity of AuNPs has been reported, which depends largely on their physicochemical properties such as shape, size and surface chemistry.10,11
Particle size is one of the most important factors in determining the interactions of AuNPs with biological systems, ultimately influencing their uptake and toxicity.10,12,13 AuNPs with a small particle size can pass through cells or subcellular organelles such as nucleus, which may facilitate the delivery of therapeutic molecules into cells.14 For example, Elbakry et al reported the size-dependent delivery of DNA into cells by layer-by-layer-coated AuNPs (20 nm, 30 nm, 50 nm and 80 nm).15 They found that AuNPs with the smallest particle size (20 nm) yielded the highest number of nanoparticles and therapeutic DNA molecules per cell. On the other hand, the increased cellular uptake of small-sized AuNPs may increase toxicity simultaneously. Pan et al demonstrated that 1.4-nm AuNPs capped with triphenylphosphine monosulfonate, Au1.4MS, was highly toxic in four different cell lines, with the IC50 values ranging from 30 µM to 56 µM. In contrast, 15-nm AuNPs (Au15MS) with similar chemical composition were nontoxic at up to 60-fold higher concentrations.16 Similar size-dependent cytotoxicity of AuNPs was also observed by Liu and his colleagues.17 They demonstrated that 5-nm AuNPs inhibited proliferation, promoted apoptosis and induced cell cycle arrest in lung cancer cell lines, whereas no obvious cytotoxicity was observed in larger AuNPs (20 nm and 40 nm). However, there are other reports showing different size-dependent effects of AuNPs. For example, Devika et al.18 investigated the size-dependent uptake of spherical AuNPs (14 mm, 30 mm, 50 mm, 74 mm and 100 nm) in mammalian Hela cells using transmission electron microscopy (TEM) and inductively coupled plasma atomic emission spectroscopy. They found that the maximum cellular uptake occurred at a particle size of 50 nm instead of the smallest size (14 nm). Except for cell uptake, Jiang et al.19 also showed that 40-nm and 50-nm AuNPs had the greatest effect on cell functions (including cell death) in the range of 2–100 nm. Recent 28-day in vivo toxicity studies of PEGylated AuNPs have shown that the toxicity of the 10-nm and 60-nm particles is significantly higher than that of the 5-nm and 30-nm particles, suggesting that smaller particle size is not necessarily associated with greater toxicity.
Current biodistribution data indicate that most of the AuNPs are rapidly removed from the bloodstream by the reticuloendothelial system after intravenous injection, mainly concentrated in the liver and spleen. The physicochemical characteristics such as particle size may influence the bio-kinetics and distribution pattern of AuNPs. For example, Hirn et al20 investigated the biodistribution of 198Au-radio-labeled monodisperse AuNPs of five different sizes (1.4 nm, 5 nm, 18 nm, 80 nm and 200 nm) by gamma-spectrometry. They demonstrated that most of AuNPs were distributed in the liver and the amount increased with the size of AuNPs. Only a few percent of 5-nm, 18-nm, 80-nm and 200-nm AuNPs distributed in other organs or tissues. In contrast, almost 50% of the 1.4-nm AuNPs escaped being trapped in the liver and thus accumulated in the other organs and tissues. Another study performed by Zhang et al13 showed different size-dependent biodistribution patterns of AuNPs. The results demonstrated that at 28 days after intravenous injection of PEG-coated AuNPs (5 nm, 10 nm, 30 nm, and 60 nm), 5-nm and 10-nm particles were mainly accumulated in the liver and 30-nm particles were mainly accumulated in the spleen, while the 60-nm particles were not significantly accumulated in either organ.
Overall, data on the size-dependent effects of AuNPs are so far inconclusive, which might be due to the variations in other confounding factors, such as shape, surface coating and agglomeration of AuNPs, as well as the cell types, route and duration of exposure, and experimental conditions. The aim of this study was to investigate the uptake, cytotoxicity, biodistribution and in vivo toxicity of commercially available and well-characterized AuNPs (5 nm, 20 nm and 50 nm) with a specific focus on the size-dependent effects, and to explore their potential mechanisms of toxicity in cancer cells and normal cells.
Materials and methods
Materials
Five-nanometer AuNPs (752568, Lot# MKBQ0180V), 20-nm AuNPs (753610, Lot# MKBR0719V) and 50-nm AuNPs (753645, Lot# MKBR0264V) were purchased from Sigma-Aldrich (St. Louis, MO, USA). IL-6 and IL-1α human ELISA kit was purchased from Thermo Fisher Scientific (Waltham, MA, USA). FITC Annexin V Apoptosis Detection Kit was purchased from Keygen Biotech (Nanjing, China). Anti-Pro-caspase 3 antibody (CST #9662) was purchased from Cell Signaling Technology (Danvers, MA, USA). Anti-TLR2 antibody (ab108998) was purchased from Abcam (Cambridge, MA, USA). MTT reagent was purchased from Amresco (Solon, OH, USA). 2′, 7′-Dichlorofluorescin diacetate (DCF-DA) and all other chemicals were purchased from Sigma-Aldrich (St. Louis, MO, USA).
Characterization of AuNPs
The morphology and particle size of AuNPs were observed on a Tecnai G2 F20 TEM operating at an acceleration voltage of 80 kV. One drop of AuNPs colloidal solution was deposited on a TEM grid, dried and evacuated before TEM observation. UV–vis absorption spectra (wavelength range of 400–800 nm) of AuNPs colloidal suspensions in 0.1 mM PBS or DMEM cell culture medium with 10% FBS was measured using a NanoDrop 2000 spectrometer (Thermo Scientific). The zeta potential of AuNPs in double distilled (DD) water and the stability in zeta potential of AuNPs in DMEM with 10% FBS were measured by NanoBrook Omni (Brookhaven), respectively.
Cell culture
HepG2 cells and L02 cells were obtained from the Shanghai Cell Line Bank (Shanghai, China) and cultured in DMEM supplemented with 10% FBS, 100 U/mL penicillin G and 100 mg/mL streptomycin at 37°C using a humidified 5% CO2 incubator.
Cytotoxicity assay
HepG2 cells and L02 cells were exposed to PBS control and increased concentrations of different sized AuNPs (0–12.5 µg/mL), respectively. After 72-hr incubation, the cell viability was evaluated by MTT assay.
Hemolysis test
The suspension of erythrocytes in PBS (2%) was prepared using freshly harvested mouse blood. Then, 200 µL aliquot of the erythrocytes suspension was mixed with different sized AuNPs at the concentrations of 100 µM. PBS and distilled water were used as negative control and positive control, respectively. After 4-hr or 24-hr incubation at 37°C, the mixtures were centrifuged, and 100 µL of the supernatant of all samples was collected. Free hemoglobin in the supernatant was measured by the absorbance at 540 nm using a microplate reader (SpectraMax M2, Molecular Devices). The percent hemolysis of RBCs was calculated using the following formula: RBCs hemolysis = (ODsample – ODnegative control)/(ODpositive control – ODnegative control) ×100%.
Cellular uptake
HepG2 cells and L02 cells were exposed to PBS control and different sized AuNPs at the concentration of 12.5 µg/mL, respectively. After 24-hr exposure, cells were collected and dissolved overnight with 3% HNO3, and rhodium was added as internal standard. Gold elements in the samples were detected by inductively coupled plasma mass spectrometry (ICP-MS). Meanwhile, A series of gold standard solutions (20 ppb, 10 ppb, 5 ppb, 2 ppb, 1 ppb, 0.5 ppb, 0.2 ppb and 0 ppb) were prepared and measured by ICP-MS to calculate calibration curves, which were used to determine the amount of gold taken up by cells in each sample.
ROS
ROS were determined using DCFH-DA according to the kit protocol. HepG2 cells and L02 cells were incubated with different sized AuNPs at the concentration of 12.50 µg/mL for 4 hrs. ROS production was qualitatively observed by confocal fluorescence microscopy (Olympus IX83).
Apoptosis analysis
HepG2 cells and L02 cells were treated with different sized AuNPs at the concentration of 1.67 µg/mL, 5.00 µg/mL and 12.5 µg/mL, respectively. After 72-hr treatment, cells were washed with PBS and stained with propidium iodide (PI) and Annexin V for 30 mins. Apoptosis was analyzed by flow cytometry (BD FACSCalibur).
Western blot analysis
HepG2 and L02 cells were exposed to PBS control and different sized AuNPs (5 nm, 20 nm and 50 nm) at the concentrations of 1.67 µg/mL, 5.00 µg/mL and 12.5 µg/mL, respectively. After 72-hr exposure, the cells were lysed with RIPA buffer, and the cell lysates were subjected to SDS-PAGE and transferred to PVDF membrane (Millipore, Billerica, MA, USA). The membrane was incubated with primary antibodies (anti-procaspase 3, TLR2 and β-actin) overnight at 4°C, washed with TBST buffer and incubated with horseradish peroxidase (HRP)-conjugated secondary antibodies for 1.5 hrs at room temperature. Chemiluminescent HRP substrate was added to visualize the protein bands. Densitometric values were analyzed with the Gel-Pro analyzer and normalized using β-actin as internal control.
IL-6 and IL-1α in the culture supernatants
HepG2 and L02 cells were exposed to PBS control and 12.5 µg/mL of different sized AuNPs (5 nm, 20 nm and 50 nm), respectively. After 24-hr exposure, the culture supernatant was extracted, and the levels of IL-6 and IL-1α in the culture supernatant were measured by human IL-6 and IL-1α ELISA kit, respectively.
Blood clearance and tissue biodistribution of different sized AuNPs
BALB/c mice, 6–8 weeks old, were purchased from the breeding center of Guangdong Medical Laboratory Animal, China. All animals were bred under specific pathogen-free conditions according to AAALAC guidelines and were allowed to acclimatize for at least 4 days prior to experiments. All animal experiments were performed in compliance with the institutional guidelines and approved by the Animal Use and Care Administrative Advisory Committee of West China Hospital, Sichuan University (Approval No. 2017036A), and all the animals were treated humanely and with regard for alleviation of suffering. BALB/c mice (n=4) were intravenously injected with different sized AuNPs (5 nm, 20 nm and 50 nm) at the dose of 0.5 mg/kg, respectively. At predetermined intervals (0.3 hr, 1 hr, 3 hrs, 6 hrs and 24 hrs), blood samples (10 μL) were taken from the orbital vein. At 24 hrs postinjection, main organs including heart, liver, spleen, kidney, lung and brain were harvested, weighed and homogenized. The gold content in the collected blood and organs was determined by ICP-MS as previously described.21
In vivo toxicity of different sized AuNPs
BALB/c mice were randomly assigned into four groups (n=4), and they were injected intravenously with different sized AuNPs (5 nm, 20 nm and 50 nm) at the dose of 0.5 mg/kg once per day for 5 consecutive days, with the cumulative dose of 2.5 mg/kg. The animal behavior and body weight were monitored every day for 2 weeks. Blood samples were collected on day 7 after the first dosage for blood cell counts and serum chemistry (hepatic and renal function panels) analysis. At 14 days postinjection, the animals were sacrificed, and major organs were excised for gross observation. Liver and spleen were fixed with 10% formalin, embedded in paraffin blocks, sliced into 5 µm in thickness and then stained with HE before the histopathological examination.
Statistical analysis
Statistical analysis was performed using the GraphPad6.02 software (San Diego, CA, USA). Data were analyzed by one-way ANOVA for multiple comparisons, followed by Dunnett’s test. A value of P<0.05 was considered statistically significant.
Results
Characterization of AuNPs
Table 1 summarizes the physicochemical characteristics of AuNPs provided by the manufacturer. The core sizes of 5-nm-, 20-nm and 50-nm AuNPs were 3–7 nm, 18–22 nm and 47–53 nm, respectively. The hydrodynamic diameters of 5-nm, 20-nm and 50-nm AuNPs were 7–20 nm, 21–32 nm and 51–63 nm, respectively. The polydispersity indices of all three sized AuNPs were lower than 0.2. The particle numbers of 5-nm, 20-nm and 50-nm AuNPs in 1 mL colloidal solution were 5.47×1013,6.54×1011, 1.72×10¹⁰. The morphology and size distribution of these AuNPs were characterized by TEM. As shown in Figure 1A, all three AuNPs (5 nm, 20 nm and 50 nm) were spherical and homogeneous, and their particle sizes were almost consistent with their theoretical values. The absorbance of AuNPs colloidal solution in PBS was characterized by UV−vis spectra (Figure 1B). The red shift of the peak in surface plasmon resonance of AuNPs indicated an increase of particle size, and the absorbance peaks of 5-nm, 20-nm and 50-nm AuNPs were 516 nm, 524 nm and 535 nm, respectively. The colloidal stability of AuNPs in cell culture medium was also determined by the UV−vis spectra. The absorption spectra of 5-nm and 20-nm AuNPs in DMEM showed a little red shift (Figure 1C and D), indicating the potential aggregation of AuNPs as a result of serum protein absorption. The UV−vis specta of 50-nm AuNPs in DMEM and PBS solution were similar (Figure 1E), indicating that they have good dispersion stability. It has been shown that both particle size and surface properties play a critical role in determining the protein absorption and “corona” formation of NPs.22 The zeta potentials of 5-nm, 20-nm and 50-nm AuNPs in DD water were −10.33 mV, −4.58 mV and −12.32 mV, respectively. In addition, the stability of AuNPs in DMEM with 10% FBS was also measured using zeta potential. As shown in Figure S1, when added into DMEM, the zeta potential of 5-nm AuNPs increased from −10.33 mV to −5.88 mV immediately and further increased to −0.15 mV after 24-hr incubation, which may be due to protein absorption on the surface. In contrast, the zeta potential of 20-nm and 50-nm AuNPs in DMEM did not change much (in the range of 3 mV), indicating that they were relatively stable and had less protein absorption.
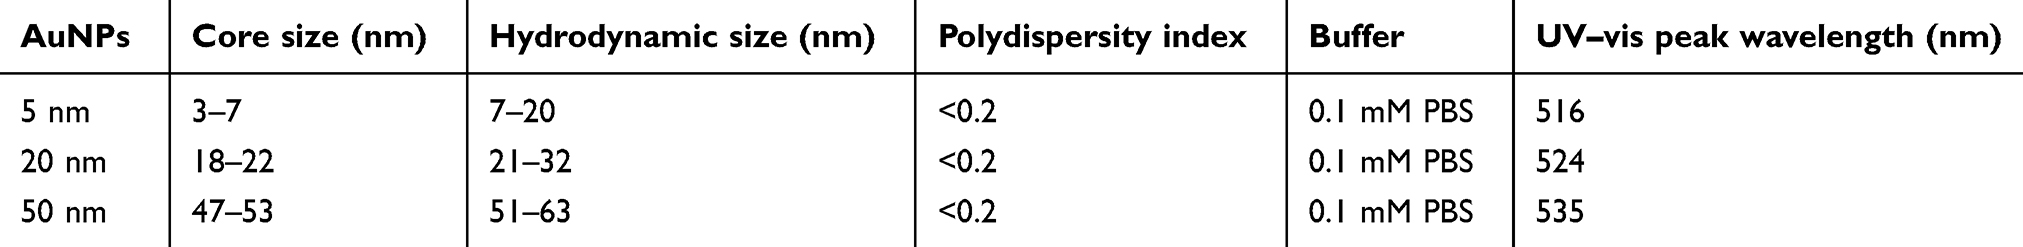 |
Table 1 Physicochemical characteristics of AuNPs |
 |
Figure 1 Characterization of different sized gold nanoparticles (AuNPs). (A) Transmission electron microscopy (TEM) images of AuNPs with diameters of 5 nm, 20 nm or 50 nm. The scale bar is 20 nm. (B) UV–vis absorption spectra of different sized AuNPs in 0.1 Mm PBS. UV–vis spectra of 5-nm AuNPs (C), 20-nm AuNPs (D) and 50-nm AuNPs (E) in cell culture medium with 10% FBS. |
Cytotoxicity of AuNPs in HepG2 and L02 cells
The cytotoxicity of different sized AuNPs was evaluated in both HepG2 human hepatoma cells and L02 normal human hepatocytes. After 72-hr incubation, 20-nm and 50-nm AuNPs showed no appreciable cytotoxicity against both HepG2 and L02 cells at the concentrations from 1.67 µg/mL to 12.5 µg/mL, whereas 5-nm AuNPs at the concentration of 12.5 µg/mL led to a decrease in cell viability of HepG2 cells (81.47%) and showed concentration-dependent cytotoxicity against L02 cells (Figure 2A and B). The results demonstrated that L02 cells were more susceptible to the cytotoxicity of 5-nm AuNPs than HepG2 cells.
 |
Figure 2 In vitro cytotoxicity of different sized gold nanoparticles (AuNPs) against HepG2 hepatoma cells (A) and L02 hepatocyte cells (B). Cells were treated with different concentrations of AuNPs, respectively. After 72-hr incubation, the cell viability was measured by MTT assay. (C) Cellular uptake of different sized AuNPs. Samples were collected after 24-hr exposure, and the Au content in cells was detected by inductively coupled plasma mass spectrometry. *P<0.05, **P<0.01, when compared with control. |
Hemolysis test
The hemolytic activities of different sized AuNPs were evaluated using hemolysis assay. AuNPs were incubated with mouse erythrocytes suspension at 37°C for 4 hrs and 24 hrs, respectively. The results demonstrated that all these AuNPs had negligible hemolytic activities at the concentration up to 100 µM after 4-hr incubation. After 24-hr incubation, AuNPs exhibited slight hemolysis, but there was no significant difference among different sized AuNPs (Figure S2).
Cellular uptake of AuNPs measured by ICP-MS
The cellular uptake of different sized AuNPs in both HepG2 cancer cells and L02 normal cells was quantitatively measured by ICP-MS. Compared to that in PBS control, the gold content in cells treated with all the AuNPs increased significantly (P<0.05, Figure 2C). The cellular uptake of AuNPs was both size- and cell type-dependent. For instance, 5-nm AuNPs exhibited comparable uptake in both cancer and normal cells (HepG2: 111.7±21.5 ng/104cells, L02: 109.2±12.3 ng/104cells). However, with the increase of particle size, the uptake of AuNPs in HepG2 cells increased proportionally (20 nm: 452.5±19.5 ng/104 cells, 50 nm: 665.0±108.9 ng/104cells), while the uptake of 50-nm AuNPs in L02 cells (69.1±28.3 ng/104cells) was significantly lower than that of 5 nm and 20 nm ones (110.6±14.5 ng/104cells).
ROS
The intracellular ROS in cells after exposure of different sized AuNPs was measured by DCF-DA assay. DCF-DA is a redox-sensitive non-fluorescent dye, which could be oxidized to green-fluorescent DCF in response to intracellular ROS. As shown in the fluorescence microscopic images (Figure 3), all the AuNPs, especially 5-nm AuNPs, can significantly induce the production of intracellular ROS in both HepG2 and L02 cells.
 |
Figure 3 Intracellular ROS production in HepG2 cells and L02 cells after gold nanoparticles (AuNPs) exposure was detected by confocal fluorescence microscopy. Cells were treated with different sized AuNPs at the concentration of 12.50 µg/mL for 4 hrs, respectively. Intracellular ROS was measured using 10 µM DCF-DA probe. |
Apoptosis/necrosis measurement
Flow cytometric analysis with PI/annexin V dual staining was used to determine the apoptotic or necrotic cell death induced by 5-nm AuNPs in HepG2 and L02 cells (Figure 4). In HepG2 cells, 5-nm AuNPs induced both apoptosis and necrosis in a dose-dependent manner. At the concentration of 12.5 µg/mL, the population of apoptotic cells (Q2+ Q3) and necrotic cells (Q1) induced by 5-nm AuNPs were 6.99±0.44% and 10.59±3.92%, respectively. They were significantly higher than those in the control group (apoptotic rate was 2.74±0.43% and necrotic rate was 4.29±0.50%, respectively). However, in L02 cells, 5-nm AuNPs mainly caused cell necrosis, with a minimal number of apoptotic cells.
 |
Figure 4 Apoptotic and necrotic cell death of HepG2 cells and L02 cells were detected by flow cytometry with Annexin V and propidium iodide (PI) dual staining after 72-hr exposure of 5-nm gold nanoparticles. The flow cytometric analysis was performed in triplicate. |
Cytokines release
ELISA was used to detect the release of pro-inflammatory cytokines such as IL-6 and IL-1α in the supernatant of HepG2 and L02 cells after 24-hr exposure of AuNPs. In HepG2 cells, 5-nm AuNPs but not 20-nm and 50-nm AuNPs significantly reduced the release of IL-6 cytokine when compared to negative control (P<0.05, Figure 5A). However, in L02 cells, 5-nm AuNPs significantly enhanced the release of both IL-6 and IL-1α cytokines when compared to negative control (P<0.05, Figure 5B and C).
 |
Figure 5 Cytokine production in HepG2 cells and L02 cells after 24-hr exposure of different sized gold nanoparticles (12.5 µg/mL). (A) IL-6 levels in HepG2 cells, (B) IL-6 levels in L02 cells, (C) IL-1α levels in L02 cells. Complete medium (DMEM supplemented with 10% FBS) was used as the control group. Supernatants were collected for ELISA analysis. Data are expressed as means ± SEM of three independent experiments performed in duplicate. *P<0.05, when compared with control. |
Western blot
Western blot analysis was performed to investigate the effects of AuNPs on the expression of Pro-caspase3 and Toll-like receptor 2 (TLR2). Pro-caspase 3 is one of the important proapoptotic proteins, and TLR2 is one of the toll-like receptors, which has been proved to mediate the production of cytokines.23–25 As shown in Figure 6, the treatment of 20-nm and 50-nm AuNPs had no significant effect on the expression of Pro-caspase3 and TLR2 proteins in HepG2 and L02 cells. However, the treatment of 5-nm AuNPs significantly reduced the expression of Pro-caspase3 and TLR2 proteins in HepG2 cells, but slightly increased the expression of TLR2 protein in L02 cells.
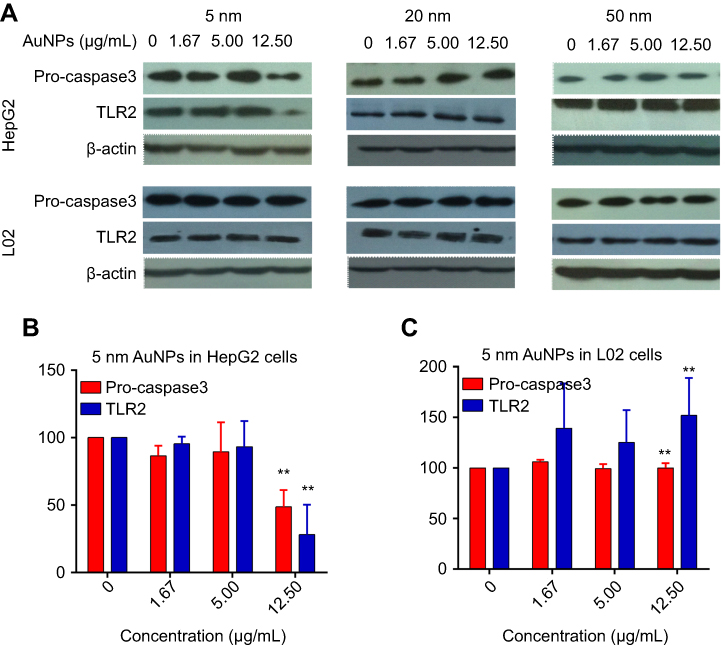 |
Figure 6 The expression of Pro-caspase3 and TLR2 protein in HepG2 cells and L02 cells after 72-hr exposure of different sized gold nanoparticles (AuNPs). β-actin was used as internal control. (A) Western blot results detected by enhanced chemiluminescence and an X-ray-film exposure system. Relative densitometric value of Pro-caspase3 and TLR2 protein normalized by β-actin in HepG2 cells (B) and L02 cells (C). Data are expressed as means ± SEM of three independent experiments. **P<0.01, when compared with control. |
Blood clearance and in vivo biodistribution of different sized AuNPs
To investigate the effects of particle size on the blood kinetics and tissue distribution of AuNPs, AuNPs (5 nm, 20 nm and 50 nm) were intravenously injected into BALB/c mice at a single dose of 0.5 mg/kg, and the Au content present in the blood and main organs/tissues was determined by ICP-MS measurement. The kinetics of AuNPs in the blood at different time points postinjection is illustrated in Figure 7A. The result demonstrated that particle size had a dramatic influence on the blood clearance of AuNPs. Five-nanometer and 20-nm AuNPs showed similar blood circulation profiles, and they were rapidly cleared from the blood during the first 1 hr after intravenous injection. In contrast, 50-nm AuNPs exhibited much slower blood clearance, and the Au concentration of 50-nm AuNPs in the blood during the first 2 hrs after the injection was significantly higher than that of 5-nm and 20-nm AuNPs. At 24 hrs postinjection, the main organs including heart, liver, spleen, lung, kidney and brain were excised and extracted for ICP-MS analysis. As shown in Figure 7B, AuNPs preferentially accumulated in the liver and spleen, regardless of particle size. However, the Au levels of 50-nm AuNPs in the liver and spleen were significantly higher than those of 5 nm and 20 nm ones, respectively (P<0.05). The Au concentrations of 5-nm, 20-nm and 50-nm AuNPs in the liver were 4463±759 ng/g, 5201±684 ng/g and 9462±855 ng/g, respectively, and the Au concentrations of 5-nm, 20-nm and 50 nm AuNPs in the spleen were 1226±222 ng/g, 881±854 ng/g and 4338±1447 ng/g, respectively. In addition, Au was found in the lung, kidney and heart of all animals exposed to AuNPs, but at much lower levels. The Au level of 5-nm AuNPs in the lung (116±17 ng/g) was significantly higher than that of 20-nm AuNPs (60±7 ng/g) and 50-nm AuNPs (64±8 ng/g), respectively (P<0.05). The Au levels of 5-nm, 20-nm and 50-nm AuNPs in the heart were 23±22 ng/g, 9±5 ng/g and 12±6 ng/g, respectively. The Au level of 50-nm AuNPs in the kidney (40±9 ng/g) was significantly higher than that of 5-nm AuNPs (16±6 ng/g) and 20-nm AuNPs (15±5 ng/g), respectively (P<0.05). Furthermore, traceable amounts of Au were detected in the brain of all animals exposed to AuNPs. The Au levels of 5-nm, 20-nm and 50-nm AuNPs in the brain were 4±6 ng/g, 2±3 ng/g and 4±4 ng/g, respectively, which were higher than the background level in the PBS control group (0±0 ng/g). The presence of AuNPs in the brain indicates that these AuNPs are able to cross the blood-brain barrier (BBB), although there is no significant difference in the level of Au between groups of different sized AuNPs.
 |
Figure 7 In vivo blood clearance (A) and tissue biodistribution (B) of different sized gold nanaoparticles (AuNPs) in BALB/c mice after intravenous administration at the dose of 0.5 mg/kg. Blood samples were collected at the indicated time points, and the Au content in blood was detected by inductively coupled plasma mass spectrometry (ICP-MS) analysis. At 24 hrs postinjection, major organs were excised and extracted for ICP-MS analysis. **P<0.01. |
In vivo toxicity of different sized AuNPs
The in vivo toxicity profile of different sized AuNPs was investigated in BALB/c mice after five repeated doses (i.v., 0.5 mg/kg, once per day for 5 consecutive days). After the injection, the animals were well tolerated and did not exhibit abnormal clinical signs or behaviors throughout the experiment. Compared with PBS control group, there was no significant difference in weight gain after AuNPs treatment, although the body weight of mice in the 5-nM AuNPs group decreased slightly after administration (Figure 8A). Necropsy at 14 days postinjection did not show obvious macroscopic changes in the organs of all the AuNPs treatment groups. In addition, histopathological examination of the liver and spleen showed no obvious signs of tissue damage (Figure 8B), except for slight liver hemorrhage in mice treated with 5-nm AuNPs. On the 7th day after the first dose of AuNPs, the effects of AuNPs on hematology, hepatic and renal function were evaluated in blood samples collected from animals. As shown in Figure 8C, 5-nm AuNPs treatment significantly increased the percentage of neutrophils compared with the control group (P<0.05). There was no significant difference in other hematological parameters (including white blood cells, red blood cells and platelets) in all AuNPs treated mice. Serum chemistry results (Figure 8D) demonstrated that the levels of alanine aminotransferase (ALT) and aspartate aminotransferase (AST) in serum of 5-nm AuNPs-treated mice increased slightly, but there was no statistical difference compared with the PBS control (P>0.05). There were no significant changes in BUN and creatinine in serum of mice exposed to AuNPs.
 |
Figure 8 Body weight change (A), histopathological images of liver and spleen (B), blood cell counts (C) and serum chemistry (D) in BALB/c mice injected intravenously with different sized gold nanoparticles (AuNPs) at the dose of 0.5 mg/kg once a day for 5 days. The blood samples were collected on day 7 after the first dosage for blood cell counts and serum chemistry (hepatic and renal function panels) analysis. After 2 weeks, major organs including liver and spleen were excised for histopathological examination.*P<0.05, when compared with control.Abbreviations: RBC, red blood cell; WBC, white blood cell; ALT, alanine aminotransferase; AST, aspartate aminotransferase. |
Discussion
AuNPs have recently emerged as prominent vehicles for many biomedical applications from bio-sensing to drug delivery. However, their interaction with biological systems, distribution, toxicity and underlying mechanisms needs to be thoroughly understood. In this study, we found that smaller AuNPs (5 nm) that were able to significantly inhibit cell proliferation and promote apoptosis/necrosis in both HepG2 and L02 cells after 72-hr exposure. Meanwhile, L02 cells seemed more sensitive to cytotoxicity of 5-nm AuNPs than HepG2 cells, which supports that AuNPs do not universally target all cell types.11,26–28 This is in agreement with the results of other research groups.29 The uptake of 5-nm AuNPs in HepG2 and L02 cells was comparable. However, with the increase of particle size from 5 nm to 50 nm, the uptake of AuNPs increased proportionally in HepG2 cancer cells, but decreased in L02 normal cells. Thus, we infer that AuNPs with different sizes may enter cancer cells or normal cells in different ways, such as transmembrane diffusion through membrane or protein channel and receptor-mediated endocytosis (RME) pathway.30,31 Particles smaller than 12 nm may enter the cells through the former way, while the larger ones (≈50 nm) through the RME pathway.19,32 In RME, there are two main factors affecting the endocytosis process.18 The first one is the nonspecific adsorbed serum proteins on the surface of nanoparticles such as α- and β- globulin proteins, C3 component, vitronectin and fibronectin, which may significantly contribute to the uptake of nanoparticles in tumor cells through multiple receptors on the membrane;33 the second one is the available receptors on the cell membrane which would determine whether and how much nanoparticles enter into a cell via this mechanism. This may explain why larger AuNPs are taken up much more in tumor cells, since multiple protein receptors, such as mucin glycoprotein, transferrin receptors and vitamin receptors, are overexpressed on the surface of cancer cells.31,34,35 Interestingly, we found that the cytotoxicity of AuNPs was not positively correlated with cellular uptake. However, the cytotoxicity may be related to the intracellular localization of AuNPs. As reported in our previous study,36 5-nm AuNPs tended to aggregate in the cell after entering the cytoplasm and were confined within endosome or lysosome, where acidic pH may induce the release of the toxic ions, which may subsequently exhibit ion-specific toxicity.37
It was noteworthy that the in vivo distribution of AuNPs in the liver was inconsistent with the uptake data obtained in normal hepatocytes in vitro. It is speculated that the abundant macrophages in the liver, known as Kupffer cells, may lead to higher uptake of 50-nm AuNPs in vivo than smaller counterparts. In addition, the exocytosis rate of smaller AuNPs may be faster than that of larger ones,38 which may partially explain the lower distribution of smaller AuNP in vivo.
In this study, we demonstrated that small AuNPs (5 nm) were more likely to react with intracellular molecules and produce ROS in both L02 and HepG2 cells. As a result, the elevated ROS levels could imbalance the intracellular redox state12,39–41 and finally lead to the occurrence of apoptosis, activation of inflammasome and release of inflammatory cytokines.42–44 As shown by the results of Annexin V/PI double staining, 5-nm AuNPs induced both apoptosis and necrosis in HepG2 cells, but only led to necrosis in L02 cells. This suggests that the cytotoxicity of AuNPs may involve different molecular mechanisms in cancer cells and normal cells.45 Interestingly, the previous study demonstrated that different sized AuNPs may undergo different molecular mechanisms even in the same cells. For example, both apoptosis and necrosis were induced by 1.2-nm AuNPs in HeLa cells, while 1.4-nm-sized ones caused cell death mainly through the necrosis ways, which may attribute to their specific size and their irreversible blocking of potassium ion channels.46 Subsequent data on protein expression and production of inflammatory cytokines further confirmed this hypothesis. After exposure to 5-nm AuNPs, Pro-caspase 3, a representative protein involved in apoptosis pathway, was cleaved only in HepG2 cells but not in L02 cells, indicating that the apoptotic events observed in HepG2 cells treated with 5-nm AuNPs may be the result of Pro-caspase 3 activation. On the other hand, after exposure to 5-nm AuNPs, the expression of TLR2 protein, which plays a unique role in the inflammatory response, significantly decreased in HepG2 cells, but slightly increased in L02 cells. Furthermore, we measured the release of pro-inflammatory cytokines. The results showed that the level of IL-6 in HepG2 cells treated with 5-nm AuNPs decreased significantly, and its anti-inflammatory activity may be related to the interaction of extracellular IL-6. The size of AuNPs is a key parameter to determine the changes of inflammatory cytokines.47 On the contrary, the levels of IL-6 and IL-1α in L02 cells treated with 5-nm AuNPs were significantly higher than those in the control group, which is likely due to the upregulation of TLR2 signaling pathway.48 Thus, we infer that the necrosis of L02 cells induced by 5-nm AuNPs may arise from TLR2-mediated production of inflammatory cytokines.
Our data also demonstrated that the blood clearance and tissue distribution of AuNPs were strongly dependent on particle size. For example, the clearance of 5-nm and 20-nm AuNPs from blood circulation was much faster than that of 50 nm ones. The uptake of 50-nm AuNPs in liver, spleen and kidney was higher than that of 5 nm and 20 nm ones, while the uptake of 5-nm AuNPs in the lung was higher than that of 20 nm and 50 nm ones. As we know, nanoparticles entering cells could exocytose to the media via three pathways: lysosome secretion, vesicle-related secretion and non-vesicle-related secretion, and smaller nanoparticles are more favorable for exocytosis.49 The in vivo distribution of AuNPs in the liver implied that they could secrete into bile and eventually be eliminated through gut and feces.50 The elimination of the smaller NPs was faster than the larger ones, which may explain why 5-nm AuNPs showed fewer hepatic and splenic accumulation in vivo at 24 hrs postinjection. In addition, all sized AuNPs were able to pass through the BBB. The specific mechanism underlying this phenomenon is unknown yet. It is speculated that the smaller nanoparticles extravasate easily and diffuse away from the vessels with minimal hindrance.51 Moreover, the histopathological examination demonstrated that 5-nm AuNPs induced a slight hemorrhage in liver. The results of hematological analysis showed that 5-nm AuNPs caused a significant increase of neutrophils, which is similar to the results of Gosens’ group.52 This phenomenon was accompanied with an increase of IL-6 in L02 cells, suggesting that IL-6 may promote inflammation by attracting neutrophils.
Conclusion
In summary, the uptake, cytotoxicity and in vivo biodistribution of AuNPs were size- and cell type-dependent. With the increase of particle size from 5 nm to 50 nm, the uptake of AuNPs increased in HepG2 cancer cells, but decreased in L02 normal cells. Five-nanometer AuNPs exhibited higher cytotoxicity against both HepG2 and L02 cells than 20 nm and 50 nm ones, and L02 cells seemed to be more susceptible to the cytotoxicity of AuNPs than HepG2 cells. Interestingly, 5-nm AuNPs induced both apoptosis and necrosis in HepG2 cells, with the increase of ROS production and the activation of pro-caspase3, but it mainly induced necrosis in L02 cells, with the promoted release of IL-6 and IL-1α cytokines. In vivo studies demonstrated that 50-nm AuNPs had longest blood circulation, highest uptake in the liver and spleen, while 5-nm AuNPs treatment resulted in the increase of neutrophils and mild hepatotoxicity.
Acknowledgment
The research was supported by the National Natural Science Foundation of China (81572617, 81630101), Sichuan Science and Technology Program (2019JDRC0019, 2018SZ0009), Innovation Spark Project of Sichuan University (2019SCUH0015) and 1.3.5 project for disciplines of excellence, West China Hospital, Sichuan University (ZYJC18026).
Disclosure
The authors report no conflicts of interest in this work.
References
1. Cheng C, Chen H-Y, Wu C-S, Meena JS, Simon T, Ko F-H. A highly sensitive and selective cyanide detection using a gold nanoparticle-based dual fluorescence–colorimetric sensor with a wide concentration range. Sens Actuators B Chem. 2016;227:283–290. doi:10.1016/j.snb.2015.12.057
2. Faridli Z, Mahani M, Torkzadeh-Mahani M, Fasihi J. Development of a localized surface plasmon resonance-based gold nanobiosensor for the determination of prolactin hormone in human serum. Anal Biochem. 2016;495:32–36. doi:10.1016/j.ab.2015.11.016
3. Raj DR, Prasanth S, Vineeshkumar TV, Sudarsanakumar C. Surface plasmon resonance based fiber optic sensor for mercury detection using gold nanoparticles PVA hybrid. Opt Commun. 2016;367:102–107. doi:10.1016/j.optcom.2016.01.027
4. Dixit S, Novak T, Miller K, Zhu Y, Kenney ME, Broome AM. Transferrin receptor-targeted theranostic gold nanoparticles for photosensitizer delivery in brain tumors. Nanoscale. 2015;7(5):1782–1790. doi:10.1039/c4nr04853a
5. von Maltzahn G, Park JH, Agrawal A, et al. Computationally guided photothermal tumor therapy using long-circulating gold nanorod antennas. Cancer Res. 2009;9(69):3892–3900. doi:10.1158/0008-5472.CAN-08-4242
6. Alkilany AM, Thompson LB, Boulos SP, Sisco PN, Murphy CJ. Gold nanorods: their potential for photothermal therapeutics and drug delivery, tempered by the complexity of their biological interactions. Adv Drug Deliv Rev. 2012;64(2):190–199. doi:10.1016/j.addr.2011.03.005
7. Kennedy LC, Bickford LR, Lewinski NA, et al. A new era for cancer treatment: gold-nanoparticle-mediated thermal therapies. Small. 2011;7(2):169–183. doi:10.1002/smll.201000134
8. Singh M, Harris-Birtill DC, Markar SR, Hanna GB, Elson DS. Application of gold nanoparticles for gastrointestinal cancer theranostics: a systematic review. Nanomedicine. 2015;11(8):2083–2098. doi:10.1016/j.nano.2015.05.010
9. Soenen SJ, Manshian B, Montenegro JM, et al. Cytotoxic effects of gold nanoparticles: a multiparametric study. ACS Nano. 2012;6(7):5767–5783. doi:10.1021/nn301714n
10. Lee U, Yoo CJ, Kim YJ, Yoo YM. Cytotoxicity of gold nanoparticles in human neural precursor cells and rat cerebral cortex. J Biosci Bioeng. 2016;121(3):341–344. doi:10.1016/j.jbiosc.2015.07.004
11. Chuang SML, Lee YH, Liang RY, et al. Extensive evaluations of the cytotoxic effects of gold nanoparticles. Biochim Biophys Acta. 2013;1830(10):4960–4973. doi:10.1016/j.bbagen.2013.06.025
12. Pan JF, Buffet PE, Poirier L, et al. Size dependent bioaccumulation and ecotoxicity of gold nanoparticles in an endobenthic invertebrate: the tellinid clam scrobicularia plana. Environ Pollut. 2012;168:37–43. doi:10.1016/j.envpol.2012.03.051
13. Zhang XD, Wu D, Shen X, et al. Size-dependent in vivo toxicity of PEG-coated gold nanoparticles. Int J Nanomedicine. 2011;6:2071–2081. doi:10.2147/IJN.S21657
14. Oh E, Delehanty JB, Sapsford KE, et al. Cellular uptake and fate of PEGylated gold nanoparticles is dependent on both cell-penetration peptides and particle size. ACS Nano. 2011;5(8):6434–6448. doi:10.1021/nn201624c
15. Elbakry A, Wurster EC, Zaky A, et al. Layer-by-layer coated gold nanoparticles: size-dependent delivery of DNA into cells. Small. 2012;8(24):3847–3856. doi:10.1002/smll.201201112
16. Pan Y, Neuss S, Leifert A, et al. Size-dependent cytotoxicity of gold nanoparticles. Small. 2007;3(11):1941–1949. doi:10.1002/smll.200700378
17. Liu Z, Wu Y, Guo Z, et al. Effects of internalized gold nanoparticles with respect to cytotoxicity and invasion activity in lung cancer cells. PLoS One. 2014;9(6):e99175. doi:10.1371/journal.pone.0099175
18. Devika Chithrani B, Ghazani AA, Chan WCW. Determining the size and shape dependence of gold nanoparticle uptake into mammalian cells. Nano Lett. 2006;6(4):662–668. doi:10.1021/nl052396o
19. Jiang W, Kim BY, Rutka JT, Chan WC. Nanoparticle-mediated cellular response is size-dependent. Nat Nanotechnol. 2008;3(3):145–150. doi:10.1038/nnano.2008.30
20. Hirn S, Semmler-Behnke M, Schleh C, et al. Particle size-dependent and surface charge-dependent biodistribution of gold nanoparticles after intravenous administration. Eur J Pharm Biopharm. 2011;77(3):407–416. doi:10.1016/j.ejpb.2010.12.029
21. de Jong WH, Hagens WI, Krystek P, Burger MC, Sips AJ, Geertsma RE. Particle size-dependent organ distribution of gold nanoparticles after intravenous administration. Biomaterials. 2008;29(12):1912–1919. doi:10.1016/j.biomaterials.2007.12.037
22. Lundqvist M, Stigler J, Elia G, Lynch I, Cedervall T, Dawson KA. Nanoparticle size and surface properties determine the protein corona with possible implications for biological impacts. Proc Natl Acad Sci U S A. 2008;105(38):14265–14270. doi:10.1073/pnas.0805135105
23. Jablonska E, Marcinczyk M. TLR2 expression in relation to IL-6 and IL-1βand their natural regulators production by PMN and PBMC in patients with lyme disease. Mediators Inflamm. 2006;2006(1):1–6. doi:10.1155/MI/2006/32071
24. Mrabet-Dahbi S, Metz M, Dudeck A, Zuberbier T, Maurer M. Murine mast cells secrete a unique profile of cytokines and prostaglandins in response to distinct TLR2 ligands. Exp Dermatol. 2009;18(5):437–444.
25. Delgado MA, Deretic V. Toll-like receptors in control of immunological autophagy. Cell Death Differ. 2009;16(7):976–983. doi:10.1038/cdd.2009.40
26. Chueh PJ, Liang RY, Lee YH, Zeng ZM, Chuang SM. Differential cytotoxic effects of gold nanoparticles in different mammalian cell lines. J Hazard Mater. 2014;264:303–312. doi:10.1016/j.jhazmat.2013.11.031
27. Patra HK, Banerjee S, Chaudhuri U, Lahiri P, Dasgupta AK. Cell selective response to gold nanoparticles. Nanomedicine. 2007;3(2):111–119. doi:10.1016/j.nano.2007.03.005
28. Coulter JA, Jain S, Butterworth KT, et al. Cell type-dependent uptake, localization, and cytotoxicity of 1.9 nm gold nanoparticles. Int J Nanomedicine. 2012;7:2673–2685. doi:10.2147/IJN.S31751
29. Coradeghini R, Gioria S, García CP, et al. Size-dependent toxicity and cell interaction mechanisms of gold nanoparticles on mouse fibroblasts. Toxicol Lett. 2013;217(3):205–216. doi:10.1016/j.toxlet.2012.11.022
30. Varela JA
31. Wang S-H, Lee CW, Chiou A, Pei-Kuen W. Size-dependent endocytosis of gold nanoparticles studied by three-dimensional mapping of plasmonic scattering images. J Nanobiotechnology. 2010;8:33. doi:10.1186/1477-3155-8-33
32. Gao H, Shi W, Freund LB. Mechanics of receptor-mediated endocytosis. Proc Natl Acad Sci U S A. 2005;102(27):9469–9474. doi:10.1073/pnas.0503879102
33. Moore A, Weissleder R
34. Talati R, Vanderpoel A, Eladdadi A, Anderson K, Abe K, Barroso M. Automated selection of regions of interest for intensity-based FRET analysis of transferrin endocytic trafficking in normal vs. cancer cells. Methods. 2014;66(2):139–152. doi:10.1016/j.ymeth.2013.08.017
35. Chen S, Zhao X, Chen J, et al. Mechanism-based tumor-targeting drug delivery system. validation of efficient vitamin receptor-mediated endocytosis and drug release. Bioconjug Chem. 2010;21:979–987. doi:10.1021/bc9005656
36. Xia Q, Li H, Liu Y, Zhang S, Feng Q, Xiao K. The effect of particle size on the genotoxicity of gold nanoparticles. J Biomed Mater Res A. 2017;105(3):710–719. doi:10.1002/jbm.a.35944
37. Sabella S, Carney RP, Brunetti V, et al. A general mechanism for intracellular toxicity of metal-containing nanoparticles. Nanoscale. 2014;6(12):7052–7061. doi:10.1039/c4nr01234h
38. Chithrani DB. Intracellular uptake, transport, and processing of gold nanostructures. Mol Membr Biol. 2010;27(7):299–311. doi:10.3109/09687688.2010.507787
39. Mateo D, Morales P, Avalos A, Haza AI. Oxidative stress contributes to gold nanoparticle-induced cytotoxicity in human tumor cells. Toxicol Mech Methods. 2014;24(3):161–172. doi:10.3109/15376516.2013.869783
40. Jebali A, Kazemi B. Triglyceride-coated nanoparticles: skin toxicity and effect of UV/IR irradiation on them. Toxicol In Vitro. 2013;27(6):1847–1854. doi:10.1016/j.tiv.2013.05.014
41. Raghunathan VK, Devey M, Hawkins S, et al. Influence of particle size and reactive oxygen species on cobalt chrome nanoparticle-mediated genotoxicity. Biomaterials. 2013;34(14):3559–3570. doi:10.1016/j.biomaterials.2013.01.085
42. Ramkumar KM, M C, Gnanakumar G, et al. Oxidative stress-mediated cytotoxicity and apoptosis induction by TiO2 nanofibers in HeLa cells. Eur J Pharm Biopharm. 2012;81(2):324–333. doi:10.1016/j.ejpb.2012.02.013
43. Geffroy B, Ladhar C, Cambier S, Treguer-Delapierre M, Brethes D, Bourdineaud JP. Impact of dietary gold nanoparticles in zebrafish at very low contamination pressure: the role of size, concentration and exposure time. Nanotoxicology. 2012;6(2):144–160. doi:10.3109/17435390.2011.562328
44. Choi SY, Jeong S, Jang SH, et al. In vitro toxicity of serum protein-adsorbed citrate-reduced gold nanoparticles in human lung adenocarcinoma cells. Toxicol In Vitro. 2012;26(2):229–237. doi:10.1016/j.tiv.2011.11.016
45. Wang L, Liu Y, Li W, et al. Selective targeting of gold nanorods at the mitochondria of cancer cells: implications for cancer therapy. Nano Lett. 2011;11(2):772–780. doi:10.1021/nl103992v
46. Schmid G, Kreyling WG, Simon U. Toxic effects and biodistribution of ultrasmall gold nanoparticles. Arch Toxicol. 2017;91(9):1–27. doi:10.1007/s00204-016-1805-9
47. Sumbayev VV, Yasinska IM, Garcia CP, et al. Gold nanoparticles downregulate interleukin-1beta-induced pro-inflammatory responses. Small. 2013;9(3):472–477. doi:10.1002/smll.201201528
48. Hutter E, Boridy B, Labrecque S, et al. microglial response to gold nanoparticles.pdf. ACS Nano. 2010;4(5):2595–2606. doi:10.1021/nn901869f
49. Oh N, Park JH. Endocytosis and exocytosis of nanoparticles in mammalian cells. Int J Nanomedicine. 2014;9(Suppl 1):51–63. doi:10.2147/IJN.S26592
50. Johnston HJ, Semmler-Behnke M, Brown DM, Kreyling W, Tran L, Stone V. Evaluating the uptake and intracellular fate of polystyrene nanoparticles by primary and hepatocyte cell lines in vitro. Toxicol Appl Pharmacol. 2010;242(1):66–78. doi:10.1016/j.taap.2009.09.015
51. Huang K, Ma H, Liu J, et al. Size-dependent localization and penetration of ultrasmall gold nanoparticles in cancer cells, multicellular spheroids, and tumors in vivo. ACS Nano. 2012;6(5):4483–4493. doi:10.1021/nn301282m
52. Gosens I, Post JA, de la Fonteyne LJ, et al. Impact of agglomeration state of nano- and submicron sized gold particles on pulmonary inflammation. Part Fibre Toxicol. 2010;7(1):37. doi:10.1186/1743-8977-7-37
Supplementary materials
 |
Figure S1 The stability of different sized gold nanoparticles (AuNPs) using zeta potential. The zeta potential of different sized AuNPs were measured in DD water, in DMEM with 10% fetal bovine serum for 0 h and 24 h, respectively.Abbreviation: DD, double distilled. |
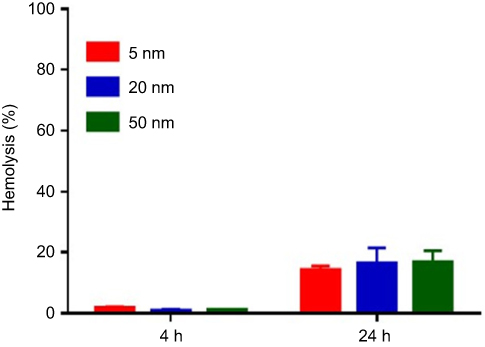 |
Figure S2 The hemolytic activities of different sized gold nanoparticles (AuNPs) were evaluated by hemolysis assay. Different sized AuNPs with the concentrations of 100 µM were incubated with mouse erythrocytes suspension at 37 °C for 4 h and 24 h, respectively. |
 © 2019 The Author(s). This work is published and licensed by Dove Medical Press Limited. The
full terms of this license are available at https://www.dovepress.com/terms
and incorporate the Creative Commons Attribution
- Non Commercial (unported, 3.0) License.
By accessing the work you hereby accept the Terms. Non-commercial uses of the work are permitted
without any further permission from Dove Medical Press Limited, provided the work is properly
attributed. For permission for commercial use of this work, please see paragraphs 4.2 and 5 of our Terms.
© 2019 The Author(s). This work is published and licensed by Dove Medical Press Limited. The
full terms of this license are available at https://www.dovepress.com/terms
and incorporate the Creative Commons Attribution
- Non Commercial (unported, 3.0) License.
By accessing the work you hereby accept the Terms. Non-commercial uses of the work are permitted
without any further permission from Dove Medical Press Limited, provided the work is properly
attributed. For permission for commercial use of this work, please see paragraphs 4.2 and 5 of our Terms.