Back to Journals » Clinical Ophthalmology » Volume 14
Sensitive Detection of Therapeutic Efficacy with the ETDRS Diabetic Retinopathy Severity Scale
Authors Zhang J, Strauss EC
Received 13 October 2020
Accepted for publication 2 December 2020
Published 16 December 2020 Volume 2020:14 Pages 4385—4393
DOI https://doi.org/10.2147/OPTH.S286527
Checked for plagiarism Yes
Review by Single anonymous peer review
Peer reviewer comments 3
Editor who approved publication: Dr Scott Fraser
Jiameng Zhang, Erich C Strauss
Early Clinical Development, Genentech, Inc, South San Francisco, CA, USA
Correspondence: Jiameng Zhang
Genentech, Inc., 1 DNA Way, South San Francisco, CA 94080, USA
Email [email protected]
Background: The Early Treatment Diabetic Retinopathy Study Diabetic Retinopathy Severity Scale (DRSS) is a standard approach to measure diabetic retinopathy (DR) severity. Many clinical trials evaluating drug intervention for DR rely upon demonstration of a therapeutic effect through measurement of a 2- or 3-step improvement or progression on the DRSS; however, these binary endpoints require a relatively large sample size for a reliable estimate of therapeutic efficacy, especially when the SOC (eg, anti-VEGF) is used as a control. This study was designed to evaluate the sensitivity and statistical efficiency of detecting a drug effect in DR across different DRSS endpoints, and present alternative analytical approaches to enable smaller-size DR trials for detecting a reliable efficacy signal before moving into larger confirmatory DR trials.
Methods: Data from two randomized, double-blinded, controlled Phase III trials, that enrolled patients with decreased vision due to center-involved DME and the presence of macular edema documented on optical coherence tomography and simulated data, were used for this study. Changes in DRSS steps during a 3-month period from patients (n=205) with no active intervention were used to confirm the reliability of DRSS outcomes. A simulation study compared sensitivity and statistical efficiency across different DRSS endpoints.
Results: The standard deviation of step change between baseline and month 3 DRSS across different steps at baseline were all within 1 step, confirming the reliability of DRSS measure by each step. Efficiency of detecting reliable therapeutic efficacy was augmented when treatment effect in improvement and progression was evaluated together; highest sensitivity was observed when change in DRSS steps was used directly as an endpoint.
Conclusion: DRSS step change may provide more robust sensitivity and statistical efficiency. It is therefore a more cost-effective endpoint for the detection of therapeutic efficacy signal in drug discoveries in DR.
Keywords: diabetic retinopathy, Diabetic Retinopathy Severity Scale, anti-VEGF, diabetes
Background
Diabetic retinopathy (DR), a common microvascular complication of diabetes, is the leading cause of new cases of vision impairment and blindness in working-aged adults from developed countries.1–3 Worldwide, the prevalence of DR is approximately 35% in patients with diabetes.4 DR is a chronic disease, with the onset of vision-threatening sequelae rising over time. Patients are diagnosed with type 2 diabetes mellitus at younger ages with increasing frequency. Together, these observations strongly suggest that the number of patients with DR and profound vision impairment consequent to complication of the disease is anticipated to increase significantly in the near future. For example, in the United States, a recent report indicated an 89% increase in the number of patients with DR from 2000 to 2010.5 Of note, the majority of patients with DR, approximately 65 million worldwide, have pre-vision-threatening stages of DR.6 Consequently, therapeutic interventions that may mitigate disease progression to vision-threatening stages would address a significant unmet medical need.
In clinical trials, the severity of a subject’s retinopathy over time can be categorized into discrete steps on the well-validated Early Treatment Diabetic Retinopathy Study Diabetic Retinopathy Severity Scale (DRSS).7,8 The DRSS is based on grading of fundus stereo photographs of 7 fields, and classifies DR per eye into 13 complex levels, ranging from absence of retinopathy to severe vitreous hemorrhage or retinal detachment involving the macula. The masked grading of fundus stereo photographs has proven to be a reliable and reproducible assessment for DR progression. For example, in the Diabetes Control and Complications Trial (DCCT) quality control exercises, which included random regrading of fundus photographs, grading agreements for the seven timepoints included 66.0% complete agreement, 91.7% agreement within 1 step, and 94.9% agreement within 2 steps.9 The association of progressive steps on the DRSS with increased risk of vision loss over time has been well defined;10 with each advancing step on the DRSS, the risk of vision loss over time from macular edema and/or proliferative disease rises significantly.11,12 The anatomic changes, as documented by the DRSS, have also been validated as predictive of meaningful (ie, 3-line) visual acuity loss over time.13 In patients with diabetic macular edema (DME) who were treated with ranibizumab (RBZ), 1-, 2-, and 3-step or more improvement were associated with a mean 11.3-, 14.2-, and 15.1-letter increase in best-corrected visual acuity from baseline.12
Drug discovery in DR relies on clinical trials due to the challenges in establishing reliable preclinical DR experimental models that can predict potential efficacy in human. Clinical trials evaluating drug effect in DR have often been performed by comparing success-failure binary endpoints as defined by the following cutoffs: 2-step or more progression, 3-step or more progression, 2-step or more improvement, and 3-step or more improvement. Although demonstrating robust efficacy in these endpoints is required for health regulatory approval of new DR treatments, large clinical trials are required to enable a reliable efficacy estimate from these endpoints, which is not always feasible in early drug discovery. Therefore, finding more sensitive and cost-effective endpoints is critical for drug discovery in DR. Results from this study showed that improved trial efficiency may be achieved by utilizing more efficient analytic approaches for DRSS outcomes through comparing progression and improvement simultaneously, by either combining the binary endpoints or using change in DRSS steps directly.
Methods
Data from two randomized, double-blinded, controlled phase III trials (RIDE and RISE) and simulated data were used for this study. RIDE and RISE (ClinicalTrials.gov identifiers, NCT00473382 and NCT00473330) are two methodologically identical, Phase III, randomized, multicenter, double-masked, 3-year trials that enrolled 759 patients with decreased vision due to center-involved DME and the presence of macular edema documented on optical coherence tomography. These trials were conducted in compliance with the tenets of the Declaration of Helsinki. Independent ethics committees or institutional review boards approved the RIDE and RISE trials, and all patients provided written informed consent before enrollment, which extended to the use of individual patient data for further analyses.
Patients received monthly sham or RBZ (0.3 or 0.5 mg) injections in the study eye, for the first 2 years. Details of the methods and key visual acuity, DR severity, and safety findings have been previously described.14,15 Briefly, stereoscopic seven-field color fundus photographs were obtained at baseline and months 3, 6, 12, 18, and 24 and were graded by masked evaluators at an independent reading center (the University of Wisconsin Fundus Photograph Reading Center). DRSS steps were graded according to a 9-step DRSS7,14 using summary grading, in which the evaluator reviewed all fields and then assigned the grade based on the most severe lesion(s). Two hundred and five study eye outcomes from the sham group at screening and month 3 were used to evaluate the reliability of DRSS outcomes. Data from eyes with laser treatment were excluded. RIDE and RISE data were pooled for the analysis. Numbers of the patients with completed agreed, 1-step difference and two-step difference in DRSS outcome at screen and month 3 are summarized to describe the measurement error from imaging and grading.
For evaluation of sensitivity and statistical efficiency in detecting therapeutic effect, the changes in DRSS steps from baseline to month 24 in sham and RBZ 0.3 mg were used for simulating data. Multinomial distribution was used to simulate DRSS outcomes. Three groups of data with DRSS outcomes were simulated. The first group projected DRSS outcome (eg the % of patients in each of the DRSS outcomes categories) from the sham group in RIDE and RISE. The second group projected DRSS outcome from the RBZ 0.3 mg group in RIDE and RISE. The third group, subsequently referred to as the active control group, consisted of DRSS outcomes simulated to be superior to RBZ 0.3 mg, with most of the superiority driven by improvement rate due to very low progression rate in the RBZ 0.3 mg group (+5% in percentage with ≥3-step improvement; +8% in percentage with ≥2-step improvement; –0.4% in percentage with ≥3-step progression; –0.6% in percentage with ≥2-step progression). We refer to these three groups as the sham, RBZ, and active control groups, respectively. The efficiency of binary and ordinal endpoints in detecting therapeutic effect were evaluated through the power of detecting a significant therapeutic effect for a fixed sample size of 100 per group as well as through the sample size needed to achieve an 80% power, both at a statistical significant level of 0.05. (Table 1). For binary endpoints Pearson chi-square test was used for testing the therapeutic effect. For ordinal endpoints with more than two categories, Wilcoxon rank-sum test was used for testing the therapeutic effect.
 |
Table 1 List of DRSS Endpoints |
Results
Reliability of DRSS Outcome
A total of 205 patients who had no active intervention between baseline and month 3 were evaluated. Figure 1 shows DRSS steps at baseline and Figure 2 illustrates change in DRSS steps from baseline to month 3. Among the 205 study patients, the majority (66.8%) maintained their DRSS, 95.2% agreed within 1 step, and 99.0% agreed within 2 steps from baseline to month 3. Less than 1% of patients had 3-step or more changes, indicating that the chance of a more than 2-step measurement error was very rare. The mean change of DRSS level was –0.03, with a standard deviation (SD) of 0.75. As shown in Figure 3, the SDs of change across different steps at baseline were all within 1 step, with the largest SD (0.89) observed for patients with baseline DRSS step 8 (DR severity level 65A–65C; moderate proliferative DR [PDR]).
 |
Figure 1 Early Treatment Diabetic Retinopathy Study Diabetic Retinopathy Severity Scale (DRSS) steps at baseline for patients with no active intervention. 1 = diabetic retinopathy (DR) severity level 10, 12 (DR absent); 2 = DR severity level 14A–14C, 14Z, 15, 20 (DR questionable, microaneurysms only); 3 = DR severity level 35A–35F (mild nonproliferative DR [NPDR]); 4 = DR severity level 43A, 43B (moderate NPDR); 5 = DR severity level 47A–47D (moderately severe NPDR); 6 = DR severity level 53A–53E (severe NPDR); 7 = DR severity level 60, 61A, 61B (mild proliferative DR [PDR]); 8 = DR severity level 65A–65C (moderate PDR); 9 = DR severity level 71A–71D (high-risk PDR).Note: the full range of outcome of DRSS is 1-12; however, there is no data from RIDE and RISE for 10 and 12 which are not shown. |
 |
Figure 2 Change in Early Treatment Diabetic Retinopathy Study Diabetic Retinopathy Severity Scale (DRSS) steps from baseline to month 3 for patients with no active intervention. |
 |
Figure 3 Standard deviation of change in Early Treatment Diabetic Retinopathy Study (ETDRS) Diabetic Retinopathy Severity Scale (DRSS) steps from baseline to month 3 by baseline DRSS. 1 = diabetic retinopathy (DR) severity level 10, 12 (DR absent); 2 = DR severity level 14A–14C, 14Z, 15, 20 (DR questionable, microaneurysms only); 3 = DR severity level 35A–35F (mild nonproliferative DR [NPDR]); 4 = DR severity level 43A, 43B (moderate NPDR); 5 = DR severity level 47A–47D (moderately severe NPDR); 6 = DR severity level 53A–53E (severe NPDR); 7 = DR severity level 60, 61A, 61B (mild proliferative DR [PDR]); 8 = DR severity level 65A–65C (moderate PDR).Note: data are available from RIDE and RISE for 1, and 9-12 given incomplete data. |
Sensitivity and Statistical Efficiency
To evaluate sensitivity and statistical efficiency of different DRSS endpoints, we simulated data for three groups mimicking the DRSS outcome from the sham group, RBZ 0.3 mg group from RIDE and RISE, and an active control group with better DRSS outcome than that of RBZ 0.3mg group in RIDE and RISE. Figure 4 shows the distribution of change in DRSS steps for the simulated data. Table 2 shows the power of achieving a statistical significant result at alpha = 0.05 level for a sample size of 100 patients per treatment arm, as well as the sample size needed to achieve 80% power. Although the therapeutic effect is robust between the RBZ and sham groups, the power of achieving a significant result in percentage with 3-step or more progression is quite low. To detect a significant therapeutic effect between RBZ and the active control, a much larger sample size is required. Overall, using a 2-step cutoff improves analysis efficiency compared with a 3-step cutoff. Moreover, endpoints classifying patients into progression, no change, or improvement categories can improve analysis efficiency compared with using binary outcomes (eg, yes/no for progression or improvement). The most substantial improvement in sensitivity and efficiency observed was the reduction of sample size by 3- to 10-fold when change in DRSS steps was analyzed directly without further grouping.
 |
Table 2 Power of Detecting Significant Treatment Effect in DR for a Sample Size of 100 per Arm at Two-Sided Alpha = 0.05 and the Sample Size Needed to Achieve 80% Power Based on the Simulated Data Whose Distributions of DR Outcome are Displayed in Figure 4 |
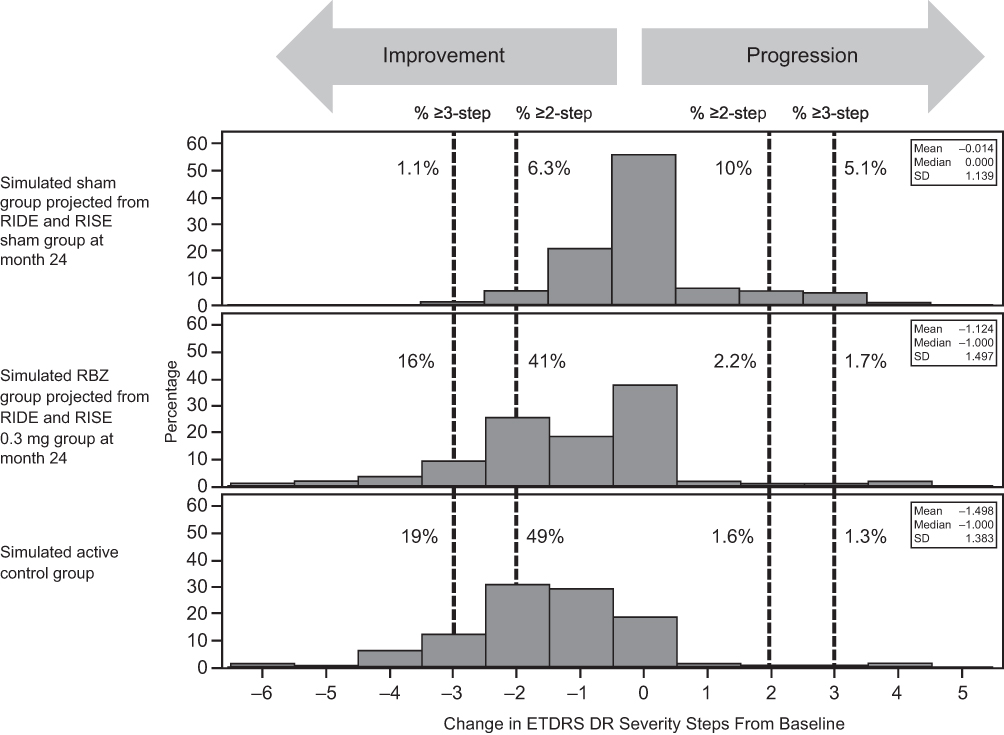 |
Figure 4 Distribution of simulated Early Treatment Diabetic Retinopathy Study (ETDRS) Diabetic Retinopathy Severity Scale outcomes. Abbreviations: DR, diabetic retinopathy; M, month; RBZ, ranibizumab; SD, standard deviation. |
Discussion
The DRSS step is an ordinal outcome that ranges from no retinopathy, microaneurysms only, mild nonproliferative DR (NPDR), moderate NPDR, moderately severe NPDR, severe NPDR, mild PDR, moderate PDR, and high-risk PDR, with assigned steps according to 9 level scaling. Change from baseline in DRSS step remains ordinal, with range from negative (indicating improvement) to positive (indicating progression). The high reliability of DRSS outcomes in terms of grading has been demonstrated by a DCCT quality control exercise.9 In this study, data from 205 patients with DME showed very similar reliability of DRSS using reimagined and regraded DRSS data with a 3-month interval (66.8% complete agreement, 95.2% agreed within 1 step, and 99.0% agreed within 2 steps) as that from a DCCT quality control exercise through random regrading only (66.0% complete agreement, 91.7% agreement within 1 step, and 94.9% agreement within 2 steps). Moreover, this study showed that the typical random deviation of change in DRSS step is within 1 step, further reassured the reliability of this measure in step changes.
DR clinical trials have relied upon binary endpoints with a prespecified success-failure criterion (eg, classifying each subject’s DR outcome into one of the two categories based on whether or not there was a 2- or 3-step or more progression, or classifying each subject’s DR outcome into one of the two categories based on whether or not there was a 2- or 3-step or more improvement). A chi-square or similar statistical test is performed to compare percentage of progression or improvement between groups separately. Such statistical approaches are not optimal in detecting therapeutic effect because only partial information from a dataset is used in the test. For example, when a percentage of patients with 3-step or more progression is compared between groups, the information related to a difference in 2-step progression or improvement between these groups is ignored. Moreover, a binary outcome fails to consider detailed information regarding the magnitude of improvement or progression. For example, when 3-step or more improvement is used, patients with 3-, 4-, and 5-step improvement will all be considered as having the same outcome. In general, analysis of ordinal outcome using a binary endpoint could have low statistical efficiency, and the reduction in efficiency reflects the portion of information from the dataset that is used.
The incomplete use of information from a dataset with binary endpoints for ordinal outcome could be minimal in some specific circumstances; for example, the change can only go in one direction (ie, either progression or improvement but not both), or the drug effect will occur in only one direction (ie, either preventing progression or promoting improvement but not both). However, the RIDE and RISE interventional trial results have shown that both DR progression and improvement are possible outcomes and an intervention could have the effect of both reducing the risk of DR progression and enhancing the opportunity for DR improvement. Even though binary endpoints will still be used for confirming and interpreting a study drug effect, these results raise the question of the suitability of using a binary primary endpoint for detection of the therapeutic effect in early stage DR drug development. In contrast, combining the commonly used progression/improvement outcome into the same endpoint will use more information from a dataset in one test (eg, classifying the patients into ≥3-step progression, change within 2 steps, and ≥3-step improvement). This ordinal endpoint with three categories will augment the use of the information from the dataset compared with testing 3-step or more progression and 3-step or more improvement separately, therefore increase the sensitivity of detecting an efficacy signal, which is critical when the trial size is relatively small.
To further augment the use of the information from the dataset, steps change in DRSS can be used directly in the analysis since a 1-step change in DRSS is regarded as clinically meaningful.11 A potential issue related to directly using change in steps is that the chance to see a 1-step change caused by measurement error is relatively higher compared with that from a change with a requirement of more than 1 step. However, based on the independent reliability results from DCCT and this study the measurement error of DRSS outcome is pretty low – the chance of observing a 3-step or more change by random chance is about 1%, and the chance of observing a 2-step or more change with random chance is less than 5%. Moreover, the impact of measurement error on study drug effect testing can be controlled through a rigorous statistical analysis approach (ie, type I error control; usually requiring P-value <0.05). The drawback of using an endpoint with relatively high measurement error is a reduction of statistical efficiency (ie, large sample size required to identify a true treatment effect). However, the loss of efficiency by using 1-step change due to higher measurement error is much smaller than the loss of efficiency of using 2- or 3-step or more change, which only uses partial information from the dataset. This conclusion is supported by the simulation in which the highest overall statistical efficiency, which is impacted by both measurement error and portion of information from the data used in analysis, is achieved when the change in steps is used directly as an analysis endpoint.
With significant effect of anti–VEGF treatment on DR, it seems improbable that a sham control group will be included in future study designs for DR treatment trials. Consequently, it is anticipated that large sample sizes will be needed to power a study to detect a reliable study drug effect with an anti–VEGF control group. However, by using a DR endpoint with better overall statistical efficiency for the primary analysis, such as change in DRSS steps, the sample size may be reduced substantially and the sensitivity of detecting therapeutic effect increased. The commonly used binary endpoints should be used as supportive endpoints to assist efficacy interpretation, if an efficacy signal is detected by ordinal endpoint.
Abbreviations
DCCT, Diabetes Control and Complications Trial; DR, diabetic retinopathy; DRSS, Diabetic Retinopathy Severity Scale; NPDR, nonproliferative DR; RBZ, ranibizumab.
Data Sharing Statement
Qualified researchers may request access to individual patient level data through the clinical study data request platform (https://vivli.org/). Further details on Roche’s criteria for eligible studies are available here (https://vivli.org/members/ourmembers/). For further details on Roche’s Global Policy on the Sharing of Clinical Information and how to request access to related clinical study documents, see here (https://www.roche.com/research_and_development/who_we_are_how_we_work/clinical_trials/our_commitment_to_data_sharing.htm).
Ethical Approval and Consent to Participate
The study was conducted in accordance with the principles of the Declaration of Helsinki, the International Conference on Harmonization E6 Guidelines, and the principles of Good Clinical Practice. Approval from the institutional review boards and ethics committees (Supplemental File) was obtained before study start. The studies were registered at Clinicaltrials.gov (NCT00473382 and NCT00473330). This study was sponsored by Genentech, Inc. Patient consent was obtained before enrollment.
Consent for Publication
All participants were provided with the informed consent form at trial enrollment. The informed consent was clear, indicated the purpose of this study, and detailed the right of the participant to withdraw at any time without any obligation to the study team.
Acknowledgment
Funding was provided by Genentech, Inc., a member of the Roche Group. We thank the patients and their families who took part in the study, as well as the staff, research coordinators, and investigators at each participating institution.
Author Contributions
All authors made a significant contribution to the work reported, whether that is in the conception, study design, execution, acquisition of data, analysis and interpretation, or in all these areas; took part in drafting, revising or critically reviewing the article; have agreed on the journal to which the article will be submitted; reviewed and agreed on all versions of the article before submission, during revision, the final version accepted for publication, and any significant changes introduced at the proofing stage; and agree to take responsibility and be accountable for the contents of the article.
Funding
This work was supported by Genentech, Inc.
Disclosure
J.Z. and E.C.S. are employees of Genentech, Inc., and shareholders of F. Hoffmann La Roche, Ltd. The authors report no other conflicts of interest in this work.
References
1. Klein BE. Overview of epidemiologic studies of diabetic retinopathy. Ophthalmic Epidemiol. 2007;14:179–183.
2. Ciulla TA, Amador AG, Zinman B. Diabetic retinopathy and diabetic macular edema: pathophysiology, screening, and novel therapies. Diabetes Care. 2003;26:2653–2664.
3. Centers for Disease Control and Prevention. Blindness and vision impairment. Available from: https://www.cdc.gov/healthcommunication/toolstemplates/entertainmented/tips/Blindness.html.
4. Yau JW, Rogers SL, Kawasaki R, et al. Meta-Analysis for Eye Disease (META-EYE) Study Group. Global prevalence and major risk factors of diabetic retinopathy. Diabetes Care. 2012;35(3):556–564.
5. National Eye Institute. Diabetic retinopathy defined. Available from: https://nei.nih.gov/eyedata/diabetic. Accessed June 7, 2015.
6. Lee R, Wong TY, Sabanayagam C. Epidemiology of diabetic retinopathy, diabetic macular edema and related vision loss. Eye Vis (Lond). 2015;2:17.
7. Early Treatment Diabetic Retinopathy Study Research Group. Grading diabetic retinopathy from stereoscopic color fundus photographs—an extension of the modified Airlie House classification. ETDRS report number 10. Ophthalmology. 1991;98:786–806.
8. Early Treatment Diabetic Retinopathy Study Research Group. Fundus photographic risk factors for progression of diabetic retinopathy. ETDRS report number 12. Ophthalmology. 1991;98:823–833.
9. Lorenzi GM, Braffett BH, Arends VL, et al. DCCT/EDIC Research Group. Quality control measures over 30 years in a multicenter clinical study: results from the Diabetes Control and Complications Trial/Epidemiology of Diabetes Interventions and Complications (DCCT/EDIC) study. PLoS One. 2015;10:e0141286.
10. Nathan GM, Genuth S, Lachin J, et al. Diabetes Control and Complications Trial Research Group. The effect of intensive treatment of diabetes on the development and progression of long-term complications in insulin-dependent diabetes mellitus. N Engl J Med. 1993;329:977–986.
11. Klein R, Klein BE, Moss SE. How many steps of progression of diabetic retinopathy are meaningful? The Wisconsin Epidemiologic Study of Diabetic Retinopathy. Arch Ophthalmol. 2001;119:547–553.
12. Ip MS, Zhang J, Ehrlich JS. The clinical importance of changes in Diabetic Retinopathy Severity Score. Ophthalmology. 2017;124:596–603.
13. Csaky KG, Richman EA, Ferris FL. 3rd. Report from the NEI/FDA ophthalmic clinical trial design and endpoints symposium. Invest Ophthalmol Vis Sci. 2008;49(2):479–489.
14. Ip MS, Domalpally A, Hopkins JJ, Wong P, Ehrlich JS. Long-term effects of ranibizumab on diabetic retinopathy severity and progression. Arch Ophthalmol. 2012;130:1145–1152.
15. Nguyen QD, Brown DM, Marcus DM, et al. Ranibizumab for diabetic macular edema: results from 2 phase III randomized trials: RISE and RIDE. Ophthalmology. 2012;119(4):789–801.
 © 2020 The Author(s). This work is published and licensed by Dove Medical Press Limited. The
full terms of this license are available at https://www.dovepress.com/terms
and incorporate the Creative Commons Attribution
- Non Commercial (unported, 3.0) License.
By accessing the work you hereby accept the Terms. Non-commercial uses of the work are permitted
without any further permission from Dove Medical Press Limited, provided the work is properly
attributed. For permission for commercial use of this work, please see paragraphs 4.2 and 5 of our Terms.
© 2020 The Author(s). This work is published and licensed by Dove Medical Press Limited. The
full terms of this license are available at https://www.dovepress.com/terms
and incorporate the Creative Commons Attribution
- Non Commercial (unported, 3.0) License.
By accessing the work you hereby accept the Terms. Non-commercial uses of the work are permitted
without any further permission from Dove Medical Press Limited, provided the work is properly
attributed. For permission for commercial use of this work, please see paragraphs 4.2 and 5 of our Terms.