Back to Journals » ClinicoEconomics and Outcomes Research » Volume 11
Relative value assessment: characterizing the benefit of oncology therapies through diverse survival metrics from a US perspective
Authors Macaulay R ![]() , Ahuja A, Ademisoye E, Juarez-Garcia A, Shaw JW
, Ahuja A, Ademisoye E, Juarez-Garcia A, Shaw JW ![]()
Received 23 June 2018
Accepted for publication 29 October 2018
Published 19 March 2019 Volume 2019:11 Pages 199—219
DOI https://doi.org/10.2147/CEOR.S177343
Checked for plagiarism Yes
Review by Single anonymous peer review
Peer reviewer comments 3
Editor who approved publication: Professor Samer Hamidi
Video abstract presented Richard Macaulay.
Views: 149
Richard Macaulay,1 Amit Ahuja,2 Ebenezer Ademisoye,1 Ariadna Juarez-Garcia,3 James W Shaw4
1PAREXEL Access Consulting, London, UK; 2PAREXEL Access Consulting, Union Territory of Chandigarh, India; 3Bristol-Myers Squibb, Mexico City, Mexico; 4Bristol-Myers Squibb, Princeton, NJ, USA
Objectives: The introduction of innovative, high-cost oncology treatments, coupled with mounting budgetary pressures, necessitates value trade-offs across cancer types. Defining value is critical to informing decision-making. A cost-value analysis tool was used to assess relative clinical value from a US perspective using multiple outcome metrics for a variety of metastatic cancers.
Methods: Literature published (January 1, 2000–August 31, 2016) was reviewed to identify outcome metrics for approved treatments for metastatic cancers. Data were extracted or derived for median and mean overall survival (OS), landmark survival rates, and other survival metrics, and compared across treatments vs their respective trial comparators, with and without considering costs.
Results: Reported survival metrics varied by agent within cancer type. For treatment of prostate cancer, abiraterone yielded the highest improvement in 1-year survival rate (13.7%, previously treated), whereas enzalutamide yielded the highest median OS improvement (4.8 months, previously treated) and sipuleucel-T, the highest mean OS improvement (3.6 months, previously untreated) vs their respective trial comparators. For treatment of non-small cell lung cancer vs their respective trial comparators, nivolumab yielded the highest improvement in mean OS (11.9 months) and 3-year survival rate (12.6%), each in previously treated squamous disease, whereas afatinib yielded the highest median OS improvement (4.1 months, previously untreated EGFR del19 and L858R mutants). Cost-value analysis results varied with the applied survival metric.
Conclusions: Although median OS is the traditional gold standard oncology efficacy metric, it fails to capture long-term survival benefits—the ultimate goal of cancer treatment—offered by new treatment modalities. Diverse metrics are needed for comprehensive value assessments of cancer therapies.
Keywords: value framework, value assessment, immuno-oncology, cost-value analysis
Plain language summary
The efficacy of a cancer therapy is traditionally measured by median overall survival (OS; the time point at which half of the patients receiving therapy have died). However, newer therapies such as immuno-oncology agents have shown long-term survival benefits in some patients that are not adequately captured by median OS. We reviewed survival outcomes in pivotal clinical trials for therapies approved for metastatic cancers in the US between January 1, 2000 and August 31, 2016.
Improvements in median OS, average OS and landmark survival (the proportion of patients alive after receiving therapy for a specific time) with approved therapies were assessed relative to trial comparator arms. Relative clinical value was considered by applying the total cost of therapy per patient to the relative survival improvements.
Survival advantage and relative value of approved agents differed depending on the survival metric assessed. Median OS may undervalue treatments that provide long-term survival benefit, and average OS and landmark survival may provide more accurate measures of such long-term survival. When assessing the value of oncology therapies, decision-makers should consider a diverse range of oncology survival metrics.
Introduction
Substantial unmet needs remain in cancer, and long-term survival continues to be an elusive goal for most patients with advanced cancer.1 Further complicating treatment goals are the continually rising costs associated with cancer care, which are outpacing other types of healthcare costs.2,3 A variety of factors are driving the budgetary impact of cancer care, including increasing incidence with a growing and aging population,4,5 a shift toward more costly personalized care,4 increased cancer survivorship,5–7 and increasing availability and adoption of new branded therapies.8,9
Against this backdrop of increasing cancer incidence and healthcare costs, many healthcare budget holders are facing mounting pressure to control costs while funding optimal care for a growing population.10 Value trade-offs across cancer types are, thus, becoming increasingly important in resource allocation decision-making. Defining value is critical in determining what treatments should be reimbursed. Each stakeholder group (patients, caregivers, physicians, and payers) defines the value of cancer treatment differently, resulting in an ongoing debate and a lack of agreement regarding the meaning of value.3,11 Oncology treatment guidelines generally do not account for treatment costs. Nevertheless, multiple traditionally cost-agnostic provider organizations have created “scorecard”-based frameworks to define the value of oncology treatments, including the American Society of Clinical Oncology (ASCO),12,13 the European Society for Medical Oncology (ESMO),14 and the Memorial Sloan Kettering Cancer Center (MSKCC).15 As of 2015, National Comprehensive Cancer Network (NCCN) guidelines have included Evidence Blocks, a visual representation for each agent or regimen of five key value measures, one of which is affordability. The Institute for Clinical and Economic Review has also incorporated economic analyses, but, like the NCCN Evidence Blocks, these use an expert panel-driven rather than a scorecard approach. These initiatives demonstrate increasing concern over escalating healthcare costs.
One challenge in assessing value is identifying the appropriate efficacy metrics. Traditional “gold-standard” efficacy metrics such as median overall survival (OS) or progression-free survival (PFS) focus on a single point, where 50% of the population has had an event. Thus, they are not well suited to reflect the long-term survival benefits of new treatment modalities, such as immuno-oncology agents, which demonstrate prolonged survival in a proportion of patients.16 Despite this, several common value frameworks utilize median OS as a key driver of value scoring. To capture long-term survival benefits, and thus assess the full value of newer treatment modalities, there is a need to report and evaluate nontraditional efficacy endpoints such as landmark and mean OS.17,18
The objectives of this study were to: 1) compare the value of approved oncology agents, in particular new immuno-oncology agents, as assessed by a variety of efficacy metrics vs median OS, within and between tumor types and 2) apply a recently developed relative value assessment (RVA) tool for conducting both outcomes assessments and cost-value analyses.19 These analyses were conducted from a US perspective. Application of the RVA tool to clinical trial data may be useful in assessing managed care decision-making.
Methods
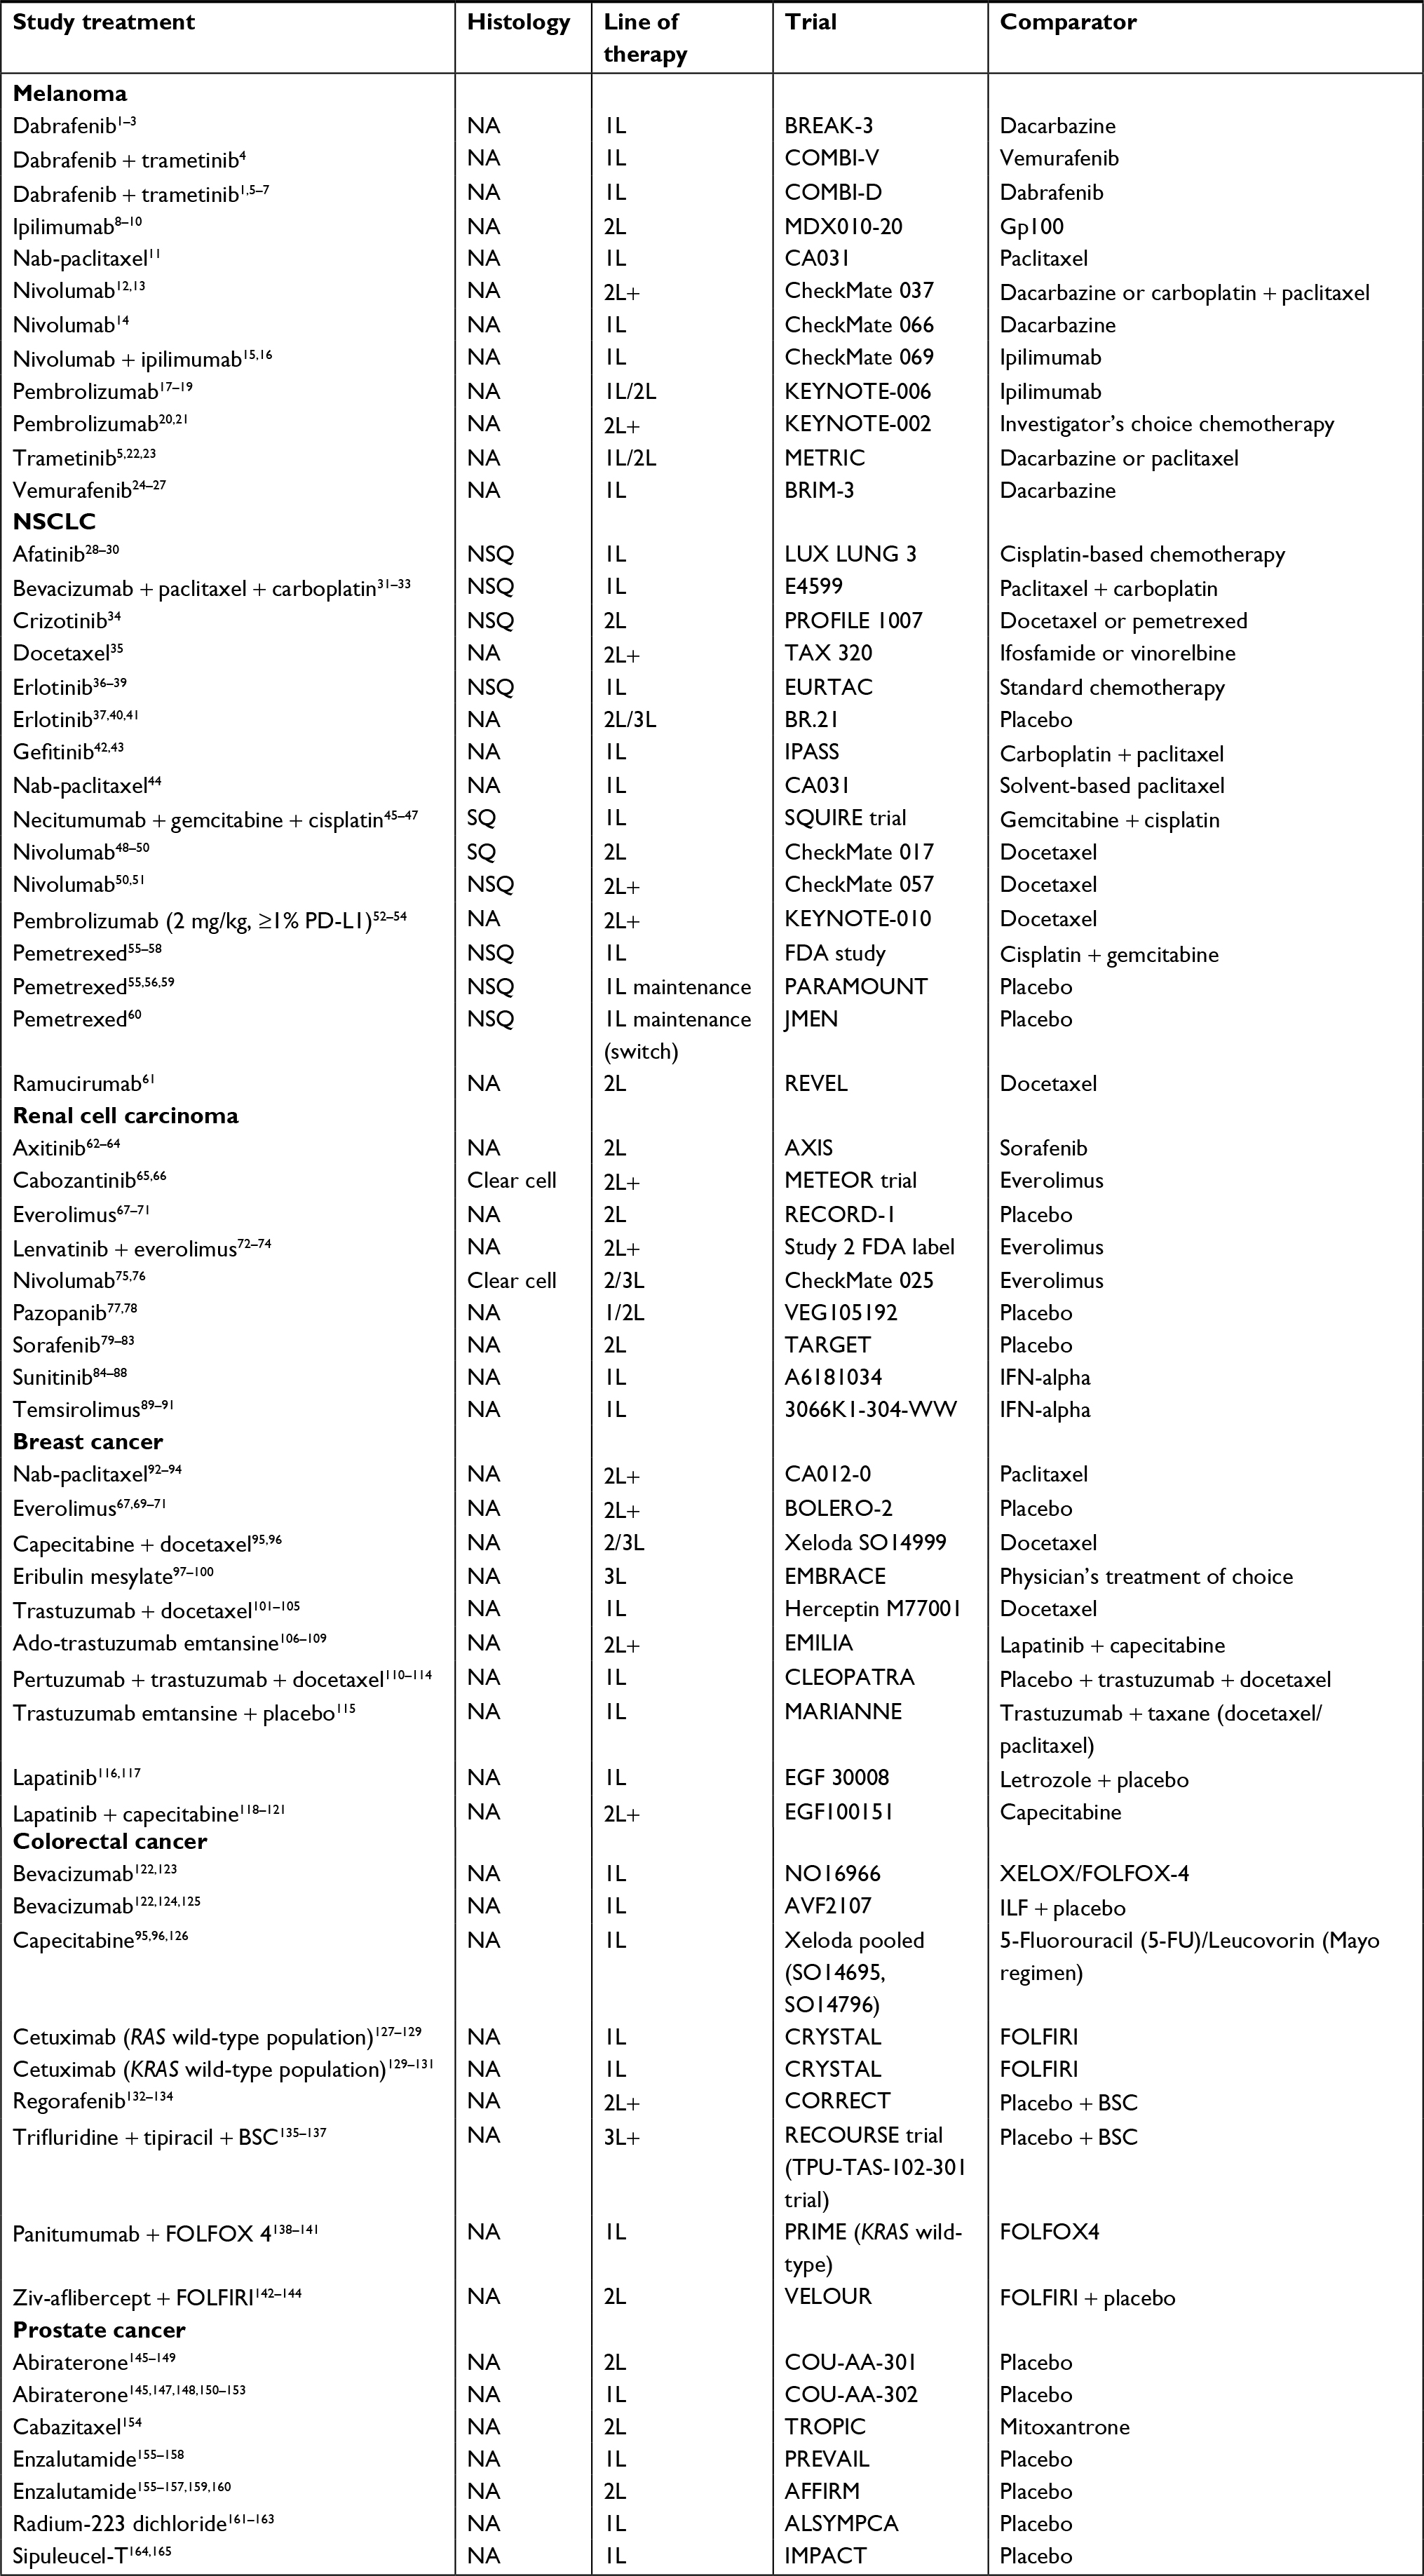
This analysis included any therapy approved by the US Food and Drug Administration (FDA) between January 1, 2000 and August 31, 2016, inclusive, for the treatment of stage III/IV of the following cancers: breast cancer, bladder cancer, colorectal cancer (CRC), lymphomas, gastric cancer, glioblastoma multiforme, hepatocellular carcinoma, myelodysplastic syndromes, melanoma, multiple myeloma, non-small cell lung cancer (NSCLC), prostate cancer, renal cell carcinoma (RCC), small cell lung cancer, and squamous cell carcinoma of the head and neck. Single-arm trials were excluded, as survival metrics were evaluated for each drug vs its direct trial comparator. Two kinds of subanalyses were performed: within-tumor analyses and pan-tumor analyses. The within-tumor analyses focused on NSCLC and prostate cancer, as these reflect common cancers, for which baseline survival rates are among the lowest and highest, respectively, across all cancers.20 The pan-tumor analyses included a selection of tumor types identified as the most common causes of cancer-related deaths in the US (breast cancer, CRC, melanoma, NSCLC, and RCC).20
Survival metrics
For each agent and its indicated tumor type (prostate, NSCLC, breast cancer, melanoma, RCC, and CRC), survival metrics were obtained from FDA product labels and European Medicines Agency (EMA) Public Assessment Reports, or relevant clinical trial publications in cases where these were not in the FDA label or EMA Public Assessment Report (see Table S1). Kaplan–Meier (KM) OS curves were extracted and digitized using the Engauge software package (http://markummitchell.github.io/engauge-digitizer/), allowing for the calculation of mean OS (calculated as the area under the KM curve) and landmark survival at 1, 2, and 3 years for each agent and tumor type. After extracting survival metrics, the difference between an intervention and its trial comparator was calculated.
A confounding factor in the calculation of mean OS is the maturity of data cutoff, which may particularly disadvantage newer agents that have less mature OS data available, particularly those that provide long-term OS benefits. To address this, KM OS curves were digitized, and reconstructed individual patient-level data were generated based on the code from Guyot et al.21 Parametric distributions, including spline models, were fitted to the reconstructed individual patient-level data to provide extrapolation beyond reported cutoffs at 15 years. The parametric curve with the best fit was determined by goodness-of-fit statistics; specifically, those with the lowest Akaike information criterion were chosen and then the visual best fit was used to validate this selection. A 15-year cutoff was used for all extrapolated curves; an assumption was that at the end of year 15 survival would be 0%. Mean OS and landmark survival were recalculated using this extrapolated curve set for therapies in melanoma, RCC, and NSCLC (see Table S2), which were the first three approved indications of immuno-oncology agents.
Cost-value analyses
In addition to calculating survival metrics, relative clinical value across tumor types (breast cancer, melanoma, NSCLC, RCC, and CRC) was assessed in cost-value analyses using the RVA tool by plotting total drug cost vs a given survival outcome. Calculation of total drug costs was based on monthly costs multiplied by therapy duration, as noted by data in the product label, determined based on median duration of administration, median PFS, or median time to progression, ranked in descending order of preference, as available. Loading dose for applicable agents, as indicated by the product label, was also incorporated into total cost. Total drug costs were obtained from the IHS Markit Life Sciences PharmOnline International database.22 All costs are expressed in US dollars.
For all therapies with available data, the relative value of each product for a given clinical metric was assessed against average value as determined by a regression line calculated from the distribution of the cost-to-outcome ratio as represented by total drug cost (x-axis) vs one of the clinical metrics (y-axis). A value of zero was assigned to the regression line intercept to standardize disease progression across the different evaluated metrics, which then could be used to identify products that could be considered “above average value” (falling above the line) or “below average value” (falling below the line) using those metrics.
Comparisons of cost-value within a single metric were undertaken using a “relative additional patients alive at 1 year per dollar spent” metric, calculated based on reported cutoffs from each drug’s pivotal trial for NSCLC. The cost of avoiding death at 1 year was calculated by multiplying the number needed to treat to avoid a death at 1 year by the per-patient treatment cost. This number was inverted to calculate the number of additional patients alive at 1 year per dollar spent. The agent with the lowest value was set equal to one and used to calculate the relative additional persons alive at 1 year for all other agents.
Results
Survival metrics
In the individual tumor analyses, efficacy results for individual agents varied by survival metric. For treatment of prostate cancer, for which all metrics were based on reported KM OS curve data, abiraterone yielded the highest improvement in 1-year survival rate (13.7%, previously treated, Figure 1A), whereas sipuleucel-T yielded the highest mean OS improvement (3.6 months, previously untreated, Figure 1B) and enzalutamide yielded the highest median OS improvement (4.8 months, previously treated, Figure 1C) among all agents vs their respective trial comparators.
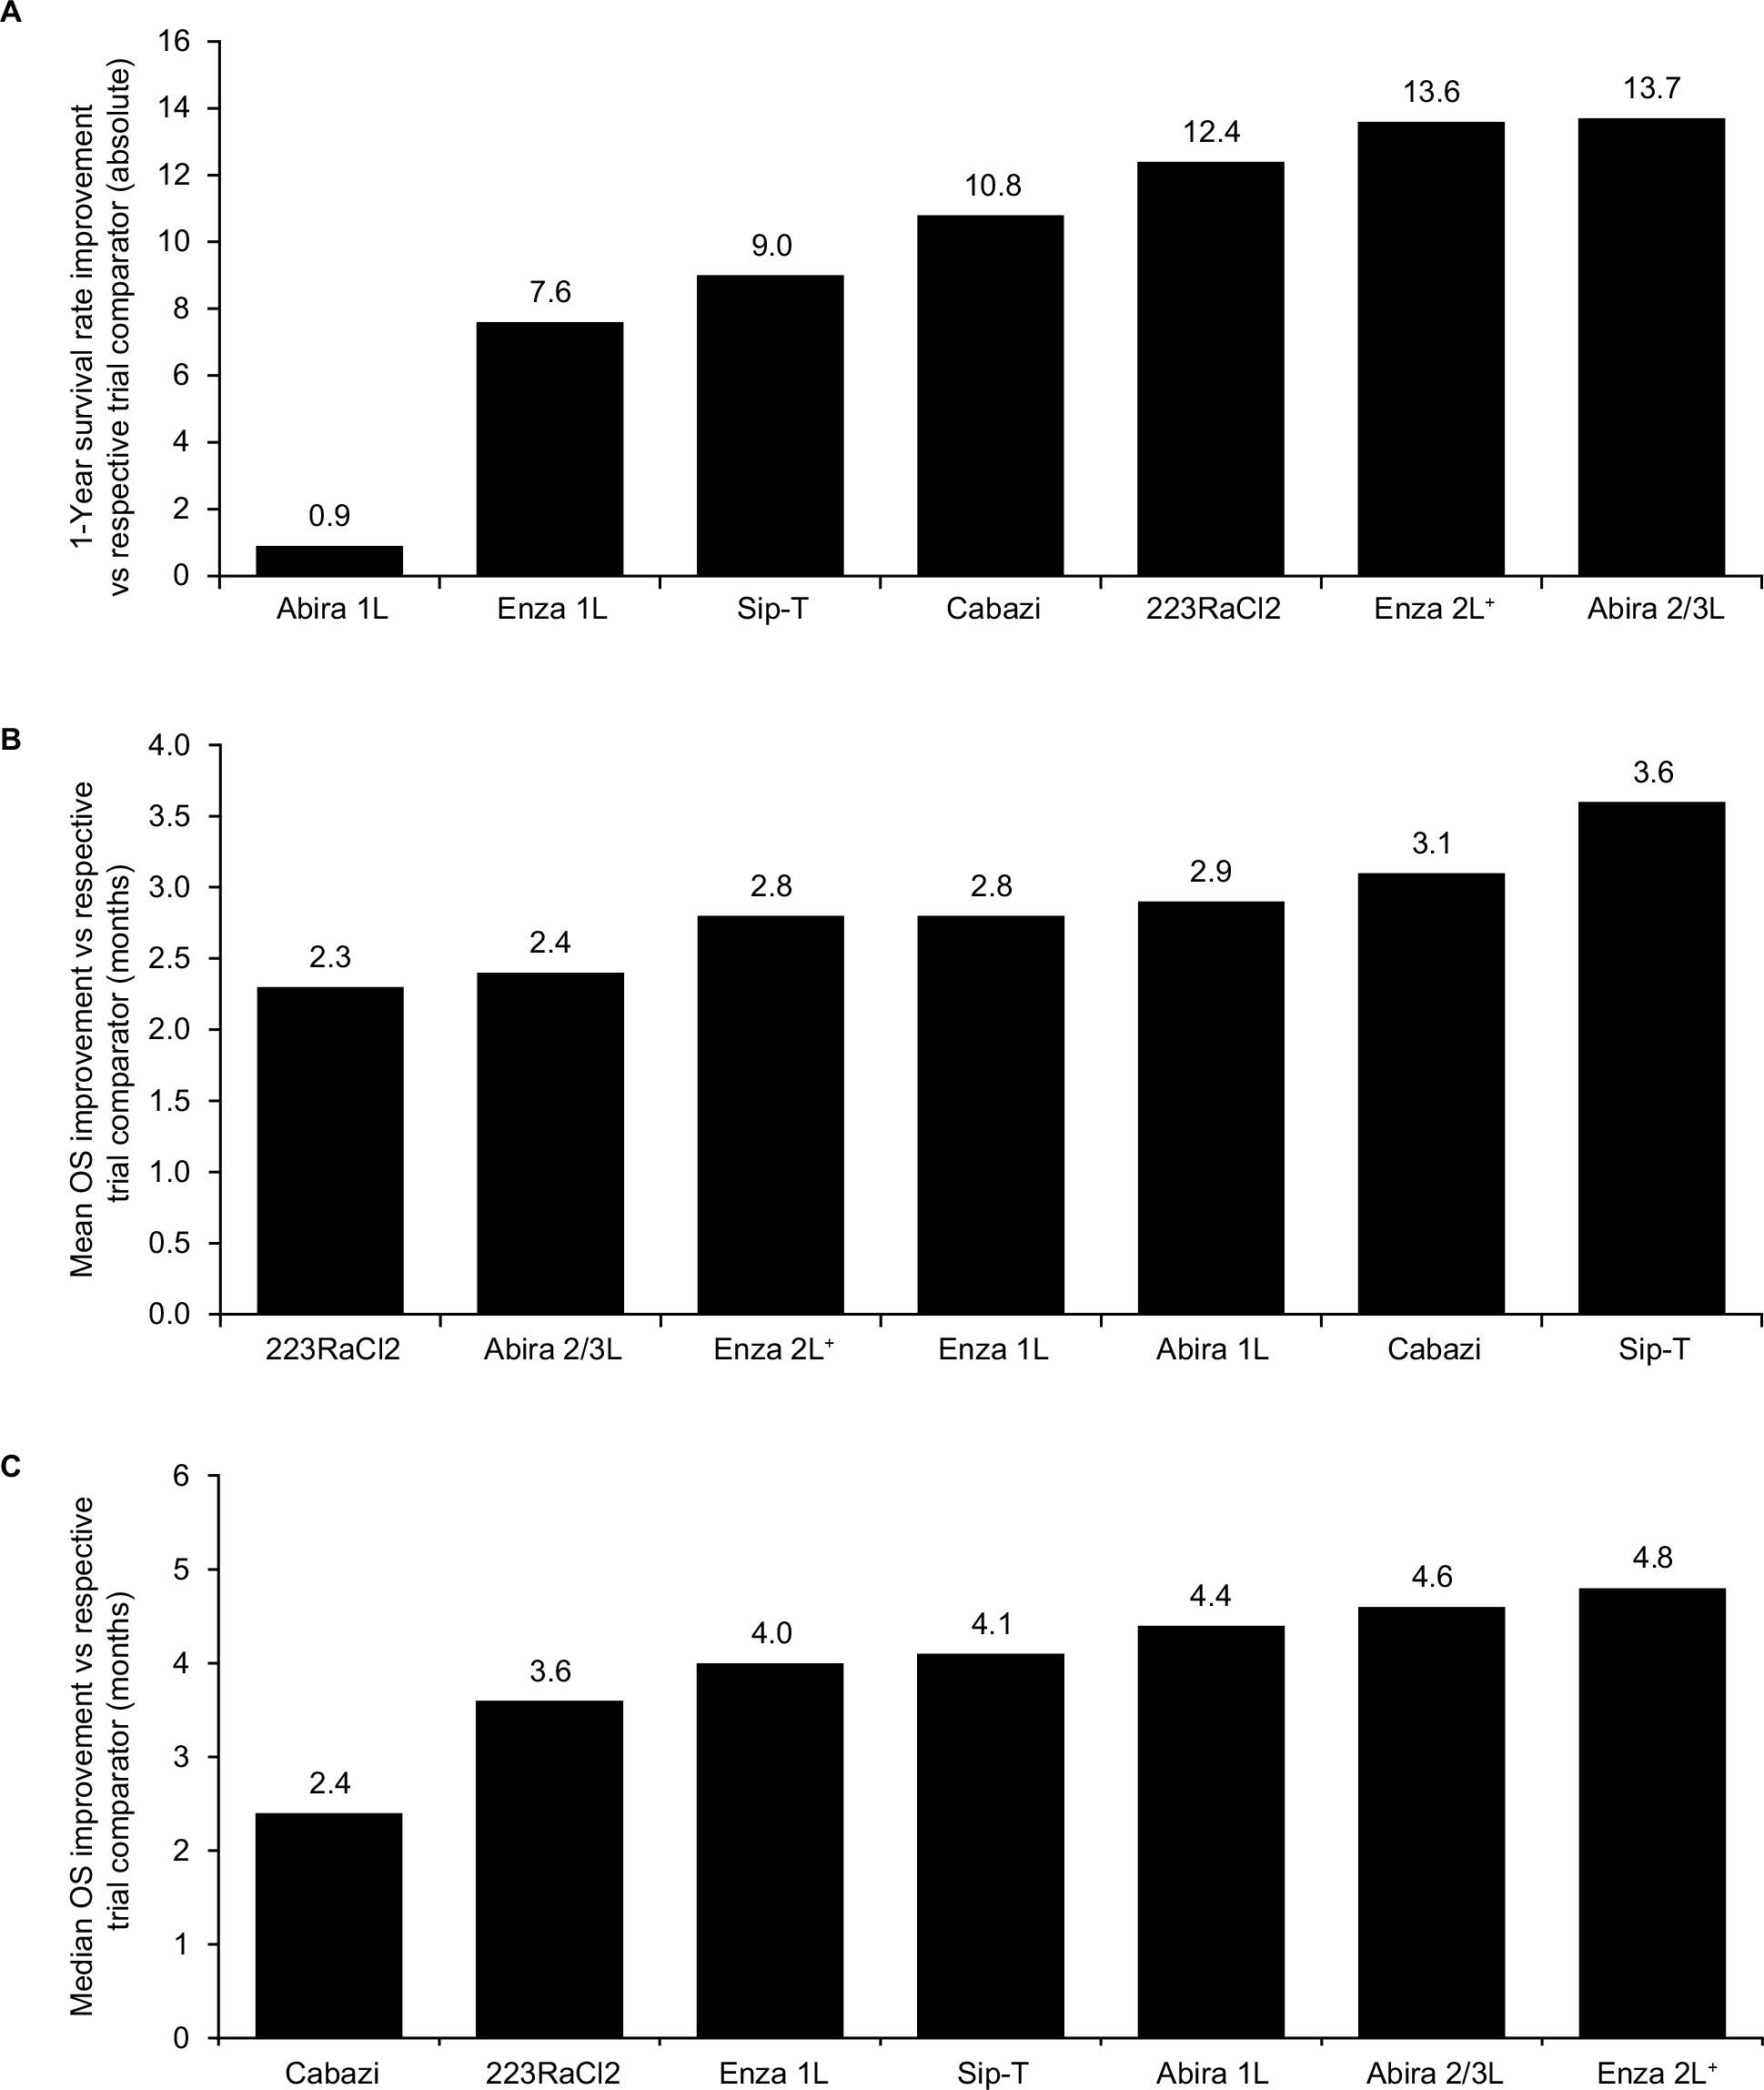 | Figure 1 Prostate cancer survival improvement. (A) Improvement in 1-year survival, (B) improvement in mean OS, and (C) improvement in median OS for therapies in prostate cancer for each agent vs its respective trial comparator, based on reported Kaplan–Meier OS curves. Abbreviations: 1L, first line; 2L, second line; 223RaCl2, radium 223 dichloride; 3L, third line; Abira, abiraterone; Cabazi, cabazitaxel; Enza, enzalutamide; OS, overall survival; Sip-T, sipuleucel-T. |
For treatment of NSCLC, nivolumab yielded the highest improvement in 1-year survival rate (18%, previously treated squamous disease) and mean OS (5.0 months, previously treated squamous disease) among all agents vs their respective trial comparators (figures not presented), whereas afatinib yielded the highest improvement in median OS (4.1 months, previously untreated EGFR del19 and L858R mutants, Figure 2A) based on reported KM curves. In the extrapolated analysis, which helps to account for differences in data maturity, nivolumab again yielded the highest improvement in 3-year survival rate (12.6%, previously treated squamous disease, Figure 2B) and in mean OS (11.8 months, previously treated squamous disease, Figure 2C).
 | Figure 2 Non-small cell lung cancer survival improvement. (A) Improvement in median OS based on reported Kaplan–Meier OS curves, (B) improvement in 3-year OS, and (C) improvement in mean OS for each agent vs its respective trial comparator, based on fitted Kaplan–Meier OS curves that extrapolate survival beyond the reported cutoffs; excludes interventions where relevant Kaplan–Meier OS curves were not identified (ie, afatinib, nintedanib, and pemetrexed [2L]). Any drug compared with placebo or best supportive care (offers a lower clinical benchmark against which it is easier to demonstrate relative value) was excluded (ie, pemetrexed [maintenance], docetaxel, and erlotinib [2/3L]). Abbreviations: 1L, first line; 2L, second line; 3L, third line; Afa, afatinib; Bev, bevacizumab; Criz, crizotinib; Erlot, erlotinib; Gefit, gefitinib; Nab-pac, nab-paclitaxel; Neci, necitumumab; Nivo, nivolumab; NSQ, nonsquamous; OS, overall survival; PD-L1, programmed death ligand 1; Pemet, pemetrexed; Pembro, pembrolizumab 2 mg/kg; Ramu, ramucirumab; SQ, squamous. |
In the case of immuno-oncology agents used to treat NSCLC (nivolumab in previously treated disease, irrespective of programmed death ligand 1 [PD-L1] expression and pembrolizumab in previously treated ≥ 1% PD-L1-positive disease; see Table S1), the greatest survival benefits vs their respective trial comparators were apparent when mean OS and 3-year survival rate improvements (based on extrapolated curves) were used as the comparative metrics (Figures 2B and C). By comparison, when median OS improvement based on reported curves was used to compare agents (Figure 2A), the benefits of immuno-oncology drugs vs their respective trial comparators were comparable with those of many targeted alternatives in NSCLC. Furthermore, the magnitude of variation among NSCLC agents across the different survival metrics was greater than that observed in prostate cancer, where immuno-oncology agents were not used.
Cost-value analyses
Results of the pan-tumor cost-value analyses are shown in Figures 3–6. Presentation of these data as a single-variable plot, in terms of the relative number of additional patients alive at 1 year per US dollar spent on a range of treatments for NSCLC, is provided in Figure S1.
 | Figure 3 Improvement in 1-year survival rate over respective trial comparators vs total treatment cost for branded monotherapies for breast cancer, colorectal cancer, melanoma, non-small cell lung cancer, and renal cell carcinoma based on reported Kaplan–Meier overall survival curves. Note: Regression line represents average value given cost. Gray shaded area below line represents below average value given cost. Abbreviations: 1L, first line; 2L, second line; 3L, third line; 5-FU, 5-fluorouracil; Aflib, ziv-aflibercept; Axit, axitinib; Bev, bevacizumab; BSC, best supportive care; Cabo, cabozantinib; Cape, capecitabine; Cetux, cetuximab; Criz, crizotinib; Dabraf, dabrafenib; Doce, docetaxel; EGFR, epidermal growth factor receptor; Erib, eribulin; Erlot, erlotinib; Evero, everolimus; FOLFIRI, folinic acid, fluorouracil, irinotecan; FOLFOX, folinic acid, fluorouracil, oxaliplatin; Gefit, gefitinib; Ifo, ifosfamide; ILF, infusional 5-FU; Ipi, ipilimumab; ITT, intent-to-treat; Lapat, lapatinib; LV, leucovorin; M(c), maintenance (continuous); M(s), maintenance (switch); Nab-p, nab-paclitaxel; Neci, necitumumab; Nivo, nivolumab; NSQ, nonsquamous; Panit, panitumumab; Pazop, pazopanib; Pembro, pembrolizumab; Pemet, pemetrexed; Ramu, ramucirumab; Regor, regorafenib; Soraf, sorafenib; SQ, squamous; Sunit, sunitinib; Tems, temsirolimus; Tipi, tipiracil; Tramet, trametinib; Trastuz, trastuzumab; Triflu, trifluridine; Vem, vemurafenib; Vin, vinorelbine; WT, wild type; XELOX, capecitabine + oxaliplatin. |
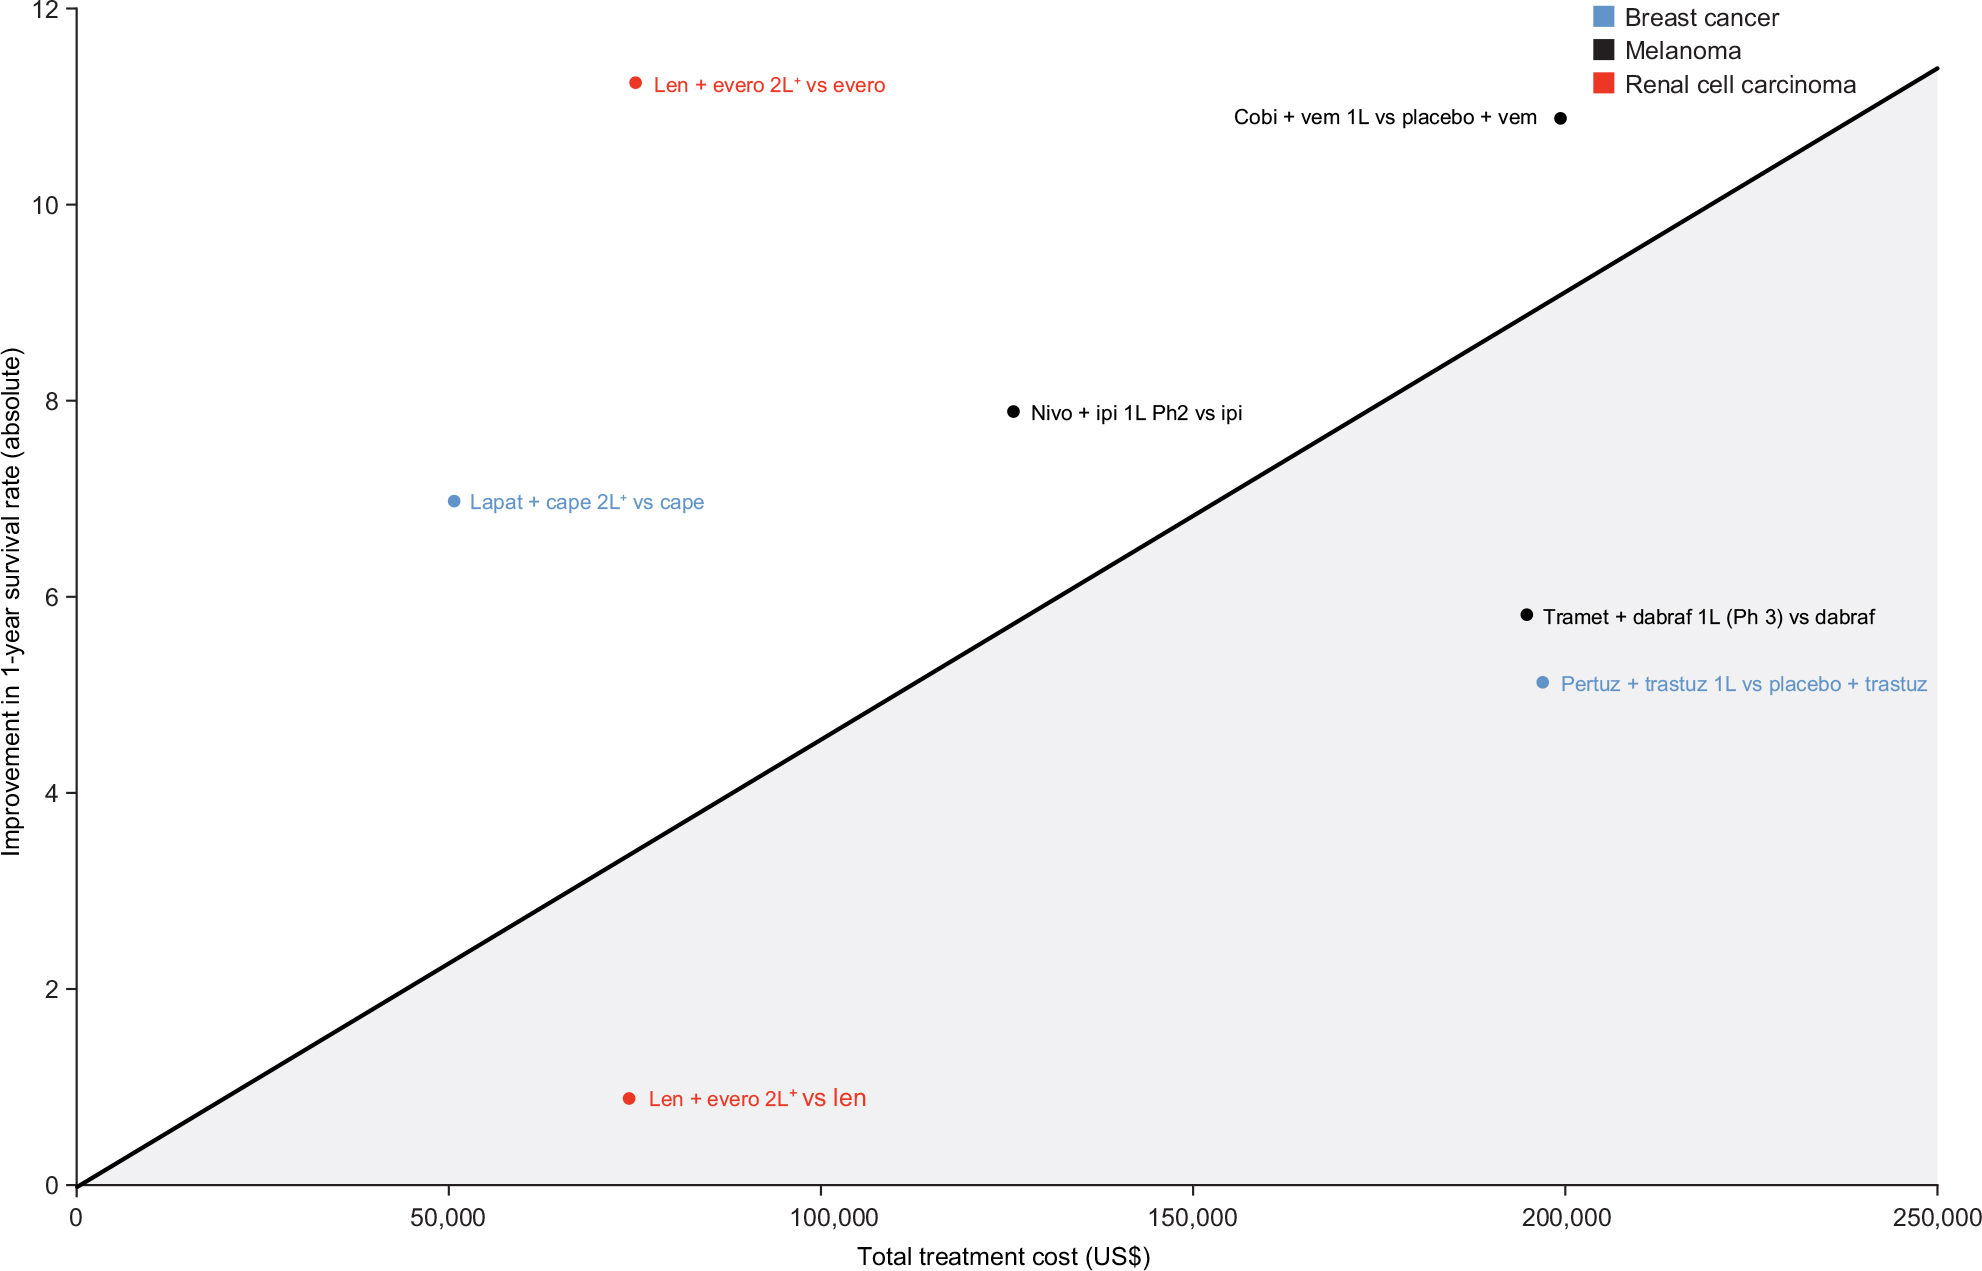 | Figure 4 Improvement in 1-year survival rate over respective trial comparators vs total treatment cost for combination regimens comprising two branded therapies in breast cancer, melanoma, and renal cell carcinoma based on reported Kaplan–Meier overall survival curves. Note: Regression line represents average value given cost. Gray shaded area below line represents below average value given cost. Abbreviations: 1L, first line; 2L, second line; Cape, capecitabine; Cobi, cobimetinib; Dabraf, dabrafenib; Evero, everolimus; Ipi, ipilimumab; Lapat, lapatinib; Len, lenvatinib; Nivo, nivolumab; Pertuz, pertuzumab; Ph, phase; Tramet, trametinib; Trastuz, trastuzumab; Vem, vemurafenib. |
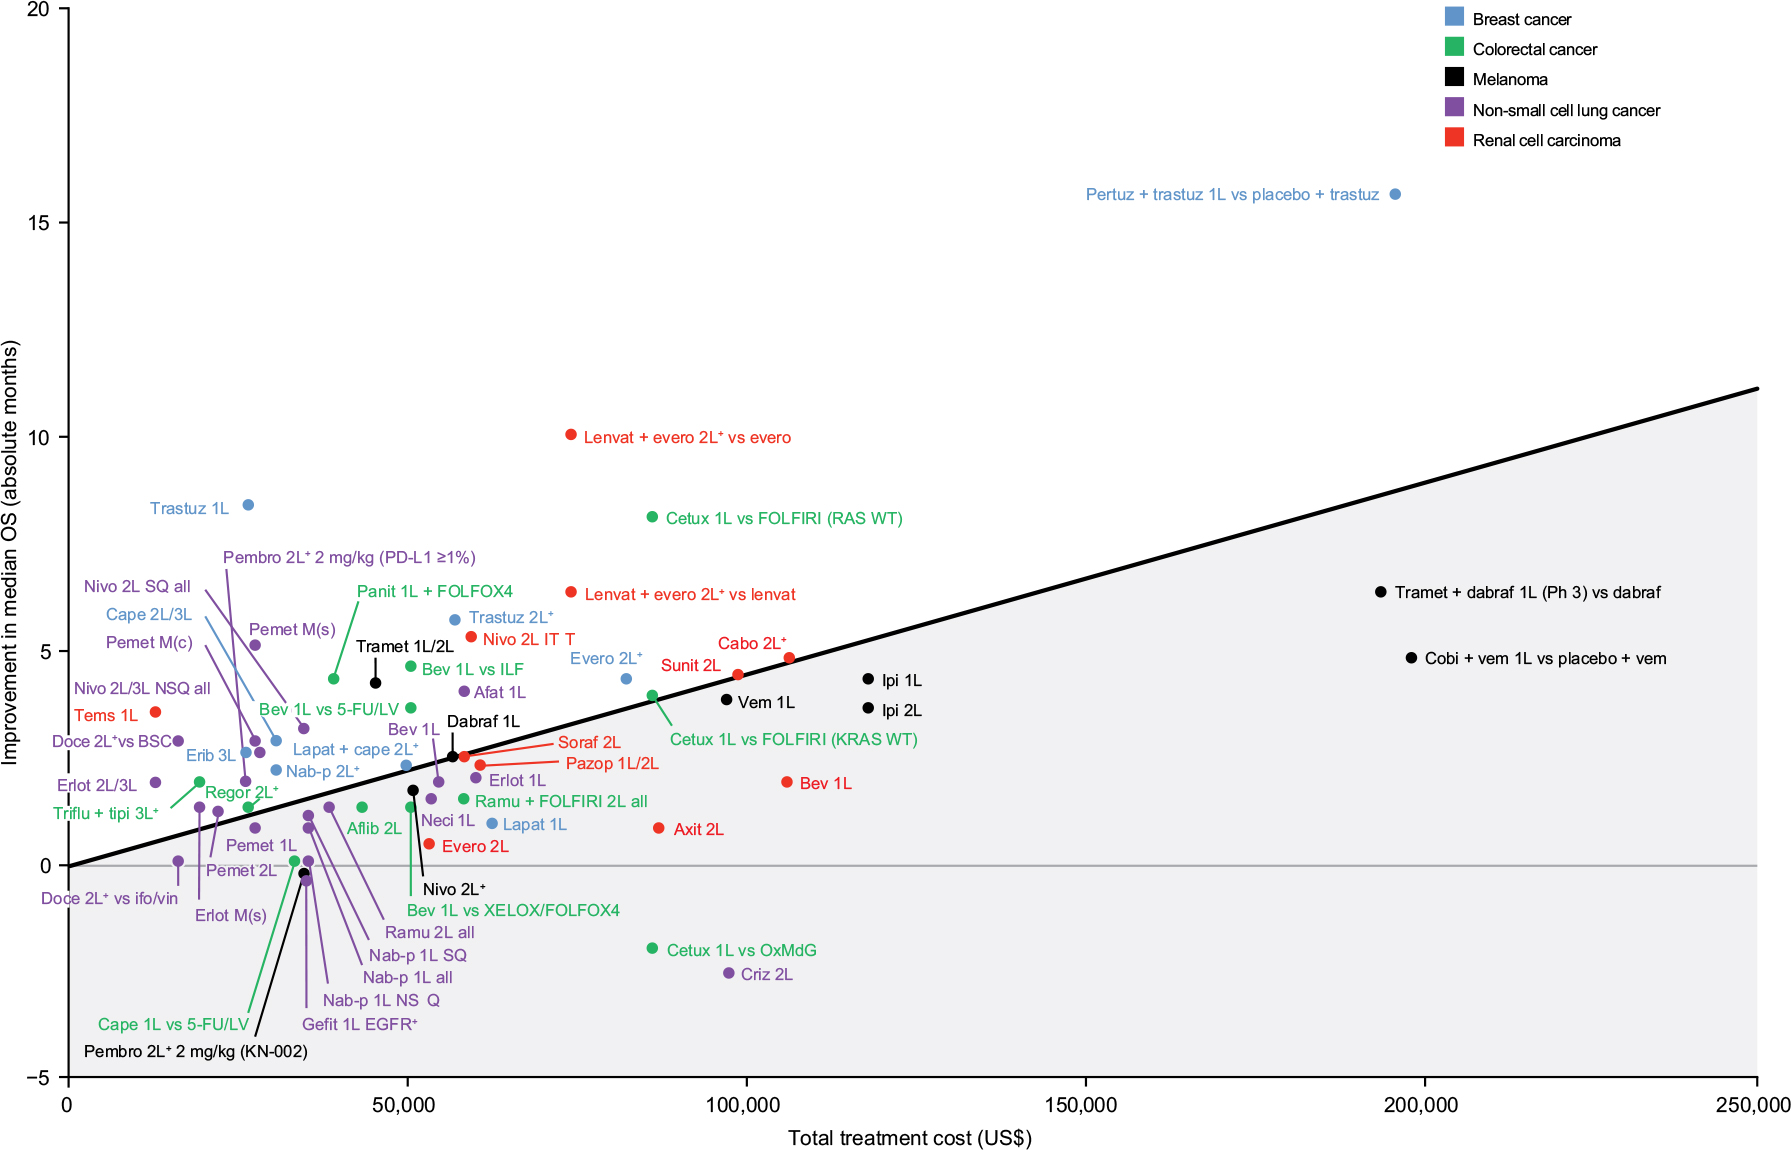 | Figure 5 Improvement in median OS over respective trial comparators vs total treatment cost for breast cancer, colorectal cancer, melanoma, non-small cell lung cancer, and renal cell carcinoma based on reported Kaplan–Meier OS curves. Note: Regression line represents average value given cost. Gray shaded area below line represents below average value given cost. Abbreviations: 1L, first line; 2L, second line; 3L, third line; 5-FU, 5-fluorouracil; Afat, afatinib; Aflib, ziv-aflibercept; Axit, axitinib; Bev, bevacizumab; BSC, best supportive care; Cabo, cabozantinib; Cape, capecitabine; Cetux, cetuximab; Cobi, cobimetinib; Criz, crizotinib; Dabraf, dabrafenib; Doce, docetaxel; EGFR, epidermal growth factor receptor; Erib, eribulin; Erlot, erlotinib; Evero, everolimus; FOLFIRI, folinic acid, fluorouracil, irinotecan; FOLFOX, folinic acid, fluorouracil, oxaliplatin; Gefit, gefitinib; Ifo, ifosfamide; ILF, infusional 5-FU; Ipi, ipilimumab; ITT, intent-to-treat; KN, KEYNOTE; Lapat, lapatinib; Lenvat, lenvatinib; LV, leucovorin; M(c), maintenance (continuous); M(s), maintenance (switch); Nab-p, nab-paclitaxel; Neci, necitumumab; Nivo, nivolumab; NSQ, non-squamous; OS, overall survival; OxMdG, oxaliplatin/modified de Gramont chemotherapy; Panit, panitumumab; Pazop, pazopanib; Pembro, pembrolizumab; Pemet, pemetrexed; Pertuz, pertuzumab; Ph, phase; Ramu, ramucirumab; Regor, regorafenib; Soraf, sorafenib; SQ, squamous; Sunit, sunitinib; Tems, temsirolimus; Tipi, tipiracil; Tramet, trametinib; Trastuz, trastuzumab; Triflu, trifluridine; Vem, vemurafenib; Vin, vinorelbine; WT, wild type; XELOX, capecitabine + oxaliplatin. |
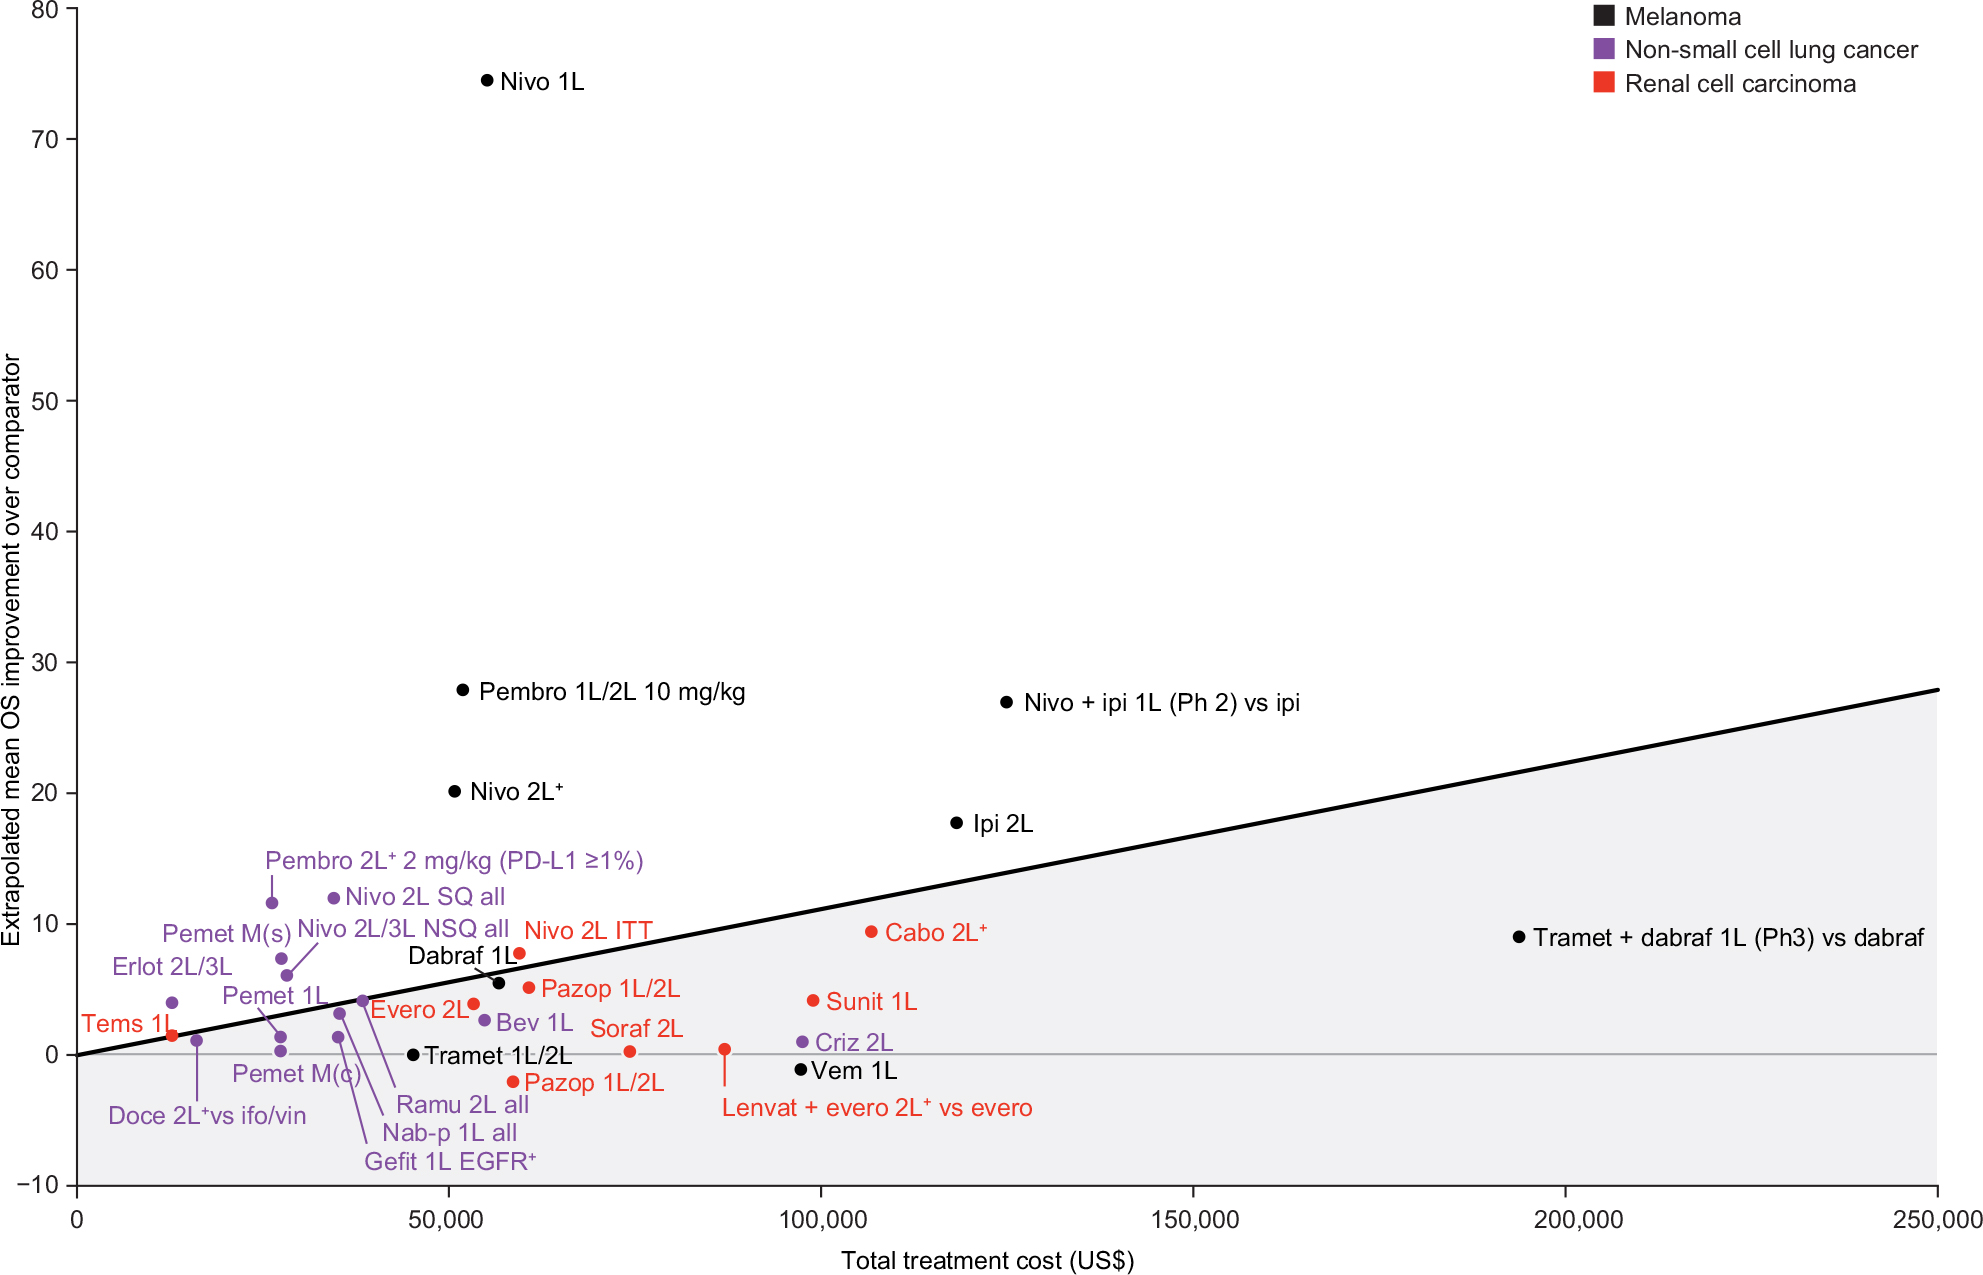 | Figure 6 Improvement in mean OS over respective trial comparators vs total treatment cost for melanoma, non-small cell lung cancer, and renal cell carcinoma based on fitted Kaplan–Meier OS curves that extrapolate survival beyond the reported cutoffs. Regression line represents average value given cost. Gray shaded area below line represents below average value given cost. Abbreviations: 1L, first line; 2L, second line; 3L, third line; Bev, bevacizumab; Cabo, cabozantinib; Criz, crizotinib; Dabraf, dabrafanib; Doce, docetaxel; EGFR, epidermal growth factor receptor; Erlot, erlotinib; Evero, everolimus; Gefit, gefitinib; Ifo, ifosfamide; Ipi, ipilimumab; ITT, intent-to-treat; Lenvat, lenvatinib; M(c), maintenance (continuous); M(s), maintenance (switch); Nab-p, nab-paclitaxel; Nivo, nivolumab; NSQ, nonsquamous; OS, overall survival; Pazop, pazopanib; Pembro, pembrolizumab; Pemet, pemetrexed; Ph, phase; Ramu, ramucirumab; Soraf, sorafenib; SQ, squamous; Sunit, sunitinib; Tems, temsirolimus; Tramet, trametinib; Vem, vemurafenib; Vin, vinorelbine; WT, wild type. |
Therapies used for tumors and lines of therapy with higher baseline median survival were generally associated with the greatest absolute median survival gain compared with their trial comparators; that is, in these settings, the same relative risk reduction would result in a larger absolute gain in median OS (eg, first-line melanoma and breast cancer).23 Using 1-year survival as the metric, some of the agents with greatest benefit vs their trial comparators were for NSCLC, where baseline survival is very low.23 However, two (docetaxel and pemetrexed) of the three NSCLC agents with the greatest survival gain vs their respective comparators (docetaxel, pemetrexed, and nivolumab) had best supportive care as their trial comparator, providing a low clinical benchmark against which greater efficacy gains can be demonstrated. Similarly, based on the cost-value analyses, nivolumab + ipilimumab appeared less favorable than nivolumab monotherapy in first-line melanoma in terms of the mean OS benefit over their respective trial comparators. The comparator arm for nivolumab + ipilimumab in CheckMate 069 was ipilimumab,24 which is a higher clinical benchmark than cytotoxic chemotherapy (dacarbazine, the comparator for nivolumab monotherapy in CheckMate 066),25 making demonstration of relative value more challenging. As with this example, branded combination therapies may be rated as having a lower relative clinical value than their constituent monotherapies. Thus, the relative value of branded combination agents can appear comparable with or even lower than that offered by their constituent monotherapies; therefore, it may be more appropriate to evaluate the value of branded combination regimens separately (Figure 4).
Results varied with the applied survival metric, with some agents achieving a higher cost-value for some metrics, but not others, as can be seen by differences in relative value from 1-year survival rates based on reported KM curves (Figures 3 and 4), median OS based on reported KM curves (Figure 5), and mean OS based on extrapolated curves (Figure 6). For example, the intervention with the greatest increase in median OS was pertuzumab + trastuzumab for breast cancer, at a cost that appeared to provide above-average efficacy benefits compared with other available therapies (as indicated by its relative position over the regression line in Figure 5). In contrast, when looking across agents at increases in 1-year survival (Figure 4), pertuzumab + trastuzumab for breast cancer provided a much less favorable efficacy profile (5.2% increase in 1-year survival), and at a cost (more than $196,000 per patient) far in excess of the average value offered (as indicated by its position relative to the regression line). This discrepancy may illustrate limitations in median OS as an efficacy metric, as it cannot take into account any long-term survival benefits after the median has been reached, unlike mean OS and landmark survival analyses.
Discussion
This analysis demonstrated that therapy benefits differed depending on the survival metric used, with evaluations of oncology therapies based on improvements in median OS yielding some very distinct results vs other survival metrics. Although median OS is among the most commonly used metrics in oncology trials, it fails to take into account long-term survival benefits after the median has been reached and, thus, is not well suited to assess the value of immuno-oncology therapies, for which efficacy is typified by KM survival curves showing delayed but sustained separation.
Alternative survival metrics include mean OS and landmark survival rates. In the pan-tumor analysis, some differences in cost-value patterns were also observed with the 1-year survival metric (Figure 3) compared with the mean OS metric (Figure 6). Although median OS provides an estimate that cannot be biased by a small number of outlying cases, it calculates survival for the whole cohort based on only the first 50% of patients who do not survive.26,27 Mean OS offers a more comprehensive assessment of long-term survival benefits, as it captures the complete survival curve, including the “tail”. In terms of value for money, many healthcare payers and health technology assessment agencies consider mean OS as the standard metric for cancer treatment cost-effectiveness analyses.27 However, a limitation of assessing value using mean OS calculations based on the study duration deemed appropriate by regulatory bodies for each treatment’s Phase III pivotal trial is that duration is not consistent among trials, which may confound comparisons. Although mean OS offers a more comprehensive assessment of long-term survival benefits, using this metric requires extrapolation of KM OS curves beyond reported cutoffs. Extrapolation in this study was undertaken for therapies indicated for NSCLC, RCC, or melanoma (the first three cancers with an approved immuno-oncology agent). Use of digitized KM curves, rather than actual data points, where patient-level data were not available, is a limitation of our analysis. Furthermore, parametric curve selection, particularly with an immature data set, can be subject to interpretation, as distinct curves with similar goodness-of-fit statistics can introduce variability in outcomes.
Landmark survival rates can be highly effective for comparing therapies by enabling survival comparisons after the median has been reached. However, data maturity and cutoffs varied among trials included in this assessment. As selection of a later time point for landmark survival rates could severely constrain the comparator set, 1-year survival rates based on reported KM OS curves (where available) were used. Using such an early time point, however, may not account for long-term survival benefits of selected therapies, and indeed may even precede the median OS cutoff for some tumor types. Utilizing fitted parametric KM curves to provide survival data beyond the reported cutoffs and the selection of landmark survival at a later time point can provide a consistent set of more mature landmark survival readouts, but is subject to limitations, as discussed above.
In addition to survival, health-related quality-of-life (HRQoL) is an important metric that provides detailed information from the patient perspective, and is increasingly being reported in clinical studies. However, unlike survival outcomes, HRQoL is not reported consistently across studies. Furthermore, diversity in HRQoL metrics used across trials, variability in timing of PRO data reporting, and the percentage of patients missing PRO data limit comparability within and across tumor types.28 Therefore, HRQoL metrics were not included in this analysis.
Our results showed variation in the relative value of the agents assessed, particularly between median OS and other metrics. Nevertheless, the findings showed no clear ideal metric, with variations observed in the relative value of treatments, even between landmark survival rates and mean OS metrics. Moreover, a higher relative survival outcome on a given metric did not necessarily translate into greater economic value. These discrepancies emphasize the need to incorporate a wide range of metrics into assessments of the efficacy benefits of different agents in a pan-tumor as well as in individual tumor comparison of value, or to be able to appropriately target value metrics to the agents of interest.
Pan-tumor value comparisons should be interpreted with caution owing to heterogeneity between trials (particularly variations in comparators, but also in populations, study design, outcomes, and timing of assessments). Furthermore, baseline survival expectations differ among tumor types and lines of therapy and must be considered when evaluating relative value so as not to discriminate unfairly against agents that treat cancers with the highest unmet need. Although the ASCO Value in Cancer Care Task Force has expressed concern about cross-trial comparisons due to potential biases, the task force has also suggested that the ASCO value framework tool could be used to facilitate individual patient treatment decision-making based on data from multiple trials for a specific indication.13
Another factor that may affect relative value is variation in patient crossover rates from the control to the active agent arm, which can confound OS results. For example, in Figure 4, the two regimens with the greatest survival benefits (lenvatinib + everolimus and cobimetinib + vemurafenib) were from trials where crossover was not allowed, whereas the regimen with the next highest survival benefit (nivolumab + ipilimumab) was from a trial where more than 55% of patients in the ipilimumab arm crossed over to receive nivolumab + ipilimumab. Pembrolizumab, which also had ipilimumab as its trial comparator for first-line and second-line treatment of melanoma,29 appeared to offer a mean survival benefit vs ipilimumab of a similar magnitude to that offered by nivolumab + ipilimumab vs ipilimumab for first-line treatment of melanoma; however, crossover was not permitted in the pembrolizumab trial.
An additional limitation of RVA is that it involves naïve trial comparisons, in distinct cancer types and lines of therapy, and in different patient populations. This includes making comparisons of therapies approved in biomarker-selected vs nonbiomarker selected populations. For example, in Figure 5, the anti-PD-1 agent pembrolizumab appears to produce a survival benefit in previously treated NSCLC that is within the range of the anti-PD-1 agent nivolumab in previously treated squamous and non-squamous NSCLC, but at a lower cost. However, as of the analysis end date, pembrolizumab was only approved in PD-L1+ patients in this line of therapy, whereas nivolumab was approved in an all-comers population. As an alternative, more complex meta-analytic approaches (if feasible given available data resources), instead of this type of pan-tumor value assessment tool, could be used to reduce bias. The results of the individual tumor analyses for NSCLC and prostate cancer can address some of these limitations to an extent, and provide an alternate means for assessing the relative value assessment approach.
Another limitation in this cost-value analysis is that each therapy was assigned a cost based on reported monthly cost, multiplied by therapy duration (median duration of administration, median PFS, or median time to progression, based on available data), which varied between trials. Although costs could be underestimated by using median instead of mean therapy duration, this bias was assumed to be relatively consistent across agents because similar methods were used to estimate costs for all comparators. Furthermore, assigned cost-value only incorporated drug cost as adjusted for duration and loading dose, and did not take into account symptom burden, treatment safety profile, HRQoL, healthcare resource utilization, or use of postprogression therapies. These factors are particularly important with newer, frequently less toxic therapies compared with traditional chemotherapy. Additionally, the cost-value analysis did not take into account drug cost discounting, which might be available among certain payers, or compassionate use programs or patient rebates. As with any complex analysis that entails input of a large and diverse body of evidence, only FDA-approved drugs during the study period (January 1, 2000—August 21, 2016) are included; later approvals were not included in the analysis. Finally, the predefined inclusion criteria may have resulted in the evaluated agents not being representative of the entire treatment landscape, thus potentially introducing selection bias.
Despite the limitations noted here, from which no value assessment tool is exempt, the RVA tool utilized in this study provides a framework for comparing oncology therapies both within and across tumor types. As such, it adds to the range of value tools and metrics available that include treatment costs for valuing oncology treatments.12–15,30
US payers often look to NCCN and ASCO clinical guidelines as part of their reimbursement decision-making,31 which either do not currently account for treatment costs (ASCO) or provide a five-level affordability rating (NCCN). Several of the existing value scorecards come from provider bodies (ASCO, NCCN, and MSKCC), suggesting that traditionally cost-agnostic stakeholders are becoming increasingly concerned over the escalating costs of care. As the cost of care continues to rise, payers may be increasingly forced to make value trade-offs, and this tool can be used to support funding prioritization.
While some of these tools base scores heavily on median OS or PFS benefits, the RVA tool incorporates a wide range of efficacy metrics that, unlike median OS, can account for long-term survival benefits. As shown in this study, valuing oncology therapies based on improvements in median OS alone potentially undervalues new treatment modalities associated with long-term survival benefits. Ongoing review and discussion of the range of indices to define and measure cost-effectiveness is needed to reach a consensus, or at least more broadly accepted criteria, for defining value, particularly for novel therapies.
Further research could include a systematic methodological standardization for parametric curve selection for the calculation of mean OS and long-term landmark OS endpoints alongside aligning best value metrics and reconciling when results differ. The RVA approach demonstrated here can compare a wide range of efficacy metrics for treatments across a broad range of cancers that can be utilized to better inform decisions by payers and providers in managed care.
Conclusions
In the era of expanding healthcare costs and budgetary pressure, payers will increasingly focus on areas of high and expanding costs, of which cancer care is prominent. Physicians are also becoming attuned to treatment costs, and it is notable that many of the value frameworks and scorecards are provider-led. Although median OS is the traditional gold standard oncology efficacy metric, it should not be considered in isolation of other metrics, because it does not capture long-term survival benefits, the ultimate goal of cancer treatment. The metric selected to define the value of an oncology therapy must be carefully considered. Value frameworks incorporating diverse metrics, such as the one presented here, are needed for comprehensive value assessments of cancer therapies, particularly for new treatment modalities such as immuno-oncology.
Acknowledgments
Medical writing assistance was provided by Karen Smoyer, PhD, and Beth Burke, PhD, CMPP, of Evidence Scientific Solutions Inc, and was funded by Bristol-Myers Squibb. Bristol-Myers Squibb commissioned and funded this study; participated in the analysis and interpretation of the data; contributed to the preparation, review, and approval of the article for publication; and covered costs for medical writing and editorial assistance.
Disclosure
JWS and AJG report employment by Bristol-Myers Squibb during the conduct of this study; JWS is a stockholder of Bristol-Myers Squibb. RM, AA, and EA are employed by PAREXEL International, the entity paid for analyses in this manuscript. This manuscript includes information presented at the International Society for Pharmacoeconomics and Outcomes Research 21st Annual International Meeting, May 2016, in Washington DC, USA and published as a congress abstract at the following site: https://www.valueinhealthjournal.com/article/S1098-3015(16)01616-8/fulltext.
References
Macmillan Cancer Support. Cancer’s unequal burden: the reality behind improving cancer survival rates. 2014. Available from: http://www.macmillan.org.uk/documents/cancersunequalburden_2014.pdf. Accessed November 18, 2016. | ||
American Association for cancer research. Cancer progress report. 2013. Available from: http://www.cancerprogressreport.org. Accessed November 18, 2016. | ||
Jagsi R, Sulmasy DP, Moy B. Value of cancer care: ethical considerations for the practicing oncologist. Am Soc Clin Oncol Educ Book. 2014:e146–e149. | ||
Abernethy A, Abrahams E, Barker A, et al. Turning the tide against cancer through sustained medical innovation: the pathway to progress. Clin Cancer Res. 2014;20(5):1081–1086. | ||
Erikson C, Salsberg E, Forte G, Bruinooge S, Goldstein M. Future supply and demand for oncologists: challenges to assuring access to oncology services. J Oncol Pract. 2007;3(2):79–86. | ||
de Angelis R, Sant M, Coleman MP, et al. Cancer survival in Europe 1999-2007 by country and age: results of EUROCARE--5-a population-based study. Lancet Oncol. 2014;15(1):23–34. | ||
Hostenkamp G, Lichtenberg FR. The impact of recent chemotherapy innovation on the longevity of myeloma patients: US and international evidence. Soc Sci Med. 2015;130:162–171. | ||
Sleijfer S. “It’s the economy, stupid”: strategies for improved cost containment in cancer treatment. Clin Pharmacol Ther. 2014;95(4):365–367. | ||
Mariotto AB, Yabroff KR, Shao Y, Feuer EJ, Brown ML. Projections of the cost of cancer care in the United States: 2010-2020. J Natl Cancer Inst. 2011;103(2):117–128. | ||
OECD iLibrary. health at a glance: Europe 2014; 2014. Available from: http://dx.doi.org/10.1787/health_glance_eur-2014-en. Accessed November 18, 2016. | ||
Miller JD, Foley KA, Russell MW. Current challenges in health economic modeling of cancer therapies: a research inquiry. Am Health Drug Benefits. 2014;7(3):153–162. | ||
Schnipper LE, Davidson NE, Wollins DS, et al. American Society of clinical oncology statement: a conceptual framework to assess the value of cancer treatment options. J Clin Oncol. 2015;33(23):2563–2577. | ||
Schnipper LE, Davidson NE, Wollins DS, et al. Updating the American Society of clinical oncology value framework: revisions and reflections in response to comments received. J Clin Oncol. 2016;34(24):2925–2934. | ||
Cherny NI, Sullivan R, Dafni U, et al. A standardised, generic, validated approach to stratify the magnitude of clinical benefit that can be anticipated from anti-cancer therapies: the European Society for Medical Oncology Magnitude of Clinical Benefit Scale (ESMO-MCBS). Ann Oncol. 2015;26(8):1547–1573. | ||
Memorial Sloan Kettering Cancer Center. DrugAbacus. 2015. Available from: http://abacus.realendpoints.com/abacus-mskcc?ab-eff=1000&ab-tox=0.1&ab-nov=1&ab-rare=1&ab-pop=1&ab-dev=1&prog=1.0&ab-need=1&ab-time=1478798514. Accessed November 18, 2016. | ||
Schadendorf D, Hodi FS, Robert C, et al. Pooled analysis of long-term survival data from phase II and phase III trials of ipilimumab in unresectable or metastatic melanoma. J Clin Oncol. 2015;33(17):1889–1894. | ||
Friedman LM, Furberg CD, DeMets DL. Survival analysis. In: Fundamentals of Clinical Trials. 4th ed. New York, NY: Springer-Verlag New York; 2010:269–291. | ||
Brody T. Clinical Trials: Study Design, Endpoints and Biomarkers, Drug Safety, and FDA and ICH Guidelines. 2nd ed. Oxford, UK: Academic Press; 2011. | ||
Karweit J, Kotapati S, Wagner S, Shaw JW, Wolfe SW, Abernethy AP. An expanded portfolio of survival metrics for assessing anticancer agents. Am J Manag Care. 2017;23(1):54–61. | ||
National Cancer Institute. Surveillance, epidemiology, and end results (SEER) cancer STAT fact sheets; 2016. Available from: https://seer.cancer.gov/statfacts/. Accessed November 18, 2016. | ||
Guyot P, Ades AE, Ouwens MJ, Welton NJ. Enhanced secondary analysis of survival data: reconstructing the data from published Kaplan-Meier survival curves. BMC Med Res Methodol. 2012;12:9. | ||
IHS Markit. Life sciences PharmOnline International (PolI) database. Available from: www.ihsglobalinsight.com. Accessed September 8, 2016. | ||
Siegel RL, Miller KD, Jemal A. Cancer statistics, 2016. CA Cancer J Clin. 2016;66(1):7–30. | ||
Hodi FS, Chesney J, Pavlick AC, et al. Combined nivolumab and ipilimumab versus ipilimumab alone in patients with advanced melanoma: 2-year overall survival outcomes in a multicentre, randomised, controlled, phase 2 trial. Lancet Oncol. 2016;17(11):1558–1568. | ||
Robert C, Long GV, Brady B, et al. Nivolumab in previously untreated melanoma without BRAF mutation. N Engl J Med. 2015;372(4):320–330. | ||
Davies A, Briggs A, Schneider J, et al. The ends justify the mean: outcome measures for estimating the value of new cancer therapies. Health Outcome Res Med. 2012;3(1):e25–e36. | ||
Joulain F, Proskorovsky I, Allegra C, et al. Mean overall survival gain with aflibercept plus FOLFIRI vs placebo plus FOLFIRI in patients with previously treated metastatic colorectal cancer. Br J Cancer. 2013;109(7):1735–1743. | ||
Kyte D, Duffy H, Fletcher B, et al. Systematic evaluation of the patient-reported outcome (pro)content of clinical trial protocols. PLoS One. 2014;9(10):e110229. | ||
Robert C, Schachter J, Long GV, et al. Pembrolizumab versus ipilimumab in advanced melanoma. N Engl J Med. 2015;372(26):2521–2532. | ||
Binder G, Milentijevic D, Squier M, Whiting S, Brown G, Renschler MF. Magnitude of benefit and costs for recent solid tumor agents. Poster presented at: International Society for Pharmacoeconomics and Outcomes Research 19th Annual International Meeting; May 31–June 4, 2014, 2014; Montréal, QC, Canada. | ||
Garrison LP. Cost-effectiveness and clinical practice guidelines: have we reached a tipping point? An overview. Value Health. 2016;19(5):512–515. |
Supplementary materials
 | Table S1 Data included in the survival and cost analyses Abbreviations: 1L, first line; 2L, second line; BSC, best support care; IFN, interferon; NA, not applicable; NSCLC, non-small cell lung cancer; NSQ, non-squamous; PD-L1, programmed death ligand 1; SQ, squamous. |
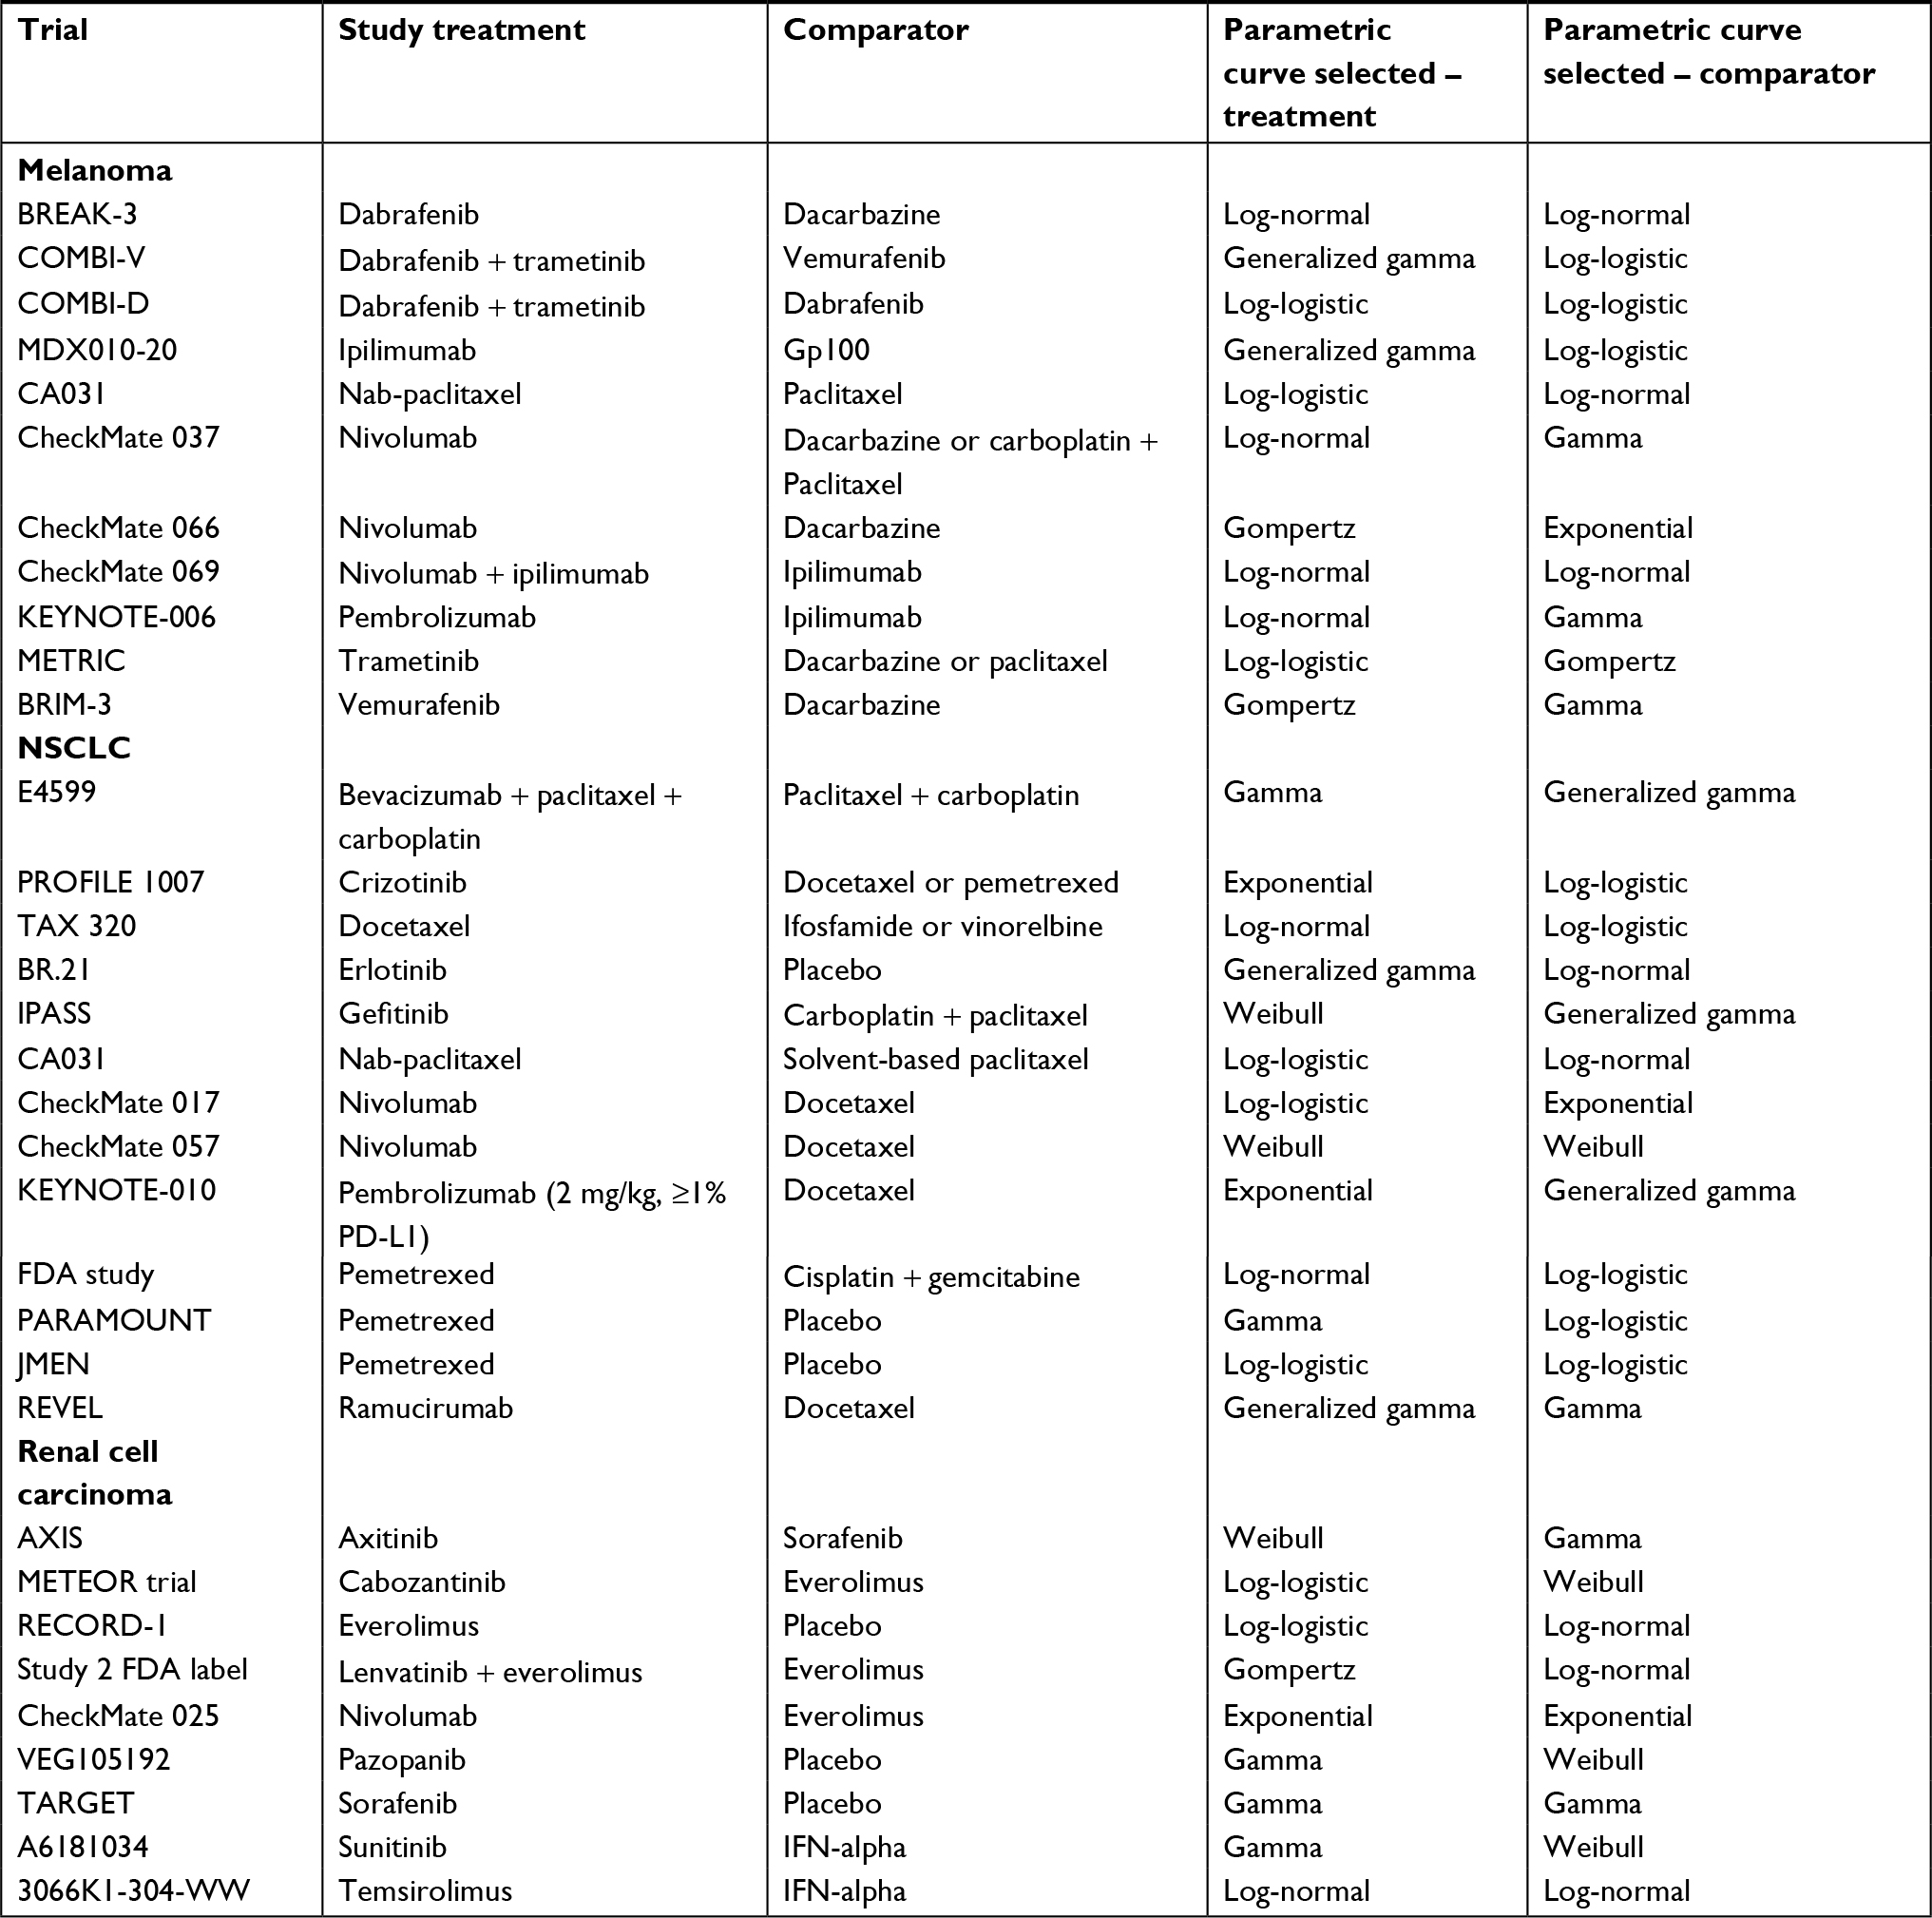 | Table S2 Parametric curves selected for OS extrapolation calculations Abbreviations: FDA, US Food and Drug Administration; IFN, interferon; NSCLC, non-small cell lung cancer; OS, overall survival; PD-L1, programmed death ligand 1. |
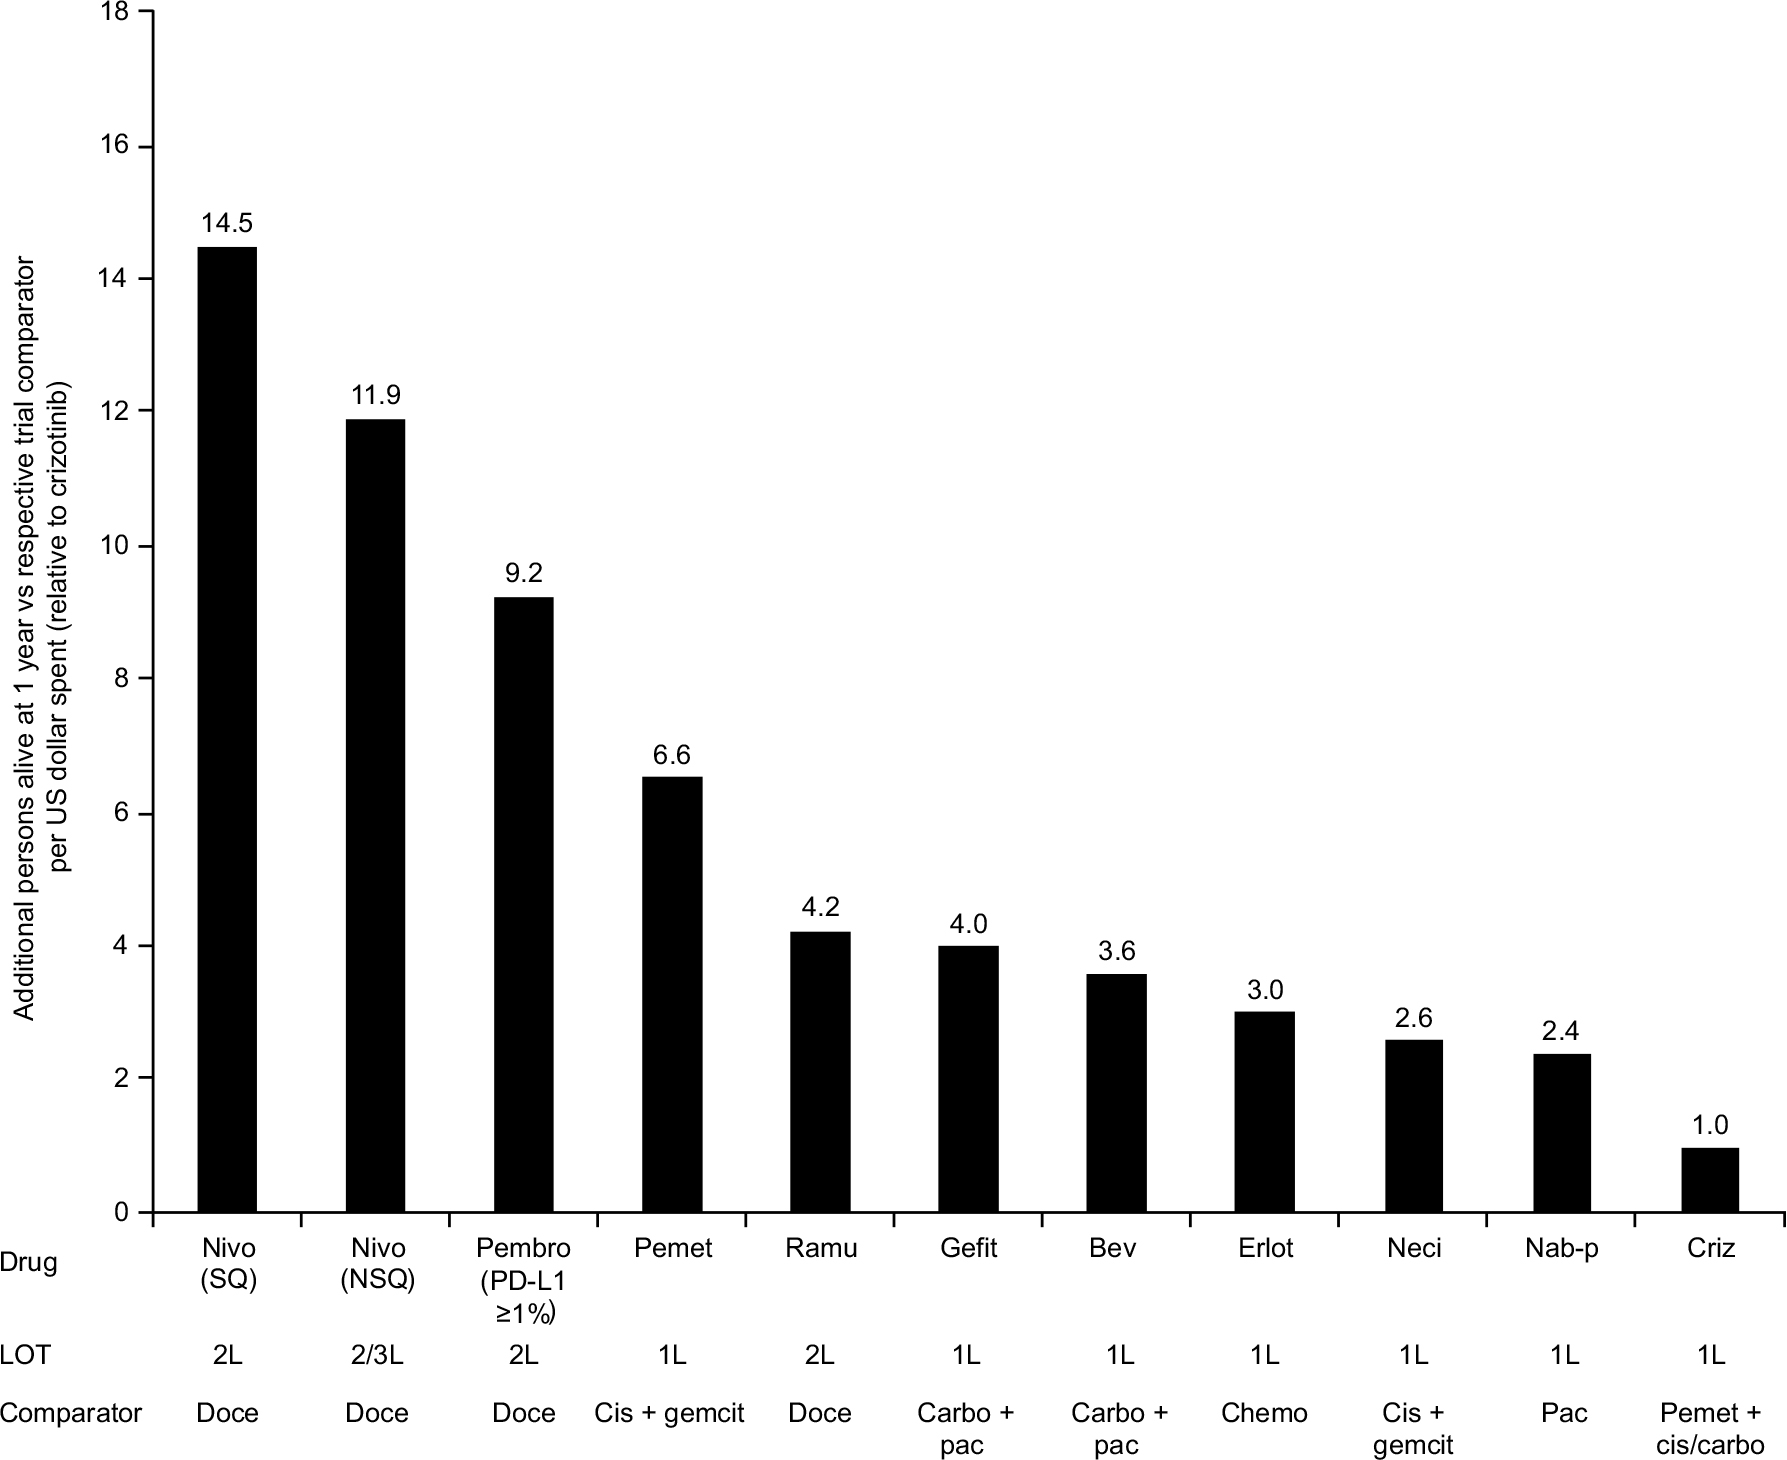 | Figure S1 Additional persons alive at 1 year vs respective trial comparator (relative to crizotinib) for NSCLC. Notes: Based on the number needed to treat for an additional person to be alive at 1 year, based on reported cutoffs from each drug’s pivotal trial. Includes FDA-approved interventions in NSCLC for which the relevant Kaplan–Meier overall survival curves were available; trials with comparators of placebo or best supportive care were excluded. Abbreviations: 1L, first line; 2L, second line; 3L, third line; Bev, bevacizumab; Carbo, carboplatin; Chemo, chemotherapy; Cis, cisplatin; Criz, crizotinib; Doce, docetaxel; Erlot, erlotinib; FDA, Food and Drug Administration; Gefit, gefitinib; Nab-p, nab-paclitaxel; Neci, necitumumab; Nivo, nivolumab; NSQ, nonsquamous; Pac, paclitaxel; Pembro, pembrolizumab; Pemet, pemetrexed; PT, platinum; Ramu, ramucirumab; SQ, squamous. |
References
CHMP assessment report: Tafinlar (dabrafenib). Procedure no. EMEA/H/C/002604/0000. 2013. Available from: http://www.ema.europa.eu/docs/en_GB/document_library/EPAR_-_Public_assessment_report/human/002604/WC500149673.pdf. Accessed November 18, 2016. | ||
Dabrafenib, 50mg and 75mg hard capsules (Tafinlar®). SMC No. 1023/15. 2015. Available from: https://www.scottishmedicines.org.uk/files/advice/dabrafenib_Tafinlar_FINAL_February_2015_Amended_04.03.15_for_website.pdf. Accessed November 18, 2016. | ||
Hauschild A, Grob JJ, Demidov LV, et al. Dabrafenib in BRAF-mutated metastatic melanoma: a multicentre, open-label, phase 3 randomised controlled trial. Lancet. 2012;380(9839):358–365. | ||
Robert C, Karaszewska B, Schachter J, et al. Improved overall survival in melanoma with combined dabrafenib and trametinib. N Engl J Med. 2015;372(1):30–39. | ||
CHMP assessment report: Mekinist. Procedure no. EMEA/H/C/002643/0000. 2014. Available from: http://www.ema.europa.eu/docs/en_GB/document_library/EPAR_-_Public_assessment_report/human/002643/WC500169708.pdf. Accessed November 18, 2016. | ||
Long GV, Stroyakovskiy D, Gogas H, et al. Combined BRAF and MEK inhibition versus BRAF inhibition alone in melanoma. N Engl J Med. 2014;371(20):1877–1788. | ||
Flaherty K, Davies MA, Grob JJ, et al. Genomic analysis and 3-y efficacy and safety update of COMBI-d: a phase 3 study of dabrafenib (D) + trametinib (T) vs D monotherapy in patients (pts) with unresectable or metastatic BRAF V600E/K-mutant cutaneous melanoma. J Clin Oncol. 2016;34:abstr 9502. | ||
ClinicalTrials.gov Identifier: NCT00094653. MDX-010 antibody, MDX-1379 melanoma vaccine, or MDX-010/MDX-1379 combination treatment for patients with unresectable or metastatic melanoma. 2004. Available from: https://clinicaltrials.gov/ct2/show/study/NCT00094653?sect=X01256. Accessed November 18, 2016. | ||
Assessment report for Yervoy (ipilimumab). Procedure no. EMEA/H/C/002213. 2011. Available from: http://www.ema.europa.eu/docs/en_GB/document_library/EPAR_-_Public_assessment_report/human/002213/WC500109302.pdf. Accessed November 18, 2016. | ||
Yervoy (ipilimumab) injection, for intravenous infusion [prescribing information]. Princeton, NJ: Bristol-Meyers Squibb Company; 2015. Available from: http://www.accessdata.fda.gov/drugsatfda_docs/label/2015/125377s074lbl.pdf. Accessed November 18, 2016. | ||
Hersh E, Vecchio MD, Brown MP, et al. Final overall survival from a phase 3 trial of nab-paclitaxel versus dacarbazine (DTIC) in chemotherapy-naive patients with metastatic melanoma. J Clin Oncol. 2014;32(5s):abstr 9045. | ||
Assessment report: Opdivo (nivolumab). Procedure no. EMEA/H/C/003985/0000. 2015. Available from: http://www.ema.europa.eu/docs/en_GB/document_library/EPAR_-_Public_assessment_report/human/003985/WC500189767.pdf. Accessed November 18, 2016. | ||
Weber JS, D’Angelo SP, Minor D, et al. Nivolumab versus chemotherapy in patients with advanced melanoma who progressed after anti-CTLA-4 treatment (CheckMate 037): a randomised, controlled, open-label, phase 3 trial. Lancet Oncol. 2015;16(4):375–384. | ||
Robert C, Long GV, Brady B, et al. Nivolumab in previously untreated melanoma without BRAF mutation. N Engl J Med. 2015;372(4):320–330. | ||
Hodi FS, Postow MA, Chesney JA, et al. Clinical response, progression-free survival (PFS), and safety in patients (pts) with advanced melanoma (MEL) receiving nivolumab (NIVO) combined with ipilimumab (IPI) vs IPI monotherapy in CheckMate 069 study. J Clin Oncol. 2015;33:abstr 9004. | ||
Assessment report: Opdivo (nivolumab). Procedure no. EMEA/H/C/003985/II/0003. 2016. Available from: http://www.ema.europa.eu/docs/en_GB/document_library/EPAR_-_Assessment_Report_-_Variation/human/003985/WC500209378.pdf. Accessed November 18, 2016. | ||
Daud A, Blank CU, Robert C, et al. KEYNOTE-006 study of pembrolizumab (pembro) versus ipilimumab (ipi) for advanced melanoma: efficacy by PD-L1 expression and line of therapy. J Clin Oncol. 2016;34:abstr 9513. | ||
Robert C, Schachter J, Long GV, et al. Pembrolizumab versus ipilimumab in advanced melanoma. N Engl J Med. 2015;372(26):2521–2532. | ||
Schachter J, Ribas A, Long G, et al. Pembrolizumab versus ipilimumab for advanced melanoma: final overall survival analysis of KEYNOTE-006. J Clin Oncol. 2016;34:abstr 9504. | ||
Assessment report: Keytruda. Procedure no. EMEA/H/C/003820/0000. 2015. Available from: http://www.ema.europa.eu/docs/en_GB/document_library/EPAR_-_Public_assessment_report/human/003820/WC500190992.pdf. Accessed November 18, 2016. | ||
Ribas A, Puzanov I, Dummer R, et al. Pembrolizumab versus investigator-choice chemotherapy for ipilimumab-refractory melanoma (KEYNOTE-002): a randomised, controlled, phase 2 trial. Lancet Oncol. 2015;16(8):908–918. | ||
Flaherty KT, Infante JR, Daud A, et al. Combined BRAF and MEK inhibition in melanoma with BRAF V600 mutations. N Engl J Med. 2012;367(18):1694–1703. | ||
Mekinist (trametinib) tablets, for oral use [prescribing information]. Research Triangle Park, NC: GlaxoSmithKline; 2014. Available from: http://www.accessdata.fda.gov/drugsatfda_docs/label/2014/204114s001lbl.pdf. Accessed November 18, 2016. | ||
McArthur GA, Chapman PB, Robert C, et al. Safety and efficacy of vemurafenib in BRAFV600E and BRAFV600K mutation-positive melanoma (BRIM-3): extended follow-up of a phase 3, randomised, open-label study. Lancet Oncol. 2014;15(3):323–332. | ||
Assessment report: Zelboraf (vemurafenib). Procedure no. EMEA/H/C/002409. 2011. Available from: http://www.ema.europa.eu/docs/en_GB/document_library/EPAR_-_Public_assessment_report/human/002409/WC500124400.pdf. Accessed November 18, 2016. | ||
Zelboraf® (vemurafenib) tablet for oral use [prescribing information]. South San Francisco, CA: Genentech, Inc.; 2014. Available from: http://www.accessdata.fda.gov/drugsatfda_docs/label/2014/202429s006lbl.pdf. Accessed November 18, 2016. | ||
Vemurafenib 240 mg film-coated tablet (Zelboraf®). SMC No. 792/12. 2013. Available from: http://www.scottishmedicines.org.uk/files/advice/vemurafenib__Zelboraf__RESUBMISSION_FINAL_Nov_2013_for_Website.pdf. Accessed November 18, 2016. | ||
Gilotrif film-coated tablets [summary of product characteristics]. Ingelheim am Rhein, Germany: Boehringer Ingelheim GmbH. Available from: http://www.ema.europa.eu/docs/en_GB/document_library/EPAR_-_Product_Information/human/002280/WC500152392.pdf. Accessed November 18, 2016. | ||
Sequist LV, Yang JC, Yamamoto N, et al. Phase III study of afatinib or cisplatin plus pemetrexed in patients with metastatic lung adenocarcinoma with EGFR mutations. J Clin Oncol. 2013;31(27):3327–3334. | ||
Gilotrif™ (afatinib) tablets, for oral use [prescribing information]. Ridgefield, CT: Boehringer Ingelheim Pharmaceuticals, Inc.; 2013. Available from: http://www.accessdata.fda.gov/drugsatfda_docs/label/2013/201292s002lbl.pdf. Accessed November 18, 2016. | ||
Extension of indication variation assessment report: Avastin. Procedure no. EMEA/H/C/000582/II/0072. 2015. Available from: http://www.ema.europa.eu/docs/en_GB/document_library/EPAR_-_Assessment_Report_-_Variation/human/000582/WC500187361.pdf. Accessed November 18, 2016. | ||
Avastin® (bevacizumab) solution for intravenous infusion [prescribing information]. South San Francisco, CA: Genentech, Inc.; 2011. Available from: http://www.accessdata.fda.gov/drugsatfda_docs/label/2011/125085s225lbl.pdf. Accessed November 18, 2016. | ||
Sandler A, Gray R, Perry MC, et al. Paclitaxel–carboplatin alone or with bevacizumab for non–small-cell lung cancer. N Engl J Med. 2006;355(24):2542–2550. | ||
Solomon BJ, Mok T, Kim DW, et al. First-line crizotinib versus chemotherapy in ALK-positive lung cancer. N Engl J Med. 2014;371(23):2167–2177. | ||
Fossella FV, DeVore R, Kerr RN, et al. Randomized phase III trial of docetaxel versus vinorelbine or ifosfamide in patients with advanced non–small-cell lung cancer previously treated with platinum-containing chemotherapy regimens. J Clin Oncol. 2000;18(12):2354–2362. | ||
Rosell R, Carcereny E, Gervais R, et al. Erlotinib versus standard chemotherapy as first-line treatment for European patients with advanced EGFR mutation-positive non-small-cell lung cancer (EURTAC): a multicentre, open-label, randomised phase 3 trial. Lancet Oncol. 2012;13(3):239–246. | ||
Tarceva® (erlotinib) tablets, for oral use [prescribing information]. South San Francisco, CA: Genentech, Inc.; 2015. Available from: http://www.accessdata.fda.gov/drugsatfda_docs/label/2015/021743s021lbl.pdf. Accessed November 18, 2016. | ||
Erlotinib 25, 100 and 150 mg film-coated tablets (Tarceva®). SMC No. 749/11. 2012. Available from: http://www.scottishmedicines.org.uk/files/advice/erlotinib_Tarceva_FINAL_December_2011_for_website.pdf. Accessed November 18, 2016. | ||
Tarceva film-coated tablets [summary of product characteristics]. Welwyn Garden City, UK: Roche; 2010. Available from: http://www.ema.europa.eu/docs/en_GB/document_library/EPAR_-_Product_Information/human/000618/WC500033994.pdf. Accessed November 18, 2016. | ||
Shepherd FA, Rodrigues PJ, Ciuleanu T, et al. Erlotinib in previously treated non–small-cell lung cancer. N Engl J Med. 2005;353(2):123–132. | ||
Scientific discussion: Tarceva. 2005. Available from: http://www.ema.europa.eu/docs/en_GB/document_library/EPAR_-_Scientific_Discussion/human/000618/WC500033991.pdf. Accessed November 18, 2016. | ||
Iressa (gefitinib) tablets for oral use [prescribing information]. Wilmington, DE: AstraZeneca; 2015. Available from: http://www.accessdata.fda.gov/drugsatfda_docs/label/2015/206995s000lbl.pdf. Accessed November 18, 2016. | ||
Gefitinib 250mg film-coated tablets (Iressa). SMC No. 615/10. 2010. Available from: https://www.scottishmedicines.org.uk/files/advice/gefitinib_Iressa_RESUBMISSION_FINAL_November_2010_for_website.pdf. Accessed November 18, 2016. | ||
Socinski MA, Bondarenko I, Karaseva NA, et al. Weekly nab-paclitaxel in combination with carboplatin versus solvent-based paclitaxel plus carboplatin as first-line therapy in patients with advanced non–small-cell lung cancer: final results of a phase III trial. J Clin Oncol. 2012;30(17):2055–2062. | ||
Thatcher N, Hirsch FR, Szczesna A, et al. A randomized, multicenter, open-label, phase III study of gemcitabine-cisplatin (GC) chemotherapy plus necitumumab (IMC-11F8/LY3012211) versus GC alone in the first-line treatment of patients (pts) with stage IV squamous non-small cell lung cancer (sq-NSCLC). J Clin Oncol. 2014;32(5s):abstr 8008. | ||
Thatcher N, Hirsch FR, Luft AV, et al. Necitumumab plus gemcitabine and cisplatin versus gemcitabine and cisplatin alone as first-line therapy in patients with stage IV squamous non-small-cell lung cancer (SQUIRE): an open-label, randomised, controlled phase 3 trial. Lancet Oncol. 2015;16(7):763–774. | ||
Assessment report: Portrazza (necitumumab). Procedure no. EMEA/H/C/003886/0000. 2015. Available from: http://www.ema.europa.eu/docs/en_GB/document_library/EPAR_-_Public_assessment_report/human/003886/WC500202696.pdf. Accessed November 18, 2016. | ||
Brahmer J, Reckamp KL, Baas P, et al. Nivolumab versus docetaxel in advanced squamous-cell non–small-cell lung cancer. N Engl J Med. 2015;373(2):123–135. | ||
Spigel DR, Reckamp KL, Rizvi NA, et al. A phase III study (CheckMate 017) of nivolumab (NIVO; anti-programmed death-1 [PD-1]) vs docetaxel (DOC) in previously treated advanced or metastatic squamous (SQ) cell non-small cell lung cancer (NSCLC). J Clin Oncol. 2015;33:abstr 8009. | ||
Borghaei H, Brahmer JR, Horn L, et al. Nivolumab (nivo) vs docetaxel (doc) in patients (pts) with advanced NSCLC: CheckMate 017/057 2-y update and exploratory cytokine profile analyses. J Clin Oncol. 2016;34:abstr 9025. | ||
Paz-Ares L, Horn L, Borghaei H, et al. Phase III, randomized trial (CheckMate 057) of nivolumab (NIVO) versus docetaxel (DOC) in advanced non-squamous cell (non-SQ) non-small cell lung cancer (NSCLC). J Clin Oncol. 2015;33:abstr LBA109. | ||
Herbst RS, Baas P, Kim DW, et al. Pembrolizumab versus docetaxel for previously treated, PD-L1-positive, advanced non-small-cell lung cancer (KEYNOTE-010): a randomised controlled trial. Lancet. 2016;387(10027):1540–1550. | ||
Garon EB, Herbst RS, Kim D-W, et al. Pembrolizumab vs docetaxel for previously treated advanced NSCLC with a PD-L1 tumor proportion score (TPS) 1%-49%: results from KEYNOTE-010. J Clin Oncol. 2016;34:abstr 9024. | ||
Baas P, Garon EB, Herbst RS, et al. Relationship between level of PD-L1 expression and outcomes in the KEYNOTE-010 study of pembrolizumab vs docetaxel for previously treated, PD-L1–positive NSCLC. J Clin Oncol. 2016;34:abstr 9015. | ||
Alimta powder for concentrate for solution for infusion [summary of product characteristics]. Utrecht, The Netherlands: Eli Lilly Nederland B.V. Available from: http://www.ema.europa.eu/docs/en_GB/document_library/EPAR_-_Product_Information/human/000564/WC500025611.pdf. Accessed November 18, 2016. | ||
Assessment report: Alimta (pemetrexed). Procedure no. EMEA/H/C/000564/II/0033. 2011. Available from: http://www.ema.europa.eu/docs/en_GB/document_library/EPAR_-_Assessment_Report_-_Variation/human/000564/WC500118770.pdf. Accessed November 18, 2016. | ||
Pemetrexed, 100 mg, 500 mg powder for concentrate for solution for infusion (Alimta). SMC No. 531/09. 2009. Available from: http://www.scottishmedicines.org.uk/files/pemetrexed_Alimta_FINAL_January_2009_for_website.pdf_16.02.09.pdf. Accessed November 18, 2016. | ||
Scagliotti GV, Parikh P, von Pawel J, et al. Phase III study comparing cisplatin plus gemcitabine with cisplatin plus pemetrexed in chemotherapy-naive patients with advanced-stage non–small-cell lung cancer. J Clin Oncol. 2008;26(21):3543–3551. | ||
Pemetrexed, 100 mg & 500 mg, powder for concentrate for solution for infusion (Alimta®). SMC No. 770/12. 2014. Available from: https://www.scottishmedicines.org.uk/SMC_Advice/Advice/770_12_pemetrexed_Alimta/pemetrexed_Alimta_full. Accessed November 18, 2016. | ||
Schuette W, Nieman B, Schneider CP, et al. 65 plus: a randomized phase III trial of pemetrexed and bevacizumab vs. pemetrexed, bevacizumab and carboplatin as 1st line treatment for elderly patients with advanced non-squamous, non-small cell lung cancer (NSCLC)-a subgroup analysis of age and gender. Eur J Cancer. 2015;51:S623 (abstr 3077). | ||
Kasahara K, Kiura K, Nogami N, et al. Phase 2: docetaxel with or without ramucirumab as therapy for non-small cell lung cancer (NSCLC) with epidermal growth factor receptor (EGFR) activating mutations after prior EGFR tyrosine kinase inhibitor (TKI) and platinum-based chemotherapy. Eur J Cancer. 2015;51:S620 (abstr 3072). | ||
CHMP assessment report: Inlyta (axitinib). Procedure no. EMEA/H/C/002406. 2012. Available from: http://www.ema.europa.eu/docs/en_GB/document_library/EPAR_-_Public_assessment_report/human/002406/WC500132190.pdf. Accessed November 18, 2016. | ||
Motzer RJ, Escudier B, Tomczak P, et al. Axitinib versus sorafenib as second-line treatment for advanced renal cell carcinoma: overall survival analysis and updated results from a randomised phase 3 trial. Lancet Oncol. 2013;14(6):552–562. | ||
Inlyta® (axitinib) tablets for oral administration [prescribing information]. New York, NY: Pfizer Inc; 2014. Available from: http://www.accessdata.fda.gov/drugsatfda_docs/label/2014/202324s002lbl.pdf. Accessed November 18, 2016. | ||
Cabometyx™ (cabozantinib) tablets, for oral use [prescribing information]. South San Francisco, CA: Exelixis, Inc.; 2016. Available from: http://www.accessdata.fda.gov/drugsatfda_docs/label/2016/208692s000lbl.pdf. Accessed November 18, 2016. | ||
Choueiri TK, Escudier B, Powles T, et al. Cabozantinib versus everolimus in advanced renal cell carcinoma (METEOR): final results from a randomised, open-label, phase 3 trial. Lancet Oncol. 2016;17(7):917–927. | ||
Afinitor® (everolimus) tablets for oral administration [prescribing information]. East Hanover, NJ: Novartis Pharmaceuticals Corporation; 2015. Available from: http://www.accessdata.fda.gov/drugsatfda_docs/label/2015/022334s030lbl.pdf. Accessed November 18, 2016. | ||
Porta C, Calvo E, Climent MA, et al. Efficacy and safety of everolimus in elderly patients with metastatic renal cell carcinoma: an exploratory analysis of the outcomes of elderly patients in the RECORD-1 Trial. Eur Urol. 2012;61(4):826–833. | ||
Everolimus, 5 mg and 10 mg tablets (Afinitor®). SMC No. 872/13. 2013. Available from: http://www.scottishmedicines.org.uk/files/advice/everolimus_Afinitor_FINAL_June_2013_amended_03.07.13_for_website.pdf. Accessed November 18, 2016. | ||
CHMP assessment report for Afinitor (everolimus). Procedure no. EMEA/H/C/001038. 2009. Available from: http://www.ema.europa.eu/docs/en_GB/document_library/EPAR_-_Public_assessment_report/human/001038/WC500022817.pdf. Accessed November 18, 2016. | ||
Afinitor tablets. Afinitor 2.5 mg tablets [summary of product characteristics]. Camberley, UK: Novartis Europharm Limited. Available from: http://www.ema.europa.eu/docs/en_GB/document_library/EPAR_-_Product_Information/human/001038/WC500022814.pdf. Accessed November 18, 2016. | ||
Lenvima® (lenvatinib) capsules, for oral use [prescribing information]. Woodcliff Lake, NJ: Eisai Inc.; 2016. Available from: http://www.accessdata.fda.gov/drugsatfda_docs/label/2016/206947s003lbl.pdf. Accessed November 18, 2016. | ||
Hutson TE, Dutcus TE, Ren M, Baig MA, Fishman MN. Subgroup analyses and updated overall survival from the phase II trial of lenvatinib (LEN), everolimus (EVE), and LEN+EVE in metastatic renal cell carcinoma (mRCC). J Clin Oncol. 2016;34:abstr 4553. | ||
Motzer RJ, Hutson TE, Glen H, et al. Lenvatinib, everolimus, and the combination in patients with metastatic renal cell carcinoma: a randomised, phase 2, open-label, multicentre trial. Lancet Oncol. 2015;16(15):1473–1482. | ||
Opdivo 10 mg/mL concentrate for solution for infusion [summary of product characteristics]. Uxbridge, UK: Bristol-Myers Squibb Pharma EEIG. Available from: http://www.ema.europa.eu/docs/en_GB/document_library/EPAR_-_Product_Information/human/003985/WC500189765.pdf. Accessed November 18, 2016. | ||
Sharma P, Escudier B, McDermott DF, et al. CheckMate 025: a randomized, open-label, phase III study of nivolumab (NIVO) versus everolimus (EVE) in advanced renal cell carcinoma (RCC). Eur J Cancer. 2015;51:S708 (abstr 3LBA). | ||
ClinicalTrials.gov Identifier: NCT00334282. Safety and efficacy of GW786034 (pazopanib) in metastatic renal cell carcinoma. 2006. Available from: https://clinicaltrials.gov/ct2/show/NCT00334282?term=00334282&rank=1. Accessed November 18, 2016. | ||
Sternberg CN, Davis ID, Mardiak J, et al. Pazopanib in locally advanced or metastatic renal cell carcinoma: results of a randomized phase III trial. J Clin Oncol. 2010;28(6):1061–1068. | ||
Escudier B, Eisen T, Stadler WM, et al. Sorafenib for treatment of renal cell carcinoma: final efficacy and safety results of the phase III treatment approaches in renal cancer global evaluation trial. J Clin Oncol. 2009;27(20):3312–3318. | ||
Nexavar (sorafenib) tablets, oral [prescribing information]. Whippany, NJ: Bayer HealthCare Pharmaceuticals Inc.; 2013. Available from: http://www.accessdata.fda.gov/drugsatfda_docs/label/2013/021923s016lbl.pdf. Accessed November 18, 2016. | ||
Sorafenib 200mg tablets (Nexavar®). SMC No. 321/06. 2006. Available from: http://www.scottishmedicines.org.uk/files/sorafenib_200mg_tablets_Nexavar_321_06.pdf. Accessed November 18, 2016. | ||
Nexavar 200 mg film-coated tablets [summary or product characteristics]. Berlin, Germany: Bayer Pharma AG. Available from: http://www.ema.europa.eu/docs/en_GB/document_library/EPAR_-_Product_Information/human/000690/WC500027704.pdf. Accessed November 18, 2016. | ||
CHMP extension of indication variation assessment report: Nexavar. Procedure no. EMEA/H/C/000690/II/0035. 2014. Available from: http://www.ema.europa.eu/docs/en_GB/document_library/EPAR_-_Assessment_Report_-_Variation/human/000690/WC500168976.pdf. Accessed November 18, 2016. | ||
Motzer RJ, Hutson TE, Tomczak P, et al. Overall survival and updated results for sunitinib compared with interferon alfa in patients with metastatic renal cell carcinoma. J Clin Oncol. 2009;27(22):3584–3590. | ||
ClinicalTrials.gov Identifier: NCT00083889. SU011248 versus interferon-alfa as first-line systemic therapy for patients with metastatic renal cell carcinoma. 2004. Available from: https://clinicaltrials.gov/ct2/show/NCT00083889?term=A6181034&rank=1. Accessed November 18, 2016. | ||
Sutent® (sunitinib malate) capsules, oral [prescribing information]. New York, NY: Pfizer Inc; 2015. Available from: http://www.accessdata.fda.gov/drugsatfda_docs/label/2015/021938s028s029lbl.pdf. Accessed November 18, 2016. | ||
Sutent hard capsules [summary of product characteristics]. Sandwich, Kent, UK: Pfizer Limited. Available from: http://www.ema.europa.eu/docs/en_GB/document_library/EPAR_-_Product_Information/human/000687/WC500057737.pdf. Accessed November 18, 2016. | ||
Motzer RJ, Hutson TE, Tomczak P, et al. Sunitinib versus interferon alfa in metastatic renal-cell carcinoma. N Engl J Med. 2007;356(2):115–124. | ||
Scientific discussion: Torisel. 2007. Available from: http://www.ema.europa.eu/docs/en_GB/document_library/EPAR_-_Scientific_Discussion/human/000799/WC500039915.pdf. Accessed November 18, 2016. | ||
ClinicalTrials.gov Identifier: NCT00065468. Study evaluating interferon and CCI-779 in advanced renal cell carcinoma (ARCC). 2003. Available from: https://clinicaltrials.gov/ct2/show/results/NCT00065468?term=NCT00065468&rank=1§=X01256#all. Accessed November 18, 2016. | ||
Torisel Kit (temsirolimus) injection, for intravenous infusion only [prescribing information]. Philadelphia, PA: Wyeth Pharmaceuticals Inc.; 2015. Available from: http://www.accessdata.fda.gov/drugsatfda_docs/label/2015/022088s018lbl.pdf. Accessed November 18, 2016. | ||
Assessment report for Abraxane (paclitaxel). Procedure no. EMEA/H/C/778. 2007. Available from: http://www.ema.europa.eu/docs/en_GB/document_library/EPAR_-_Public_assessment_report/human/000778/WC500020433.pdf. Accessed November 18, 2016. | ||
Abraxane 5 mg/ml powder for suspension for infusion [summary of product characteristics]. Uxbridge, UK: Celgene Europe Limited. Available from: http://www.ema.europa.eu/docs/en_GB/document_library/EPAR_-_Product_Information/human/000778/WC500020435.pdf. Accessed November 18, 2016. | ||
Gradishar WJ, Tjulandin S, Davidson N, et al. Phase III trial of nanoparticle albumin-bound paclitaxel compared with polyethylated castor oil-based paclitaxel in women with breast cancer. J Clin Oncol. 2005;23(31):7794–7803. | ||
Scientific discussion: Xeloda. 2005. Available from: http://www.ema.europa.eu/docs/en_GB/document_library/EPAR_-_Scientific_Discussion/human/000316/WC500058145.pdf. Accessed November 18, 2016. | ||
Xeloda (capecitabine) tablets, for oral use [prescribing information]. South San Francisco, CA: Genentech USA, Inc.; 2015. Available from: http://www.accessdata.fda.gov/drugsatfda_docs/label/2015/020896s037lbl.pdf. Accessed November 18, 2016. | ||
Cortes J, O’Shaughnessy J, Loesch D, et al. Eribulin monotherapy versus treatment of physician’s choice in patients with metastatic breast cancer (EMBRACE): a phase 3 open-label randomised study. Lancet. 2011;377(9769):914–923. | ||
Eribulin 0.44 mg/mL solution for injection (Halaven®). SMC No. 726/11. 2011. Available from: http://www.scottishmedicines.org.uk/files/advice/eribulin_Halaven_FINAL_September_2011_for_website.pdf. Accessed November 18, 2016. | ||
Halaven 0.44 mg/ml solution for injection [summary of product characteristics]. Hatfield, Hertfordshire, UK: Eisai Europe Ltd; 2015. Available from: http://www.ema.europa.eu/docs/en_GB/document_library/EPAR_-_Product_Information/human/002084/WC500105112.pdf. Accessed November 18, 2016. | ||
Assessment report: Halaven eribulin. Procedure no. EMEA/H/C/002084/II/0011. 2014. Available from: http://www.ema.europa.eu/docs/en_GB/document_library/EPAR_-_Assessment_Report_-_Variation/human/002084/WC500170478.pdf. Accessed November 18, 2016. | ||
Herceptin 150 mg powder for concentrate for solution for infusion [summary of product characteristics]. Welwyn Garden City: Roche Registration Limited. Available from: http://www.ema.europa.eu/docs/en_GB/document_library/EPAR_-_Product_Information/human/000278/WC500074922.pdf. Accessed November 18, 2016. | ||
M77001. A multicenter, randomized comparative study on the efficacy and safety of Herceptin (trastuzumab) plus docetaxel (Taxotere) versus docetaxel alone as first line treatment in patients with HER2-positive metastatic breast cancer. Available from: http://www.roche-trials.com/studyResultGet.action?studyResultNumber=M77001. Accessed November 18, 2016. | ||
Marty M, Cognetti F, Maraninchi D, et al. Randomized phase II trial of the efficacy and safety of trastuzumab combined with docetaxel in patients with human epidermal growth factor receptor 2–positive metastatic breast cancer administered as first-line treatment: the M77001 study group. J Clin Oncol. 2005;23:4265–4274. | ||
CHMP assessment report: Herceptin (trastuzumab). Procedure no. EMEA/H/C/000278. 2013. Available from: http://www.ema.europa.eu/docs/en_GB/document_library/EPAR_-_Assessment_Report_-_Variation/human/000278/WC500153233.pdf. Accessed November 18, 2016. | ||
Herceptin® (trastuzumab) intravenous infusion [prescribing information]. South San Francisco, CA: Genentech, Inc.; 2015. Available from: http://www.accessdata.fda.gov/drugsatfda_docs/label/2015/103792s5327lbl.pdf. Accessed November 18, 2016. | ||
Assessment report: Kadcyla (trastuzumab emtansine). Procedure no. EMEA/H/C/002389/0000. 2013. Available from: http://www.ema.europa.eu/docs/en_GB/document_library/EPAR_-_Public_assessment_report/human/002389/WC500158595.pdf. Accessed November 18, 2016. | ||
Kadcyla® (ado-trastuzumab emtansine) for injection, for intravenous use [prescribing information]. South San Francisco, CA: Genentech, Inc.; 2015. Available from: http://www.accessdata.fda.gov/drugsatfda_docs/label/2015/125427s087lbl.pdf. Accessed November 18, 2016. | ||
Verma S, Miles D, Gianni L, et al. Trastuzumab emtansine for HER2-positive advanced breast cancer. N Engl J Med. 2012;367(19):1783–1791. | ||
Kadcyla 100 mg, 160 mg powder for concentrate for solution for infusion [summary of product characteristics]. Welwyn Garden City: Roche Registration Limited. Available from: http://www.ema.europa.eu/docs/en_GB/document_library/EPAR_-_Product_Information/human/002389/WC500158593.pdf. Accessed November 18, 2016. | ||
Baselga J, Cortés J, Kim SB, et al. Pertuzumab plus trastuzumab plus docetaxel for metastatic breast cancer. N Engl J Med. 2012;366(2):109–119. | ||
Perjeta® (pertuzumab) injection, for intravenous use [prescribing information]. South San Francisco, CA: Genentech, Inc.; 2015. Available from: http://www.accessdata.fda.gov/drugsatfda_docs/label/2015/125409s105lbl.pdf. Accessed November 18, 2016. | ||
Pertuzumab 30 mg/mL concentrate for solution for infusion (Perjeta®). SMC No. 897/13. 2013. Available from: http://www.scottishmedicines.org.uk/files/advice/pertuzumab_Perjeta_FINAL_September_2013_Amended_041013_website.pdf. Accessed November 18, 2016. | ||
Perjeta 420 mg concentrate for solution for infusion [summary of product characteristics]. Welwyn Garden City: Roche Registration Limited. Available from: http://www.ema.europa.eu/docs/en_GB/document_library/EPAR_-_Product_Information/human/002547/WC500140980.pdf. Accessed November 18, 2016. | ||
Assessment report: Perjeta (pertuzumab). Procedure no. EMEA/H/C/002547/II/0010. 2015. Available from: http://www.ema.europa.eu/docs/en_GB/document_library/EPAR_-_Assessment_Report_-_Variation/human/002547/WC500191986.pdf. Accessed November 18, 2016. | ||
Ellis PA, Barrios CH, Eiermann W, et al. Phase III, randomized study of trastuzumab emtansine (T-DM1) ± pertuzumab (P) vs trastuzumab + taxane (HT) for first-line treatment of HER2-positive MBC: primary results from the MARIANNE study. J Clin Oncol. 2015;33:abstr 507. | ||
Schwartzberg LS, Franco SX, Florance A, O’Rourke L, Maltzman J, Johnston S. Lapatinib plus letrozole as first-line therapy for HER-2+ hormone receptor–positive metastatic breast cancer. Oncologist. 2010;15(2):122–129. | ||
Assessment report for Tyverb (lapatinib). Procedure no. EMA/H/C/795/II/0004. Available from: http://www.ema.europa.eu/docs/en_GB/document_library/EPAR_-_Assessment_Report_-_Variation/human/000795/WC500091824.pdf. Accessed November 18, 2016. | ||
Cameron D, Casey M, Press M, et al. A phase III randomized comparison of lapatinib plus capecitabine versus capecitabine alone in women with advanced breast cancer that has progressed on trastuzumab: updated efficacy and biomarker analyses. Breast Cancer Res Treat. 2008;112(3):533–543. | ||
Cameron D, Casey M, Oliva C, Newstat B, Imwalle B, Geyer CE. Lapatinib plus capecitabine in women with HER-2–positive advanced breast cancer: final survival analysis of a phase III randomized trial. Oncologist. 2010;15(9):924–934. | ||
Assessment report for Tykerb (lapatinib). Procedure no. EMEA/H/C/795. 2008. Available from: http://www.ema.europa.eu/docs/en_GB/document_library/EPAR_-_Public_assessment_report/human/000795/WC500044960.pdf. Accessed November 18, 2016. | ||
Lapatinib, 250 mg film-coated tablets (Tyverb). SMC No. 526/09. 2010. Available from: http://www.scottishmedicines.org.uk/files/lapatinib_Tyverb_RESUBMISSION_Final_June_2010.pdf. Accessed November 18, 2016. | ||
Avastin 25 mg/ml concentrate for solution for infusion [summary of product characteristics]. Welwyn Garden City: Roche Registration Limited. Available from: http://www.ema.europa.eu/docs/en_GB/document_library/EPAR_-_Product_Information/human/000582/WC500029271.pdf. Accessed November 18, 2016. | ||
Saltz LB, Clarke S, Díaz-Rubio E, et al. Bevacizumab in combination with oxaliplatin-based chemotherapy as first-line therapy in metastatic colorectal cancer: a randomized phase III study. J Clin Oncol. 2008;26(12):2013–2019. | ||
Hurwitz HI, Yi J, Ince W, Novotny WF, Rosen O. The clinical benefit of bevacizumab in metastatic colorectal cancer is independent of K-ras mutation status: analysis of a phase III study of bevacizumab with chemotherapy in previously untreated metastatic colorectal cancer. Oncologist. 2009;14(1):22–28. | ||
Bevacizumab, 100 mg and 400 mg vials (Avastin®). SMC No. 469/08. 2008. Available from: http://www.scottishmedicines.org.uk/files/bevacizumab_Avastin_FINAL_May_2008_for_website.pdf. Accessed November 18, 2016. | ||
Van CE, Hoff PM, Harper P, et al. Oral capecitabine vs intravenous 5-fluorouracil and leucovorin: integrated efficacy data and novel analyses from two large, randomised, phase III trials. Br J Cancer. 2004;90(6):1190–1197. | ||
Van CE, Lenz HJ, Köhne CH, et al. Fluorouracil, leucovorin, and irinotecan plus cetuximab treatment and RAS mutations in colorectal cancer. J Clin Oncol. 2015;33(7):692–700. | ||
Erbitux 5 mg/mL solution for infusion [summary of product characteristics]. Darmstadt, Germany: Merck KGaA. Available from: http://www.ema.europa.eu/docs/en_GB/document_library/EPAR_-_Product_Information/human/000558/WC500029119.pdf. Accessed November 18, 2016. | ||
Cetuximab, 100 mg/20 mL and 500 mg/100 mL solution for intravenous infusion (Erbitux). SMC No. 543/09. 2010. Available from: http://www.scottishmedicines.org.uk/files/cetuximab_Erbitux_RESUBMISSION_FINAL_January_2010_for_website.pdf. Accessed November 18, 2016. | ||
Ebbitux® (cetuximab) injection, for intravenous infusion [prescribing information]. Branchburg, NJ: ImClone LLC; 2015. Available from: http://www.accessdata.fda.gov/drugsatfda_docs/label/2015/125084s262lbl.pdf. Accessed November 18, 2016. | ||
Van CE, Köhne CH, Láng I, et al. Cetuximab plus irinotecan, fluorouracil, and leucovorin as first-line treatment for metastatic colorectal cancer: updated analysis of overall survival according to tumor KRAS and BRAF mutation status. J Clin Oncol. 2011;29(15):2011–2019. | ||
Grothey A, Van CE, Sobrero A, et al. Regorafenib monotherapy for previously treated metastatic colorectal cancer (CORRECT): an international, multicentre, randomised, placebo-controlled, phase 3 trial. Lancet. 2013;381(9863):303–312. | ||
Assessment report: Stivarga (regorafenib). Procedure no. EMEA/H/C/002573/0000. 2013. Available from: http://www.ema.europa.eu/docs/en_GB/document_library/EPAR_-_Public_assessment_report/human/002573/WC500149166.pdf. Accessed November 18, 2016. | ||
Stivarga® (regorafenib) tablets, for oral use [prescribing information]. Whippany, NJ: Bayer HealthCare Pharmaceuticals Inc.; 2015. Available from: http://www.accessdata.fda.gov/drugsatfda_docs/label/2015/203085s004lbl.pdf. Accessed November 18, 2016. | ||
135.Lonsurf (trifluridine and tipiracil) tablets, for oral use [prescribing information]. Princeton, NJ: Taiho Oncology, Inc.; 2015. Available from: http://www.accessdata.fda.gov/drugsatfda_docs/label/2015/207981s000lbl.pdf. Accessed November 18, 2016. | ||
Assessment report: Lonsurf (trifluridine / tipiracil). Procedure no. EMEA/H/C/003897/0000. 2016. Available from: http://www.ema.europa.eu/docs/en_GB/document_library/EPAR_-_Public_assessment_report/human/003897/WC500206248.pdf. Accessed November 18, 2016. | ||
Mayer RJ, Van CE, Falcone A, et al. Randomized trial of TAS-102 for refractory metastatic colorectal cancer. N Engl J Med. 2015;372(20):1909–1919. | ||
Douillard JY, Siena S, Cassidy J, et al. Randomized, phase III trial of panitumumab with infusional fluorouracil, leucovorin, and oxaliplatin (FOLFOX4) versus FOLFOX4 alone as first-line treatment in patients with previously untreated metastatic colorectal cancer: the PRIME study. J Clin Oncol. 2010;28(31):4697–4705. | ||
Douillard JY, Oliner KS, Siena S, et al. Panitumumab-FOLFOX4 treatment and RAS mutations in colorectal cancer. N Engl J Med. 2013;369(11):1023–1034. | ||
Douillard JY. The role of EGFR inhibition in mCRC. Presented at: ESMO Preceptorship in Colorectal Cancer 2015; March 28, 2015; Singapore. | ||
Vectibix® (panitumumab) injection for intravenous infusion [prescribing information]. Thousand Oaks, CA: Amgen Inc.; 2015. Available from: http://www.accessdata.fda.gov/drugsatfda_docs/label/2015/125147s200lbl.pdf. Accessed November 18, 2016. | ||
Assessment report for Zaltrap (aflibercept). Procedure no. EMEA/H/C/002532. 2012. Available from: http://www.ema.europa.eu/docs/en_GB/document_library/EPAR_-_Public_assessment_report/human/002532/WC500139710.pdf. Accessed November 18, 2016. | ||
Zaltrap® (ziv-aflibercept) injection for intravenous infusion [prescribing information]. Bridgewater, NJ: sanofi-aventis U.S. LLC; 2013. Available from: http://www.accessdata.fda.gov/drugsatfda_docs/label/2013/125418s020lbl.pdf. Accessed November 18, 2016. | ||
Aflibercept 25 mg/mL concentrate for solution for infusion (Zaltrap®). SMC No. 878/13. 2014. Available from: http://www.scottishmedicines.org.uk/files/advice/aflibercept_Zaltrap_Resubmission_FINAL_February_2014_for_website.pdf. Accessed November 18, 2016. | ||
Fizazi K, Scher HI, Molina A, et al. Abiraterone acetate for treatment of metastatic castration-resistant prostate cancer: final overall survival analysis of the COU-AA-301 randomised, double-blind, placebo-controlled phase 3 study. Lancet Oncol. 2012;13(10):983–992. | ||
Assessment report for Zytiga (abiraterone). Procedure no. EMEA/H/C/002321. 2011. Available from: http://www.ema.europa.eu/docs/en_GB/document_library/EPAR_-_Public_assessment_report/human/002321/WC500112860.pdf. Accessed November 18, 2016. | ||
Zytiga® (abiraterone acetate) tablets for oral administration [prescribing information]. Horsham, PA: Janssen Biotech, Inc.; 2015. Available from: http://www.accessdata.fda.gov/drugsatfda_docs/label/2015/202379s018lbl.pdf. Accessed November 18, 2016. | ||
Abiraterone acetate 250 mg tablets (Zytiga®). SMC No. 764/12. 2012. Available from: http://www.scottishmedicines.org.uk/files/advice/abiraterone_Zytiga_RESUBMISSION_FINAL_July_2012_Amended_For_website.pdf. Accessed November 18, 2016. | ||
Summary of product characteristics of Zytiga 250 mg tablets. Beerse, Belgium: Janssen-Cilag International NV. Available from: http://www.ema.europa.eu/docs/en_GB/document_library/EPAR_-_Product_Information/human/002321/WC500112858.pdf. Accessed November 18, 2016. | ||
Ryan CJ, Smith MR, de Bono JS, et al. Abiraterone in metastatic prostate cancer without previous chemotherapy. N Engl J Med. 2013;368(2):138–148. | ||
Ryan CJ, Smith MR, Fizazi K, et al. Abiraterone acetate plus prednisone versus placebo plus prednisone in chemotherapy-naive men with metastatic castration-resistant prostate cancer (COU-AA-302): final overall survival analysis of a randomised, double-blind, placebo-controlled phase 3 study. Lancet Oncol. 2015;16(2):152–160. | ||
Assessment report: Zytiga (abiraterone). Procedure no. EMEA/H/C/002321/II/0004/G. 2012. Available from: http://www.ema.europa.eu/docs/en_GB/document_library/EPAR_-_Assessment_Report_-_Variation/human/002321/WC500137814.pdf. Accessed November 18, 2016. | ||
Abiraterone acetate 250 mg tablets (Zytiga®). SMC No. 873/13. 2015. Available from: http://www.scottishmedicines.org.uk/files/advice/abiraterone__Zytiga__IRP_FINAL_Sept_2015_for_website.pdf. Accessed November 18, 2016. | ||
Sartor AO, Oudard S, Sengelov L, et al. Cabazitaxel vs docetaxel in chemotherapy-naive (CN) patients with metastatic castration-resistant prostate cancer (mCRPC): a three-arm phase III study (FIRSTANA). J Clin Oncol. 2016;34:abstr 5006. | ||
CHMP assessment report for Xtandi (enzalutamide). Procedure no. EMEA/H/C/002639. 2013. Available from: http://www.ema.europa.eu/docs/en_GB/document_library/EPAR_-_Public_assessment_report/human/002639/WC500144998.pdf. Accessed November 18, 2016. | ||
Assessment report: Xtandi. Procedure no. EMEA/H/C/002639/II/0008. 2014. Available from: http://www.ema.europa.eu/docs/en_GB/document_library/EPAR_-_Assessment_Report_-_Variation/human/002639/WC500180617.pdf. Accessed November 18, 2016. | ||
Xtandi® (enzalutamide) capsules for oral use [prescribing information]. Northbrook, IL: Astellas Pharma US, Inc.; 2015. Available from: http://www.accessdata.fda.gov/drugsatfda_docs/label/2015/203415s005lbl.pdf. Accessed November 18, 2016. | ||
Beer TM, Armstrong AJ, Sternberg CN, et al. Enzalutamide (ENZA) in men with chemotherapy-naïve metastatic castration-resistant prostate cancer (mCRPC): final analysis of the phase 3 PREVAIL study. J Clin Oncol. 2015;33:abstr 5036. | ||
Scher HI, Fizazi K, Saad F, et al. Increased survival with enzalutamide in prostate cancer after chemotherapy. N Engl J Med. 2012;367(13):1187–1197. | ||
Enzalutamide 40mg soft capsules (Xtandi®). SMC No. 911/13. 2013. Available from: http://www.scottishmedicines.org.uk/files/advice/enzalutamide_Xtandi_FINAL_October_2013_Amended_08.11.13.pdf. Accessed November 18, 2016. | ||
Assessment report: Xofigo (radium-223 dichloride). Procedure no. EMEA/H/C/002653/0000. 2013. Available from: http://www.ema.europa.eu/docs/en_GB/document_library/EPAR_-_Public_assessment_report/human/002653/WC500156174.pdf. Accessed November 18, 2016. | ||
Xofigo (radium Ra 223 dichloride) injection, for intravenous use [prescribing information]. Wayne, NJ: Bayer HealthCare Pharmaceuticals Inc.; 2013. Available from: http://www.accessdata.fda.gov/drugsatfda_docs/label/2013/203971lbl.pdf. Accessed November 18, 2016. | ||
Parker C, Nilsson S, Heinrich D, et al. Alpha emitter radium-223 and survival in metastatic prostate cancer. N Engl J Med. 2013;369(3):213–223. | ||
Kantoff PW, Higano CS, Shore ND, et al. Sipuleucel-T immunotherapy for castration-resistant prostate cancer. N Engl J Med. 2010;363(5):411–422. | ||
Provenge® (sipuleucel-T) suspension for intravenous infusion. Seattle, WA: Dendreon Corporation; 2010. Available from: http://www.fda.gov/downloads/BiologicsBloodVaccines/CellularGeneTherapyProducts/ApprovedProducts/UCM210031.pdf. Accessed November 18, 2016. |
 © 2019 The Author(s). This work is published and licensed by Dove Medical Press Limited. The
full terms of this license are available at https://www.dovepress.com/terms
and incorporate the Creative Commons Attribution
- Non Commercial (unported, 3.0) License.
By accessing the work you hereby accept the Terms. Non-commercial uses of the work are permitted
without any further permission from Dove Medical Press Limited, provided the work is properly
attributed. For permission for commercial use of this work, please see paragraphs 4.2 and 5 of our Terms.
© 2019 The Author(s). This work is published and licensed by Dove Medical Press Limited. The
full terms of this license are available at https://www.dovepress.com/terms
and incorporate the Creative Commons Attribution
- Non Commercial (unported, 3.0) License.
By accessing the work you hereby accept the Terms. Non-commercial uses of the work are permitted
without any further permission from Dove Medical Press Limited, provided the work is properly
attributed. For permission for commercial use of this work, please see paragraphs 4.2 and 5 of our Terms.