Back to Journals » Risk Management and Healthcare Policy » Volume 13
Relationships Between Eating Behaviors and Hand Grip Strength Among Chinese Adults: A Population-Based Cross-Sectional Study
Authors Ding L ![]() , Yin J, Zhang W, Wu Z, Chen S
, Yin J, Zhang W, Wu Z, Chen S
Received 3 May 2020
Accepted for publication 31 July 2020
Published 20 August 2020 Volume 2020:13 Pages 1245—1252
DOI https://doi.org/10.2147/RMHP.S261093
Checked for plagiarism Yes
Review by Single anonymous peer review
Peer reviewer comments 3
Editor who approved publication: Professor Marco Carotenuto
Liang Ding,1 Jianjun Yin,2 Wenbo Zhang,3 Ziqiang Wu,4 Shulei Chen4
1Department of Physical Education, Southeast University, Nanjing, People’s Republic of China; 2Department of Physical Education, Guangdong University of Finance and Economics, Guangzhou, People’s Republic of China; 3Department of Physical Education, Changchun Institute of Education, Changchun, People’s Republic of China; 4Department of Physical Education, Dalian Institute of Science and Technology, Dalian, People’s Republic of China
Correspondence: Liang Ding
Department of Physical Education, Southeast University, 2 Sipailou, Nanjing 210009, People’s Republic of China
Email [email protected]
Purpose: Poor eating behaviors are associated with imbalances in energy and food intake, which may directly or indirectly contribute to muscle strength loss. This study aimed to investigate the association between eating behaviors and hand grip strength in Chinese adults.
Materials and Methods: We designed and conducted a cross-sectional study of 2009 Chinese individuals aged 25– 65 years in 2017. Eating behaviors, including breakfast consumption, snacking after dinner, and eating rate, were assessed using a self-administered questionnaire. Hand grip strength was assessed using a digital grip dynamometer. Age, sex, BMI, physical activity, educational level, occupation, living status, sleep duration, smoking and drinking status, hypertension, diabetes, and depressive symptoms were used as confounding factors.
Results: After final adjustments for confounding factors, grip strength was measured as 35.2 (95% confidence interval [CI]: 34.7– 35.8), 36.0 (95% CI: 35.6– 36.4), and 36.9 (95% CI: 36.6– 37.3) for those who skipped, occasionally ate, and regularly ate breakfast, respectively (p for trend < 0.001). Those who always, sometimes, and seldom snacked after dinner (p for trend < 0.001) reported the following grip strength: 34.7 (95% CI: 34.0– 35.3), 36.2 (95% CI: 35.8– 36.6), and 36.9 (95% CI: 36.6– 37.2), respectively. Significant associations were not found between eating rate and grip strength.
Conclusion: This study showed that higher frequency of breakfast consumption and lower frequency of snacking after dinner were associated with higher grip strength in Chinese adults. Therefore, eating behaviors may be involved in muscle function.
Keywords: breakfast consumption, eating rate, snacking after dinner, grip strength, adult population
Introduction
Muscle strength loss has been found to be associated with functional impairment,1 disability,2 falls,3 and loss of independence.4 Thus, it is well known that muscle strength is a strong predictor of human health. Meanwhile, grip strength is an assessment technique recommended for the measurement of muscle strength and is the simplest method for assessing muscle function in clinical practice.5 Low grip strength was also indicated to be associated with the presence of chronic diseases,6 falls,7 and disability.8 In addition, a six-year follow-up study has demonstrated that, even in middle-aged individuals, the risk of mortality in those with lower grip strength is more than twice that of those with higher grip strength.9 Therefore, preventing grip strength decline is important for well-being.
Meanwhile, eating behaviors are critical for human health and are associated with many health outcomes. In a Japanese study, people with more than two unhealthy eating behaviors showed a higher incidence of depressive symptoms compared with those with fewer than two unhealthy eating behaviors.10 In a different study, self-reported eating rate was positively associated with the presence of metabolic syndrome in Japanese men and women.11 Other studies have also shown that night eating can cause nutritional imbalance,12 and compared with irregular breakfast consumption, regular breakfast consumption contributes to higher nutrient intake, such as dietary fiber, iron, calcium, and folate.13 As such, night eating and irregular breakfast consumption may contribute to grip strength decrease owing to nutrient imbalance; indeed, nutrition deficiency is a well-known predictor of low muscle function and muscle strength loss14,15 A high frequency of breakfast consumption is also associated with high physical activity (PA),16,17 which can improve grip strength and prevent strength loss. Based on these findings, it is possible that eating behaviors may affect grip strength. However, few studies have directly examined the relation between eating behaviors and grip strength. A population-based study has indicated that an increase in the components of unhealthy eating habits is associated with poor aerobic fitness and lower limb muscle power in primary school children.18 In addition, breakfast consumption frequency has been associated with grip strength and physical fitness in Japanese adults19 and Chinese university students.20 However, the association between snacking after dinner, eating rate, frequency of breakfast (three representative eating behaviors), and grip strength in Chinese adults is unclear. Therefore, we designed a cross-sectional study to investigate whether eating behaviors are associated with hand grip strength in Chinese adults.
Methods
Participants
This study used 2017 data from an annual health examination for adults conducted with self-report questionnaires in Pingfang District, Haerbin, China. In this study, 2323 participants provided their written informed consent for the analysis of their data. This study was conducted according to the guidelines of the Declaration of Helsinki. The protocol for the study was approved by the Human Investigation Ethics Committee of Dalian Institute of Science and Technology on September 14, 2016 (approval number: DLHR0106).
The sample selection process is described in Figure 1. Responses were excluded if the data for grip strength (n = 98), eating behaviors (n = 30), depressive symptoms (n = 156), and PA (n = 3) were missing. Participants aged >65 years were also excluded (n = 27). The final study population consisted of 2009 participants (men = 1171, women = 838).
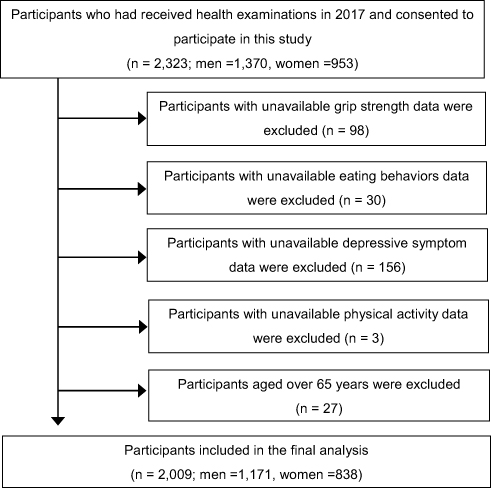 |
Figure 1 Flow chart of the sample selection process. |
Eating Behaviors
Eating behaviors were measured using a self-administered questionnaire that included items on breakfast consumption, snacking after dinner, and eating rate. Frequency of breakfast consumption was determined by the question, “In the past month, how many times did you eat breakfast per week?”21 Snacking after dinner was determined by the question, “In the past month, how many days did you snack after dinner per week?”10 Participants were asked to report the frequency of their breakfast consumption and snacking after dinner by responding with “never,” “once per week,” to “7 times per week.” Regarding breakfast consumption, the participants were categorized as regular consumers (6–7 times per week), occasional consumers (2–5 times per week), and skippers (less than two times per week). Regarding snacking after dinner, participants were categorized as “always” (6–7 times per week), “sometimes” (2–5 times per week), and “seldom” (less than two times per week). Eating rate was examined using the following question: Compared to others, how quickly do you eat?22 The participants responded by choosing from the following five categories: very slowly, relatively slowly, at a moderate speed, relatively quickly, and very quickly. Because the number of participants was too small in the very slowly and very quickly categories, we combined the very slow and relatively slow categories to form one slow category, and the relatively quickly and very quickly categories to form one fast category.
Hand Grip Strength
Hand grip strength was measured using a digital grip dynamometer (WCS-100 Qishu Co., Shanghai, China), with participants in the standing position. The dynamometer was adjusted to fit participants’ individual hand sizes. The participants were encouraged to exert maximal grip effort. Grip strength was measured four times: twice for each hand on an alternating basis, with brief intervals between trials. The average value of the highest power recorded for both hands was included in the analysis.23,24
Confounding Variables
Blood pressure (BP) was measured twice using an automatic device, which was applied to the upper-left arm (KENTAROU HBP-9021; OMRON Co., Ltd., Japan) subsequent to rest periods of five minutes in the sitting position. The mean of two measurements was used as the BP value. Hypertension was determined based on a systolic BP of ≥130 mmHg, diastolic BP of ≥80 mmHg, or use of antihypertensive medication.25 Fasting glucose was measured from the blood sample, and diabetes was determined based on a fasting blood glucose concentration of ≥7.0 mmol/L (126 mg/dL) or the use of antidiabetic medication.26 Depressive symptoms were assessed using the Chinese version of the Self-Rating Depression Scale (SDS).27 An SDS score of ≥45 was adopted as the cutoff point indicating relatively mild or severe depressive symptoms.28 Body mass index (BMI) was calculated as weight/height2 (kg/m2). Educational level was assessed by determining the highest school grade completed, and classified into two categories: < college and ≥ college. Occupation was classified into two categories: desk work and other. Information regarding age, sex, smoking status, drinking status, occupation, and living status was obtained via a questionnaire survey. Levels of daily PA were estimated using the International Physical Activity Questionnaire (IPAQ).29 Total daily PA (metabolic equivalents [METs] in h/week) was calculated as follows: 1) walking MET-minutes/week = 3.3 × walking minutes × walking days at work; 2) moderate MET-minutes/week = 4.0 × moderate-intensity minutes × moderate days at work; 3) vigorous MET-minutes/week = 8.0 × vigorous intensity minutes × vigorous days at work. Subsequently, the total MET hour/week was calculated as the sum of walking MET minutes/week, moderate MET minutes/week, and vigorous MET minutes/week divided by 60. PA was categorized into high and low categories.
Statistical Analyses
Descriptive data are presented as means (with 95% confidence intervals [95% CIs]) and percentages. Grip strength was used as a dependent variable, whereas categories of eating behaviors (all in tertiles) were used as independent variables. Differences between eating behavior categories were examined using analysis of variance for continuous variables and logistic regression analysis for proportional variables. An analysis of covariance was performed to examine the correlation between eating behaviors and grip strength in the crude and adjusted models. Model 1 was adjusted for age, sex, and BMI, whereas Model 2 was adjusted for the items in Model 1, as well as hypertension, diabetes, and depressive symptoms. Model 3 was adjusted for the items in Models 1 and 2, as well as PA, education level, occupation, living status, smoking, and drinking habits. These confounding factors were considered because they have direct or indirect effects on eating behaviors or grip strength and have been used in a previous study.30 Bonferroni-corrected p-values were used to compare differences between groups. All statistical analyses were performed using SPSS Statistics version 24.0 for Windows (SPSS, Inc., Chicago, IL, USA). Means and 95% CIs were reported throughout. All p-values for linear trends were calculated using the categories described above; a p-value of <0.05 was considered statistically significant.
Results
The study participants’ characteristics according to eating behaviors are presented in Table 1. Results in this table were obtained using bivariate analysis, by not controlling for confounding factors. Participants with a faster eating rate were more likely to have higher BMI and lower educational level. Participants with a higher frequency of breakfast consumption were older and more likely to be women, smoker, and have high physical activity, higher prevalence of hypertension, and lower prevalence of depressive symptoms. Participants with a high frequency of snacking after dinner were younger and more likely to have higher BMI, lower educational level, lower percentage of desk work, lower prevalence of hypertension and diabetes.
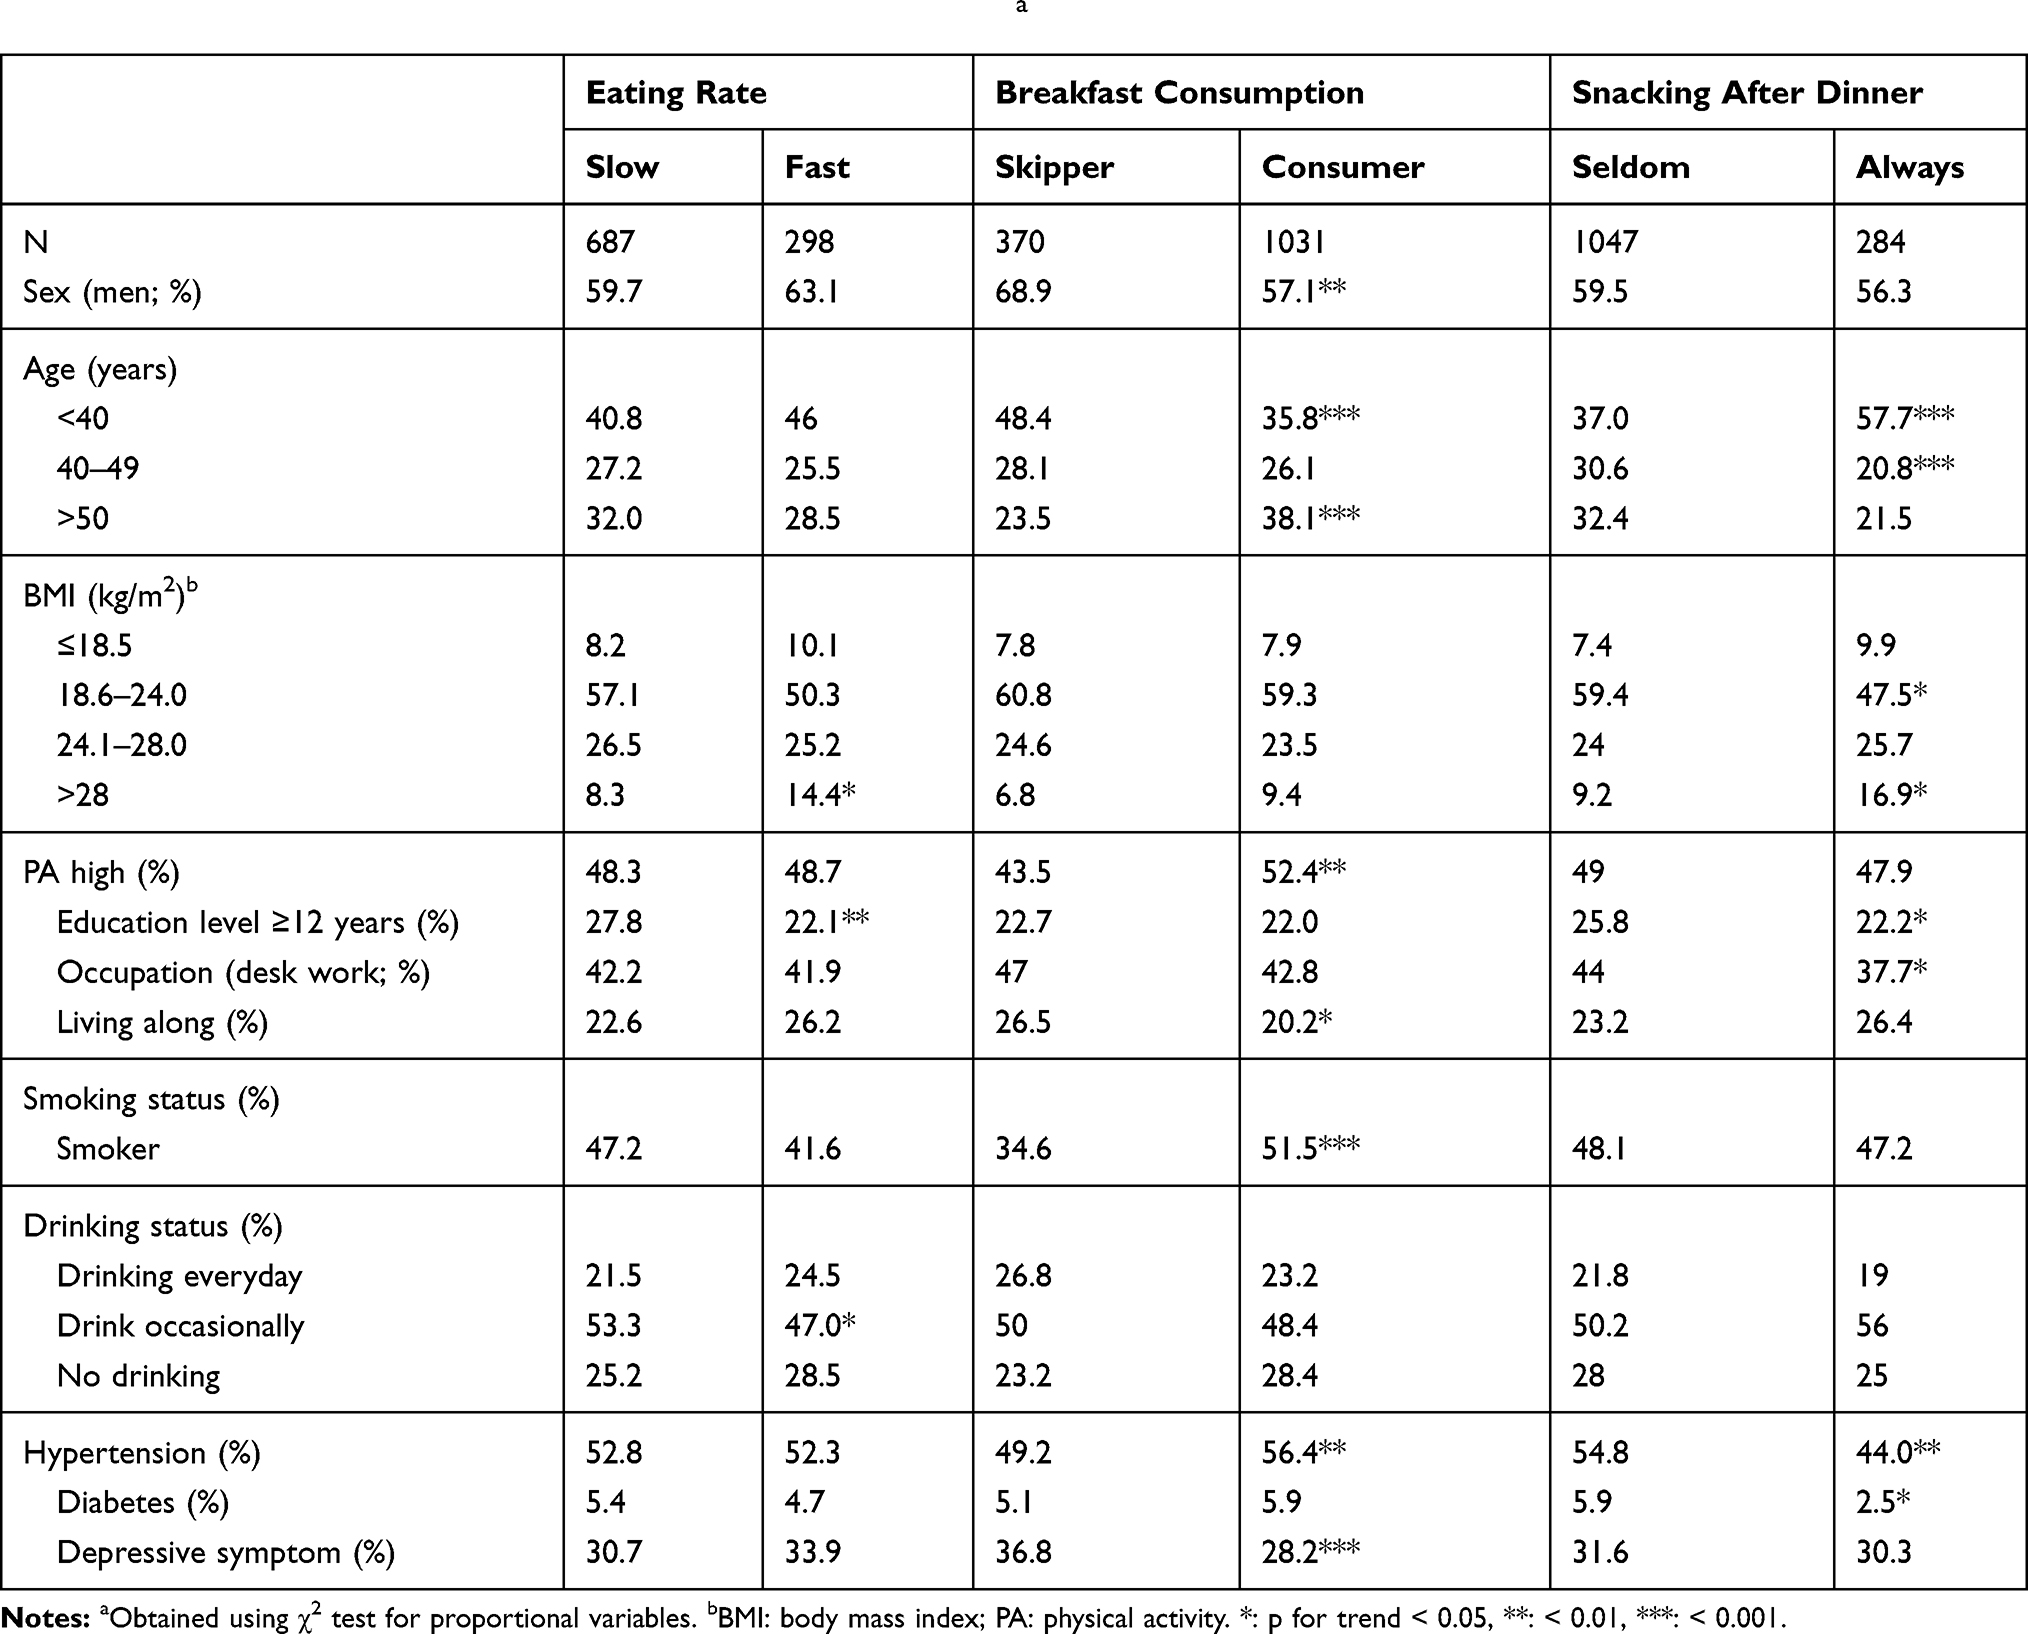 |
Table 1 Participant Characteristics According to Eating Behaviorsa |
Table 2 shows correlations between the three eating behaviors. There is a positive association between the frequency of snacking after dinner and the eating rate. No significant association was found between other variables.
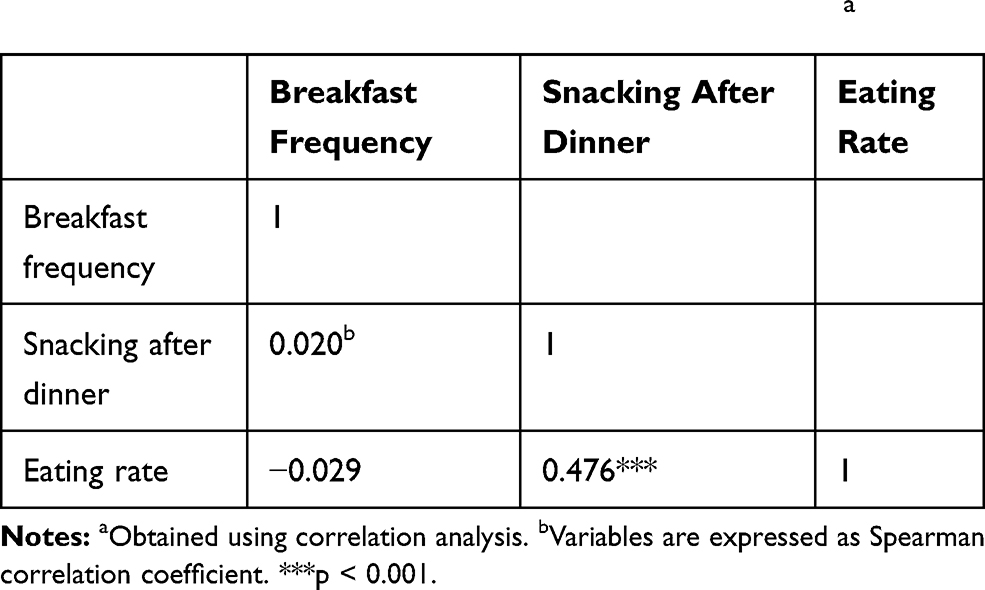 |
Table 2 Correlations Between Three Eating Behaviorsa |
Table 3 shows the adjusted association between eating behaviors and grip strength. In the unadjusted model, grip strength (kg) was measured as 37.1 (36.4–37.7), 35.8 (35.1–36.6), and 34.9 (33.7–36.1) for the seldom, sometimes, and always snacking after dinner categories, respectively (p for trend = 0.001). However, no significant association was observed between breakfast consumption, eating rate, and grip strength. In the model 1, a significantly positive association was found between breakfast consumption and grip strength. Grip strength was higher across the categories of breakfast consumption: 35.2 (34.7, 35.8), 36.0 (35.5, 36.4), and 3.70 (36.6, 37.3) for the skipper, occasional consumer, and regular consumer categories, respectively (p for trend <0.001). Grip strength was higher in the regular consumer category relative to the occasional consumer and skipper categories (Bonferroni-corrected p < 0.05). This significant association did not change in Models 2 and 3. The inverse association between snacking after dinner and grip strength was consistent in the final adjusted model (Model 3) (p for trend <0.001). Grip strength was lower in the always category relative to the sometimes and seldom categories (Bonferroni-corrected p < 0.05). In addition, a significant difference was found between the sometimes and seldom categories (Bonferroni-corrected p < 0.05). Finally, eating rate was not significantly associated with grip strength in Models 1, 2, and 3.
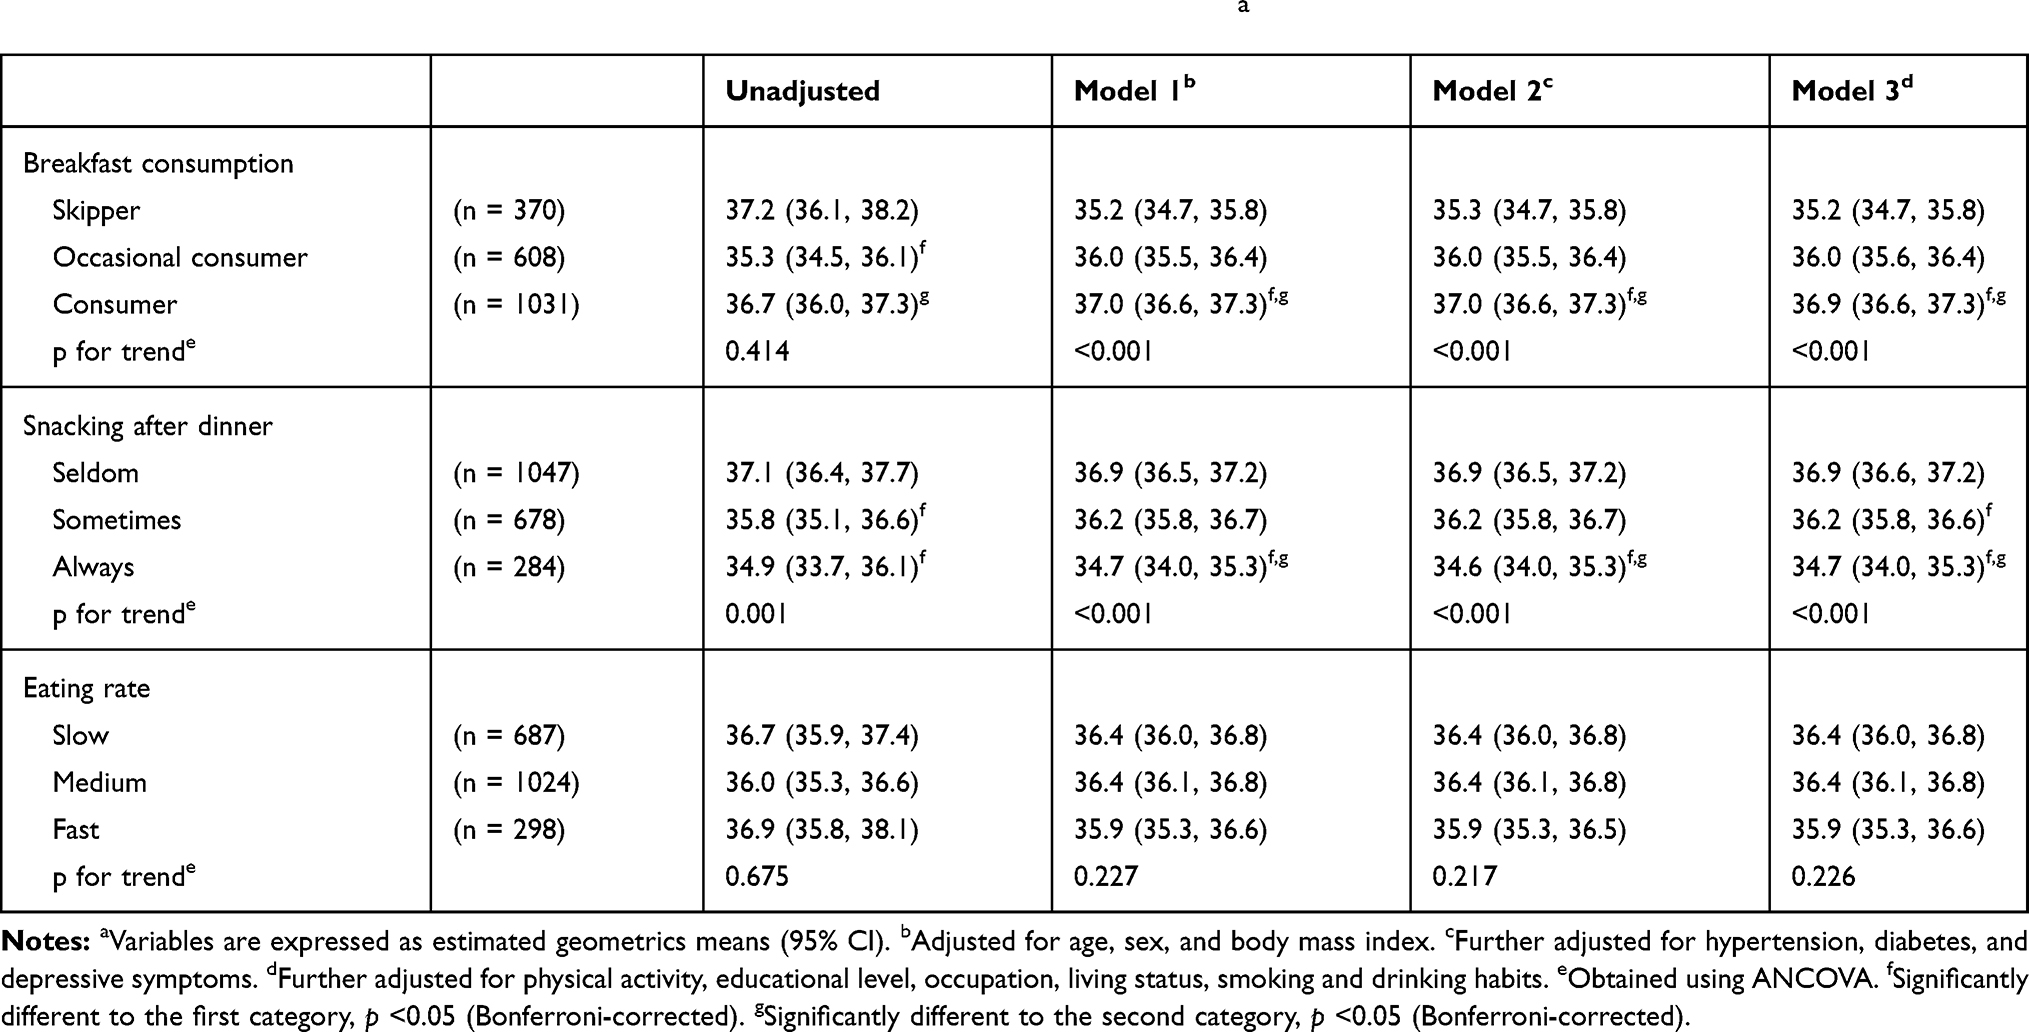 |
Table 3 Adjusted Relationship Between Eating Behaviors and Grip Strength (kg)a |
Previous studies indicated that healthy eating behaviors are associated with higher physical activity. Therefore, we also verified whether this association exists in this study, as shown in Table 4. However, in this study, there was no significant association between eating behaviors and physical activity in the unadjusted and adjusted models.
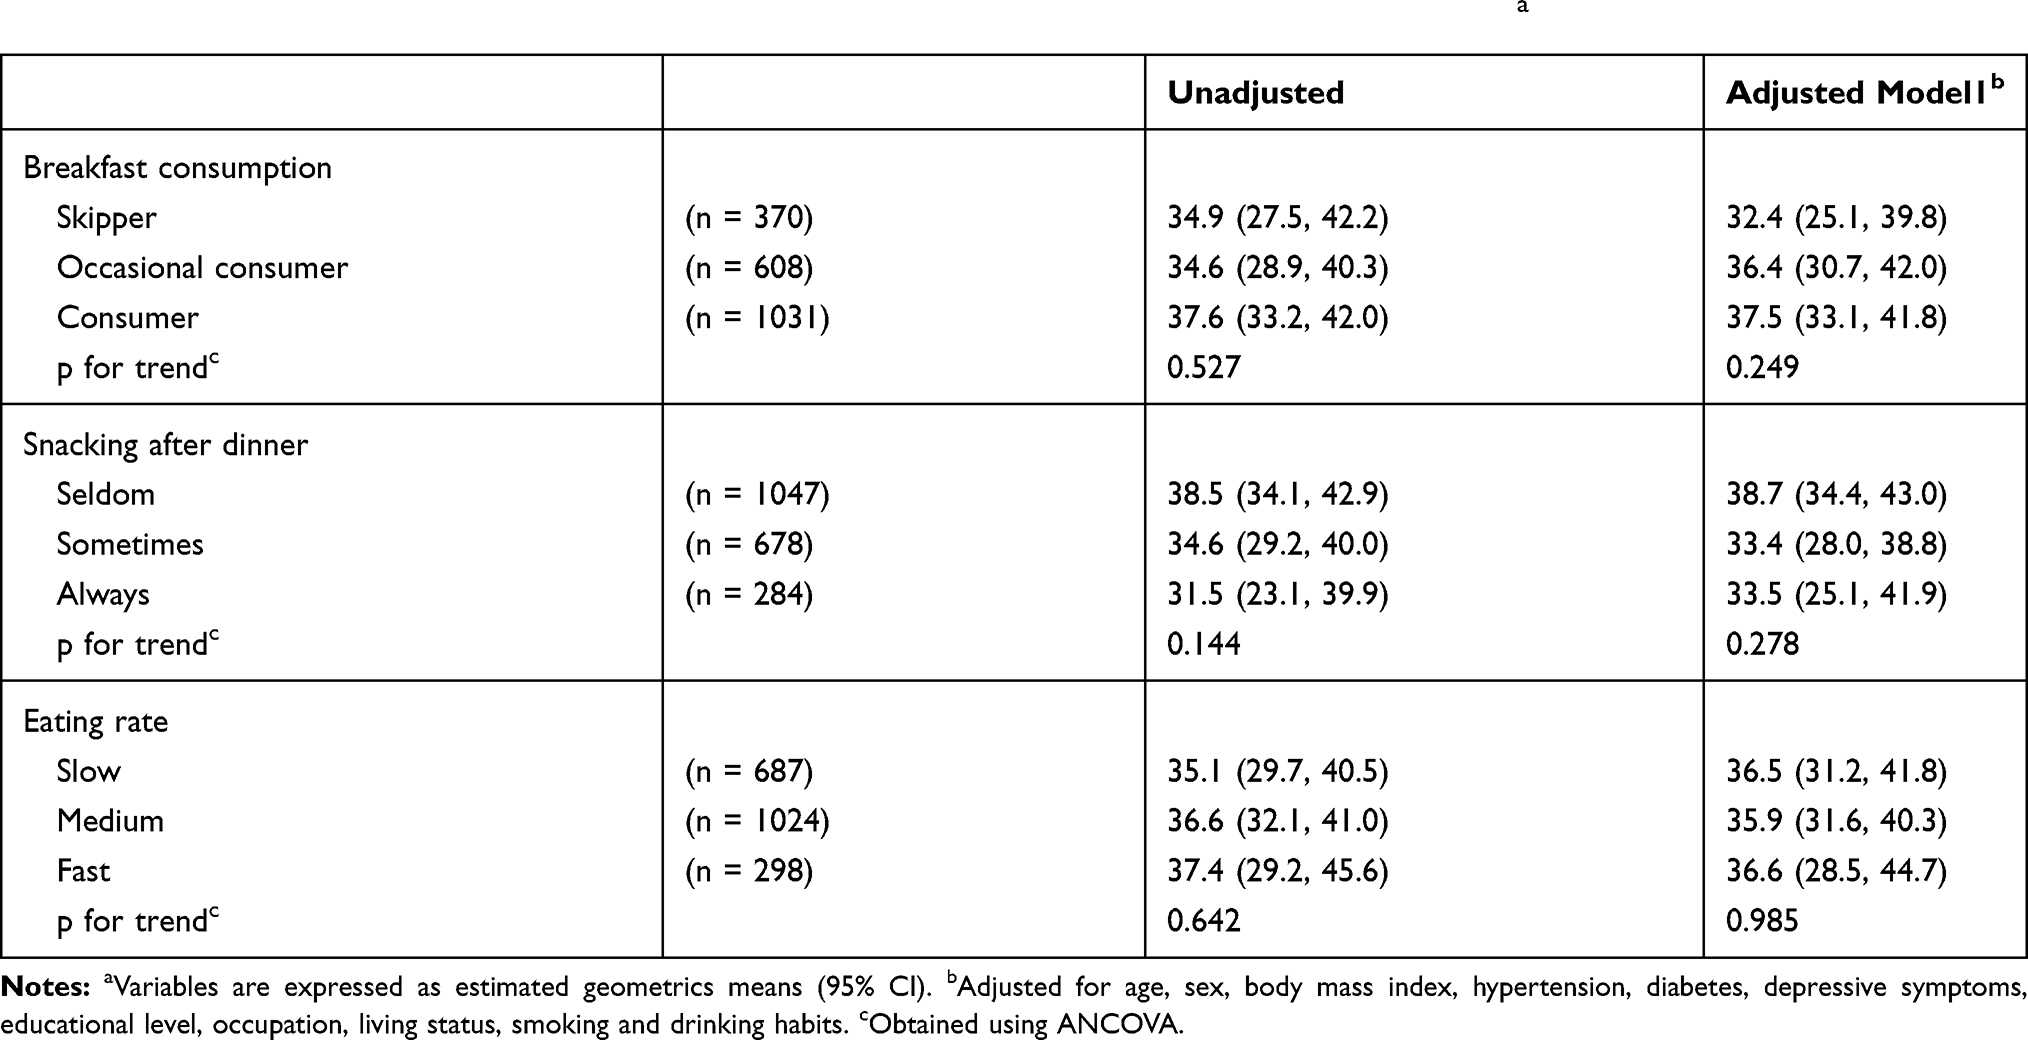 |
Table 4 Adjusted Relationship Between Eating Behaviors and Physical Activity (METs Hour/Week)a |
Discussion
This study showed that a high frequency of breakfast consumption and low frequency of snacking after dinner were significantly associated with higher grip strength in Chinese adults aged 25–68 years. We considered various confounding factors, including age, sex, BMI, health status, and lifestyle. However, after adjusting for these confounding factors, the significant association between eating behaviors and grip strength remained, indicating that such a correlation was independent of these factors.
A Japanese study has shown a significant association between higher breakfast consumption and higher grip strength among 1415 Japanese adults aged 19–83 years.19 A Chinese study among 10,125 college students has also indicated that frequent breakfast consumption is significantly associated with higher grip strength and faster sprint times.20 Despite the difference in samples, the findings of these previous studies are consistent with the present findings. By contrast, our results are inconsistent with a European study that reported that breakfast consumption is not significantly associated with muscular fitness and speed/agility, but is only associated with cardiorespiratory fitness, in 2148 European adolescents aged 12.5–17.5 years.31 The different methods used to assess breakfast consumption and muscle strength or different ages may explain the contrast in the findings. Notably, many studies have focused on children and adolescents, whereas those on adults’ eating behaviors and muscle function are scarce. We could not find any previous study that investigated the association between night eating, eating rate, and grip strength.
To the best of our knowledge, this study is the first to demonstrate an association between self-reported eating behaviors and hand grip strength in Chinese adults. There are several possible explanations for the observation of a relation between eating behaviors and grip strength. First, our primary hypothesis was that eating behaviors would exert a beneficial influence on grip strength, as regular breakfast consumption would lead to higher nutrient intake13 and higher energy intake.17 Nutrient and energy intake is positively associated with muscle strength.32–34 As such, regular breakfast consumption could be associated with higher grip strength. Furthermore, irregular breakfast consumption was indicated to be associated with higher inflammation levels.35 Higher levels of inflammatory cytokine are associated with weaker grip strength.36 Thus, this may also be an explanation. In addition, night eating is not only reported to cause nutritional imbalance but is also associated with poor sleep quality37 and sleep disturbances,38 which are related with poor muscle strength.39,40 This link can also explain why snacking after dinner is associated with grip strength. Another study found that people who have a habit of night eating have lower level of circulating ghrelin,41 a hunger hormone which stimulates appetite. Ghrelin enhanced muscle anabolism and exerted protective effects for muscle atrophy.42 Thus, eating at night may lead to muscle mass loss and consequently decrease grip strength due to the strong positive relationship between muscle mass and muscle strength.43
We also hypothesized that eating behaviors may have a beneficial effect on the prevention of grip strength loss via high PA, because a previous study indicated that a higher frequency of breakfast consumption is associated with a higher PA, and high PA may directly improve muscle strength. Therefore, we examined whether eating behaviors are associated with PA (Table 4) and whether PA affects the association between eating behaviors and grip strength (Table 3) in this study. The results of our study showed a positive linear association between breakfast frequency and PA, and an inverse association between frequency of snacking after dinner and PA. However, these associations were not statistically significant. These results may be inconsistent with those of a previous study.44 In addition, the association between eating behaviors and grip strength did not change after adjusting for PA (as a confounding factor). This proved that PA cannot be attributable to the relationship between eating behaviors and grip strength in this study. Meanwhile, previous studies have indicated that the eating rate is associated with many health behaviors and health outcomes.45,46 However, in this study, we did not find any significant association between eating rate and grip strength.
This study was subject to certain limitations. First, eating behaviors were self-reported—a method that is vulnerable to recall bias. Therefore, the eating rate needs to be measured experimentally in future studies. Second, the cross-sectional design prevented causal inference regarding whether healthy eating behaviors contributed to higher grip strength or participants with a higher grip strength simply tended to eat healthier relative to those with lower grip strength. Therefore, prospective or intervention studies are required to determine the causal relation between eating behaviors and grip strength. Third, the use of the term eating behavior only included breakfast consumption, snacking after dinner, and eating rate. Other aspects of eating behavior were not included. Fourth, participants in our study were only from an area of a city in China; thus, the results of this study may not represent all Chinese adult population. Finally, although we adjusted several confounding factors, we could not exclude the possibility that other covariates might have mediated the association between eating behaviors and grip strength, such as sleep pattern, food, and nutrition intake.
Conclusions
The results of this study indicated that grip strength was lower in Chinese adults who skipped breakfast or ate breakfast occasionally relative to those who regularly had breakfast and was also lower in those who always snacked after dinner relative to those who sometimes and seldom snacked after dinner. This finding suggests that eating behaviors may be correlated with muscular function in adults and provides important information in the field of preventive medicine and health education. Eating behaviors are indispensable in people’s daily life. Maintaining positive eating behaviors is important for human health. In future, a prospective study or randomized trial may confirm these findings and clarify causality.
Acknowledgments
We thank all participants and the Yongkang Medical Examination and Health Monitoring Center for the possibility to perform the study.
Disclosure
The authors report no conflicts and interest in this work.
References
1. Visser M, Kritchevsky SB, Goodpaster BH, et al. Leg muscle mass and composition in relation to lower extremity performance in men and women aged 70 to 79: the health, aging and body composition study. J Am Geriatr Soc. 2002;50(5):897–904. doi:10.1046/j.1532-5415.2002.50217.x
2. Rantanen T, Guralnik JM, Foley D, et al. Midlife hand grip strength as a predictor of old age disability. JAMA. 1999;281(6):558–560. doi:10.1001/jama.281.6.558
3. Lord SR, Ward JA, Williams P, et al. Physiological factors associated with falls in older community-dwelling women. J Am Geriatr Soc. 1994;42(10):1110–1117. doi:10.1111/j.1532-5415.1994.tb06218.x
4. Metter EJ, Talbot LA, Schrager M, et al. Skeletal muscle strength as a predictor of all-cause mortality in healthy men. J Gerontol a Biol Sci Med Sci. 2002;57(10):B359–365. doi:10.1093/gerona/57.10.B359
5. Roberts HC, Denison HJ, Martin HJ, et al. A review of the measurement of grip strength in clinical and epidemiological studies: towards a standardised approach. Age Ageing. 2011;40(4):423–429. doi:10.1093/ageing/afr051
6. Hakkinen A, Hannonen P, Hakkinen K. Muscle strength in healthy people and in patients suffering from recent-onset inflammatory arthritis. Br J Rheumatol. 1995;34(4):355–360. doi:10.1093/rheumatology/34.4.355
7. Sayer AA, Syddall HE, Martin HJ, et al. Falls, sarcopenia, and growth in early life: findings from the Hertfordshire cohort study. Am J Epidemiol. 2006;164(7):665–671. doi:10.1093/aje/kwj255
8. Syddall HE, Martin HJ, Harwood RH, et al. The SF-36: a simple, effective measure of mobility-disability for epidemiological studies. J Nutr Health Aging. 2009;13(1):57–62. doi:10.1007/s12603-009-0010-4
9. Fujita Y, Nakamura Y, Hiraoka J, et al. Physical-strength tests and mortality among visitors to health-promotion centers in Japan. J Clin Epidemiol. 1995;48(11):1349–1359. doi:10.1016/0895-4356(95)00533-1
10. Huang C, Momma H, Cui Y, et al. Independent and combined relationship of habitual unhealthy eating behaviors with depressive symptoms: a prospective study. J Epidemiol. 2017;27(1):42–47. doi:10.1016/j.je.2016.08.005
11. Nagahama S, Kurotani K, Pham NM, et al. Self-reported eating rate and metabolic syndrome in Japanese people: cross-sectional study. BMJ Open. 2014;4(9):e005241. doi:10.1136/bmjopen-2014-005241
12. Kim M, Jeong E, Kim E, et al. Night eating status of university students in partial area of Chungnam. J East Asian Soc Diet Life. 2011;21:563–576.
13. Uzhova I, Mullally D, Penalvo JL, et al. Regularity of breakfast consumption and diet: insights from national adult nutrition survey. Nutrients. 2018;10(11):1578. doi:10.3390/nu10111578
14. Jeejeebhoy KN. Muscle function and nutrition. Gut. 1986;27(Suppl 1):25–39. doi:10.1136/gut.27.suppl_1.25
15. Eglseer D, Poglitsch R, Roller-Wirnsberger RE. Muscle power and nutrition. Z Gerontol Geriatr. 2016;49(2):115–119. doi:10.1007/s00391-015-1008-7
16. Julia KZ-F, Fiona BG, Peter TK, et al. Association between breakfast frequency and physical activity and sedentary time: a cross-sectional study in children from 12 countries. BMC Public Health. 2019;19(1):222. doi:10.1186/s12889-019-6542-6
17. Yoshimura E, Hatamoto Y, Yonekura S, et al. Skipping breakfast reduces energy intake and physical activity in healthy women who are habitual breakfast eaters: a randomized crossover trial. Physiol Behav. 2017;174:89–94. doi:10.1016/j.physbeh.2017.03.008
18. Thivel D, Aucouturier J, Isacco L, et al. Are eating habits associated with physical fitness in primary school children? Eat Behav. 2013;14(1):83–86. doi:10.1016/j.eatbeh.2012.11.002
19. Huang C, Niu K, Momma H, et al. Breakfast consumption frequency is associated with grip strength in a population of healthy Japanese adults. Nutr Metab Cardiovasc Dis. 2014;24(6):648–655. doi:10.1016/j.numecd.2013.12.013
20. Cui Y, Zhang W, Gong Q, et al. Frequency of breakfast and physical fitness among Chinese college students. Am J Health Behav. 2018;42(1):156–162. doi:10.5993/AJHB.42.1.15
21. Zhu Z, Cui Y, Gong Q, et al. Frequency of breakfast consumption is inversely associated with the risk of depressive symptoms among Chinese university students: a cross-sectional study. PLoS One. 2019;14(8):e0222014. doi:10.1371/journal.pone.0222014
22. Sasaki S, Katagiri A, Tsuji T, et al. Self-reported rate of eating correlates with body mass index in 18-y-old Japanese women. Int J Obes Relat Metab Disord. 2003;27(11):1405–1410. doi:10.1038/sj.ijo.0802425
23. Huang C, Niu K, Momma H, et al. Inverse association between circulating adiponectin levels and skeletal muscle strength in Japanese men and women. Nutr Metab Cardiovasc Dis. 2014;24(1):42–49. doi:10.1016/j.numecd.2013.03.006
24. Teraoka T. Studies on the peculiarity of grip strength in relation to body positions and aging. Kobe J Med Sci. 1979;25(1):1–17.
25. American Heart Association. Available from: http://www.heart.org/en/health-topics/high-blood-pressure.
26. Wu H, Jackson CA, Wild SH, et al. Socioeconomic status and self-reported, screen-detected and total diabetes prevalence in Chinese men and women in 2011–2012: a nationwide cross-sectional study. J Glob Health. 2018;8(2):020501. doi:10.7189/jogh.08.020501
27. Fukuda K, Kobayashi S. A study on a self-rating depression scale (author’s transl). Seishin Shinkeigaku Zasshi. 1973;75(10):673–679.
28. Barrett J, Hurst MW, DiScala C, et al. Prevalence of depression over a 12-month period in a nonpatient population. Arch Gen Psychiatry. 1978;35(6):741–744. doi:10.1001/archpsyc.1978.01770300083009
29. Bassett DR
30. Cui Y, Huang C, Momma H, et al. Consumption of low-fat dairy, but not whole-fat dairy, is inversely associated with depressive symptoms in Japanese adults. Soc Psychiatry Psychiatr Epidemiol. 2017;52(7):847–853. doi:10.1007/s00127-016-1333-1
31. Cuenca-Garcia M, Ruiz JR, Ortega FB, et al. Association of breakfast consumption with objectively measured and self-reported physical activity, sedentary time and physical fitness in European adolescents: the HELENA (Healthy Lifestyle in Europe by Nutrition in Adolescence) study. Public Health Nutr. 2014;17(10):2226–2236. doi:10.1017/S1368980013002437
32. Mendes J, Afonso C, Moreira P, et al. Association of anthropometric and nutrition status indicators with hand grip strength and gait speed in older adults. JPEN J Parenter Enteral Nutr. 2019;43(3):347–356. doi:10.1002/jpen.1424
33. Robinson SM, Reginster JY, Rizzoli R, et al. Does nutrition play a role in the prevention and management of sarcopenia? Clin Nutr. 2018;37(4):1121–1132. doi:10.1016/j.clnu.2017.08.016
34. Arias-Fernandez L, Struijk EA, Rodriguez-Artalejo F, et al. Habitual dietary fat intake and risk of muscle weakness and lower-extremity functional impairment in older adults: a prospective cohort study. Clin Nutr. 2020. doi:10.1016/j.clnu.2020.03.018
35. Guinter MA, Campbell PT, Patel AV, et al. Irregularity in breakfast consumption and daily meal timing patterns in association with body weight status and inflammation. Br J Nutr. 2019;122(10):1192–1200. doi:10.1017/S0007114519002125
36. Andrews JS, Trupin L, Hough CL, et al. Serum biomarkers of inflammation and muscle strength among women with systemic lupus erythematosus. Cytokine. 2017;90:109–112. doi:10.1016/j.cyto.2016.11.003
37. Stunkard AJ, Grace WJ, Wolff HG. The night-eating syndrome; a pattern of food intake among certain obese patients. Am J Med. 1955;19(1):78–86. doi:10.1016/0002-9343(55)90276-X
38. Birketvedt GS, Florholmen J, Sundsfjord J, et al. Behavioral and neuroendocrine characteristics of the night-eating syndrome. JAMA. 1999;282(7):657–663. doi:10.1001/jama.282.7.657
39. Chen Y, Cui Y, Chen S, et al. Relationship between sleep and muscle strength among Chinese university students: a cross-sectional study. J Musculoskelet Neuronal Interact. 2017;17(4):327–333.
40. Auyeung TW, Kwok T, Leung J, et al. Sleep duration and disturbances were associated with testosterone level, muscle mass, and muscle strength – a cross-sectional study in 1274 older men. J Am Med Dir Assoc. 2015;16(7):630e631–636. doi:10.1016/j.jamda.2015.04.006
41. Allison KC, Ahima RS, O’Reardon JP, et al. Neuroendocrine profiles associated with energy intake, sleep, and stress in the night eating syndrome. J Clin Endocrinol Metab. 2005;90(11):6214–6217. doi:10.1210/jc.2005-1018
42. Wu CS, Wei Q, Wang H, et al. Protective effects of ghrelin on fasting-induced muscle atrophy in aging mice. J Gerontol a Biol Sci Med Sci. 2020;75(4):621–630. doi:10.1093/gerona/gly256
43. Kim SE, Hong J, Cha JY, et al. Relative appendicular skeletal muscle mass is associated with isokinetic muscle strength and balance in healthy collegiate men. J Sports Sci. 2016;34(21):2114–2120. doi:10.1080/02640414.2016.1151922
44. Corder K, van Sluijs EM, Ridgway CL, et al. Breakfast consumption and physical activity in adolescents: daily associations and hourly patterns. Am J Clin Nutr. 2014;99(2):361–368. doi:10.3945/ajcn.111.027607
45. Otsuka R, Tamakoshi K, Yatsuya H, et al. Eating fast leads to insulin resistance: findings in middle-aged Japanese men and women. Prev Med. 2008;46(2):154–159. doi:10.1016/j.ypmed.2007.07.031
46. Lee KS, Kim DH, Jang JS, et al. Eating rate is associated with cardiometabolic risk factors in Korean adults. Nutr Metab Cardiovasc Dis. 2013;23(7):635–641. doi:10.1016/j.numecd.2012.02.003
 © 2020 The Author(s). This work is published and licensed by Dove Medical Press Limited. The
full terms of this license are available at https://www.dovepress.com/terms
and incorporate the Creative Commons Attribution
- Non Commercial (unported, 3.0) License.
By accessing the work you hereby accept the Terms. Non-commercial uses of the work are permitted
without any further permission from Dove Medical Press Limited, provided the work is properly
attributed. For permission for commercial use of this work, please see paragraphs 4.2 and 5 of our Terms.
© 2020 The Author(s). This work is published and licensed by Dove Medical Press Limited. The
full terms of this license are available at https://www.dovepress.com/terms
and incorporate the Creative Commons Attribution
- Non Commercial (unported, 3.0) License.
By accessing the work you hereby accept the Terms. Non-commercial uses of the work are permitted
without any further permission from Dove Medical Press Limited, provided the work is properly
attributed. For permission for commercial use of this work, please see paragraphs 4.2 and 5 of our Terms.