Back to Journals » Clinical Interventions in Aging » Volume 9
Relationship between resistant hypertension and arterial stiffness assessed by brachial-ankle pulse wave velocity in the older patient
Authors Chung C, Cheng H, Chang J, Lin Y, Hsiao J, Chang S, Hsu J, Lin M
Received 29 May 2014
Accepted for publication 25 June 2014
Published 5 September 2014 Volume 2014:9 Pages 1495—1502
DOI https://doi.org/10.2147/CIA.S68544
Checked for plagiarism Yes
Review by Single anonymous peer review
Peer reviewer comments 4
Chang-Min Chung,1,2 Hui-Wen Cheng,2 Jung-Jung Chang,2 Yu-Sheng Lin,2 Ju-Feng Hsiao,2 Shih-Tai Chang,1 Jen-Te Hsu2,3
1School of Traditional Chinese Medicine, College of Medicine, Chang Gung University, 2Division of Cardiology, Chang Gung Memorial Hospital, Chiayi, 3Department of Medicine, College of Medicine, Chang Gung University, Taoyuan County, Taiwan
Background: Resistant hypertension (RH) is a common clinical condition associated with increased cardiovascular mortality and morbidity in older patients. Several factors and conditions interfering with blood pressure (BP) control, such as excess sodium intake, obesity, diabetes, older age, kidney disease, and certain identifiable causes of hypertension are common in patients resistant to antihypertensive treatment. Arterial stiffness, measured by brachial-ankle pulse wave velocity (baPWV), is increasingly recognized as an important prognostic index and potential therapeutic target in hypertensive patients. The aim of this study was to determine whether there is an association between RH and arterial stiffness.
Methods: This study included 1,620 patients aged ≥65 years who were referred or self-referred to the outpatient hypertension unit located at a single cardiovascular center. They were separated into normotensive, controlled BP, and resistant hypertension groups. Home BP, blood laboratory parameters, echocardiographic studies and baPWV all were measured.
Results: The likelihood of diabetes mellitus was significantly greater in the RH group than in the group with controlled BP (odds ratio 2.114, 95% confidence interval [CI] 1.194–3.744, P=0.010). Systolic BP was correlated in the RH group significantly more than in the group with controlled BP (odds ratio 1.032, 95% CI 1.012–1.053, P=0.001). baPWV (odds ratio 1.084, 95% CI 1.016–1.156, P=0.015) was significantly correlated with the presence of RH. The other factors were negatively correlated with the existence of RH.
Conclusion: In patients aged ≥65 years, the patients with RH have elevated vascular stiffness more than the well controlled hypertension group. baPWV increased with arterial stiffness and was correlated with BP levels. Strict BP control is necessary to prevent severe functional and structural vascular changes in the course of hypertensive disease.
Keywords: arterial stiffness, brachial-ankle pulse wave velocity, resistant hypertension
Introduction
Resistant hypertension (RH) is defined as blood pressure (BP) that remains above goal, despite concurrent use of three antihypertensive agents from different classes. Ideally, one of these three agents should be a diuretic, and all agents should be prescribed at optimal doses.1 RH is a common clinical condition and is associated with increased cardiovascular mortality and morbidity.
The prevalence of RH is difficult to estimate because there have been few relevant prospective studies. However, a recent study reported a 12.8% prevalence of RH among the antihypertensive drug-treated population in the USA.2 Many RH-related issues remain unclear because of difficulties in selecting patients with true isolated RH. In selected RH patients, renal denervation has been shown to control BP by suppressing sympathetic nervous system overactivity. Treatment of RH should focus on pathophysiological mechanisms that prevent good hypertensive control. As a result of concurrent conditions such as diabetes, chronic kidney disease, sleep apnea, and coronary artery disease, this population remains difficult to study with regard to etiology and treatment efficacy. Arterial stiffening (AS) independently predicts cardiovascular events in patients with hypertension3–5 and in those with diabetes mellitus.6 Elevated AS is associated with complex coronary artery disease,7 as well as numerous cardiovascular risk factors, including age, hypertension, diabetes mellitus, and end-stage renal disease.8,9 Brachial-ankle pulse wave velocity (baPWV) is the gold standard method for measuring AS.10 AS and RH share similar associated characteristics, including older age, isolated systolic hypertension, chronic kidney disease, diabetes, left ventricular hypertrophy, female sex, obesity, and excessive dietary salt intake.11 To the authors’ knowledge, only one previous study has investigated the role of AS in RH.12 Thus, our study may be the first to determine an association between RH and AS by evaluation of baPWV.
Materials and methods
Participants and study design
This observational study was conducted between April 2011 and December 2013. Patients were either referred or self-referred to the outpatient hypertension unit at a single cardiovascular center. The study was approved by the local ethics committee. A total of 1,336 consecutive patients were diagnosed with essential hypertension, and 284 normotensive patients were also entered into the study. Patients were selected according to the following inclusion criteria: age ≥65 years; hypertension, defined as at least three measurements of office systolic BP ≥140 mmHg and/or diastolic BP ≥90 mmHg in a sitting position, or previously diagnosed and receiving antihypertensive medication; and normal sinus rhythm. Individuals were excluded if they had any of the following: secondary causes of hypertension, established kidney failure (estimated glomerular filtration rate <15 mL/min/1.73 m2), diagnosed atrial fibrillation, physical or mental impairment, or inability to perform home BP measurement.
Each subject then underwent a comprehensive patient history and physical examination. All subjects were monitored for home BP, body mass index, and waist and hip circumference. Blood samples were obtained for all participants following an overnight fast and prior to taking any medications. baPWV measurements and echocardiography studies were performed within 1 week of the initial evaluation. Patients were divided into three groups. The diagnostic definition for RH has been detailed previously. Control subjects were selected from those without hypertension or any other exclusion criteria (group 1, n=284). Those with normal BP levels on treatment with less than three drugs were defined as the hypertension group (group 2, n=1,194). Patients who fulfilled the criteria for RH were selected as the RH group (group 3, n=142).
BP measurement method
A clinically validated automatic electronic device (M10-IT; Omron, Tokyo, Japan) was used for all home BP measurements. Patients were instructed on the home BP measurement technique in a 20-minute training session with their nurse. At the end of the session, patients tested the home BP measurement technique through three consecutive self-measurements taken in the presence of the nurse. The patients monitored their BP at home over a 4-day period, taking three morning measurements (every 2 minutes between 6 am and 9 am) and three evening measurements (between 6 pm and 9 pm). The home BP readings were recorded and stored in the device. Mean home BP was calculated by discarding values obtained on the first day as well as the first measurement obtained each morning and evening. The BP measurement protocol was repeated every 3 months over a 1-year period.
Strategy for reaching goal BP
The main hypertension treatment objective was to attain and maintain the desired BP goal. Start with one drug then add a second drug before achieving the maximum recommended dose of the initial drug, then titrate both drugs up to the maximum recommended doses of both to achieve goal BP. If goal BP could not be reached with two drugs, both drugs were titrated up to the maximum recommended doses. If the BP goal was not achieved with two drugs, a third drug including a diuretic was selected specifically to avoid combined angiotensin-converting enzyme inhibitor and angiotensin receptor blocker use. The third drug was titrated up to the maximum recommended dose to achieve the BP goal (home daytime mean BP <135/85 mmHg).
Definitions
Diabetes mellitus was defined as a previously diagnosed condition, prescribed diet, use of antidiabetic medication, or a fasting venous blood glucose level of ≥126 mg/dL on two occasions. Dyslipidemia was defined as a previously diagnosed condition, use of lipid-lowering agents, elevated plasma total cholesterol (≥200 mg/dL) and/or triglycerides (≥150 mg/dL), or a low high-density lipoprotein level <40 mg/dL.
Assessment of aortic stiffness
baPWV was measured using a volume-plethysmographic apparatus (Form/ABI; Colin Co Ltd., Komaki, Aichi, Japan). The methodology details have been previously described.13 Briefly, this device simultaneously measures bilaterally formed brachial and tibial arterial pressure waves, the lead I electrocardiogram, and a phonocardiogram. With the patient in the supine position, occlusion cuffs were connected to both plethysmographic and oscillometric sensors that were placed around both arms and ankles. All cuffs were then inflated until the brachial and tibial arteries were completely occluded and deflated. Arterial pressure waveforms were digitized at 1,200 Hz for brachial arterial pressure waves and at 240 Hz for tibial arterial pressure waves. Time differences between brachial and ankle arterial pressure waves (ΔT) were examined according to wave front velocity theory. Distances between the brachium and ankle (D) were calculated based on anthropometric data for the Japanese population. Finally, the baPWV was calculated as D/ΔT, thereby not only reflecting aortic stiffness but also leg muscular artery stiffness. Thus, the baPWV is a global AS measure reflecting both elastic and muscular arterial properties.
Echocardiographic studies
Patients were then taken to the echocardiography laboratory and imaged in the left lateral decubitus position using a Philips iE33 ultrasound system (Philips Healthcare Systems, Eindhoven, the Netherlands) equipped with a multifrequency transducer. A complete echocardiographic study was performed using standard views and techniques. M-mode echocardiograms were obtained by two-dimensional guided echocardiography using a transducer with frequency range of 3–5 MHz. The mean of two M-mode measurements obtained by two different investigators was used. Left ventricular mass was subsequently calculated using Devereux’s method.14 The left ventricular mass index was calculated as the left ventricular mass divided by body surface area.
Statistical analysis
Numeric data are presented as the mean and standard deviation and categoric data are presented as frequencies and percentages. One-way analysis of variance and chi-square tests were used for comparisons between the three groups. A multivariate logistic regression analysis was carried out for assessing odds ratios for factors related to the three groups. A receiver operating characteristic (ROC) curve was then used to show a positive correlation between baPWV and RH. Cut-off values were determined as the sum of sensitivity and specificity. The statistical analysis was performed using Statistical Package for the Social Sciences version 20.0 software (IBM Corp., Armonk, NY, USA). A P-value <0.05 was considered to be statistically significant.
Results
Among the 1,620 patients enrolled in this study, 284 were defined as normotensive (group 1); 1,194 patients on treatment with less than three drugs were defined as the hypertension group (group 2); and 142 patients were defined as the RH group (group 3). The baseline characteristics of the study population and of each patient group are summarized in Table 1. Group 1 (normotensive individuals) contained a higher proportion of men, and showed a lower mean body mass index as well as lower rates of diabetes mellitus, smoking, dyslipidemia, cerebral vascular accident, metabolic syndrome, left atrial enlargement, and left ventricular hypertrophy than the other groups. Group 1 individuals also had lower systolic BP, diastolic BP, and baPWV than the other groups. No differences in age, body surface area, or proportion of individuals with chronic obstructive pulmonary disease was seen between the three groups. Group 3 subjects had higher systolic BP, diastolic BP, and baPWV than the other two groups. The laboratory results are summarized in Table 2. Group 1 had a lower left ventricular end diastolic diameter, lower left ventricular end systolic diameter, lower interventricular septum diameter, lower left ventricular mass index, and higher aortic root diameter than the other groups. No differences in total cholesterol, high-density lipoprotein cholesterol, low-density lipoprotein cholesterol, triglycerides, serum creatinine, estimated glomerular filtration rate, glycated hemoglobin, uric acid, left ventricular ejection fraction, posterior wall diameter, and left atrium diameter were noted between the groups. However, hemoglobin levels were significantly lower in group 3 than in group 1.
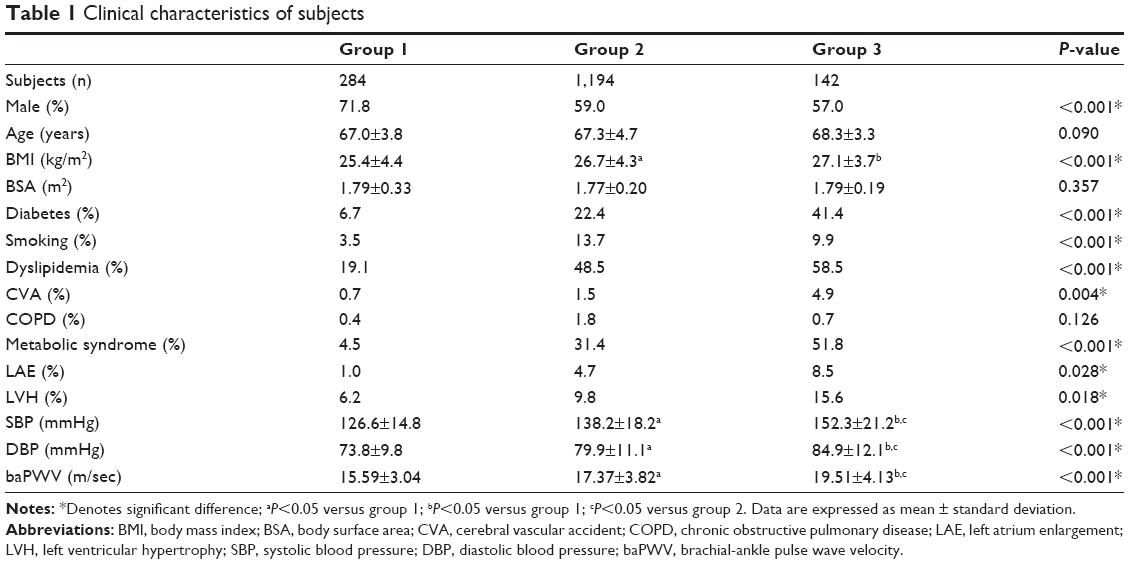 | Table 1 Clinical characteristics of subjects |
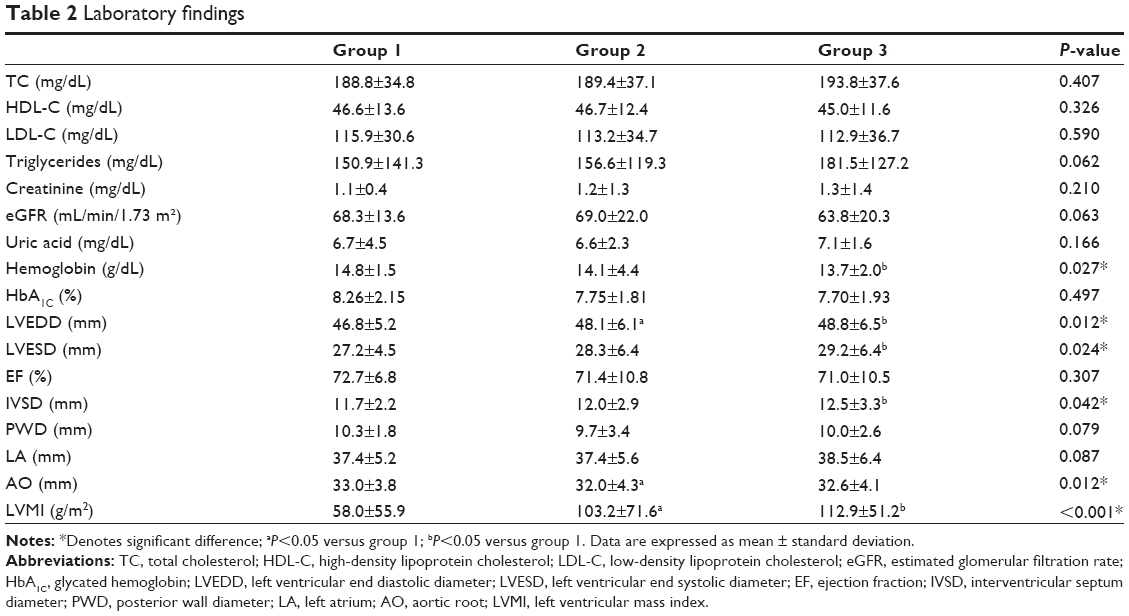 | Table 2 Laboratory findings |
Major antihypertensive and antihyperlipidemic drug categories are summarized in Table 3. The frequently prescribed antihypertensive agents were angiotensin receptor blockers and calcium channel blockers. In group 3, 57% of patients used diuretics, and statins were used by 22.7% of patients in group 2 and 29.6% of those in group 3 (not statistically significant).
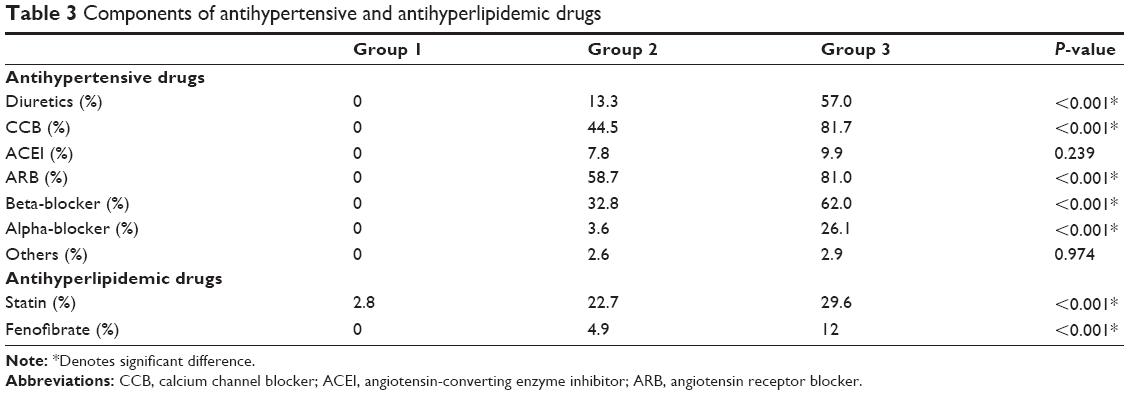 | Table 3 Components of antihypertensive and antihyperlipidemic drugs |
We carried out multivariate logistic regression analysis in order to identify factors related to successful BP control (group 2, Tables 4 and 5). Systolic BP significantly correlated with the existence of the normotensive group when compared to the BP controlled group (odds ratio 0.915, 95% confidence interval [CI] 0.839–0.997, P=0.043). The proportion of diabetes mellitus significantly correlated with the RH group more than the BP controlled group (odds ratio 2.114, 95% CI 1.194–3.744, P=0.010). Systolic BP significantly correlated more with the RH group than with the BP-controlled group (odds ratio 1.032, 95% CI 1.012–1.053, P=0.001). The baPWV (odds ratio 1.084, 95% CI 1.016–1.156, P=0.015) significantly correlated with RH existence. The other factors correlated negatively with the presence of RH.
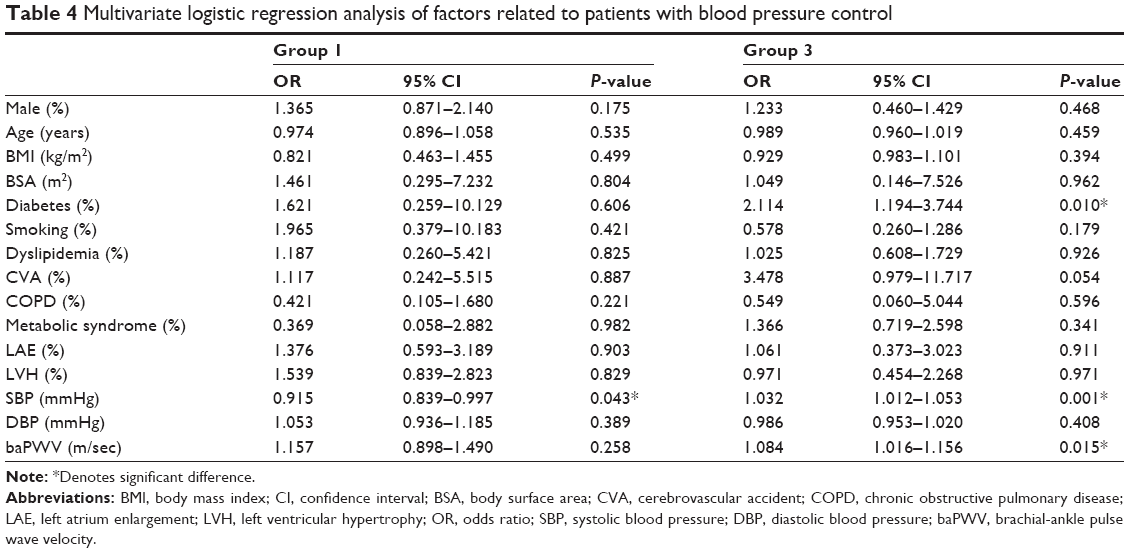 | Table 4 Multivariate logistic regression analysis of factors related to patients with blood pressure control |
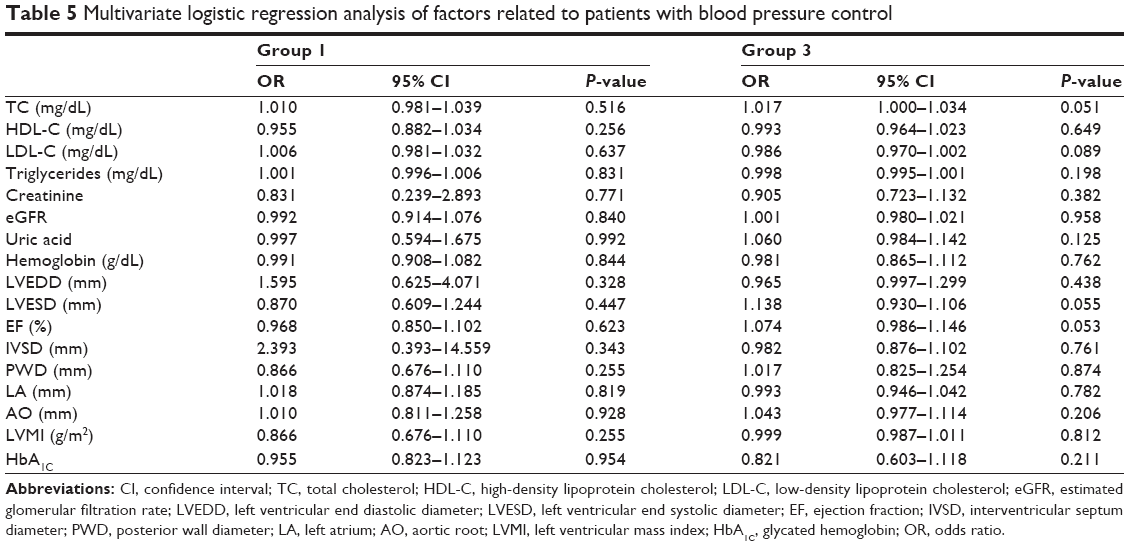 | Table 5 Multivariate logistic regression analysis of factors related to patients with blood pressure control |
Comparison of baPWV according to patient group is shown in Figure 1. A significant increase in baPWV was observed in the hypertensive groups (groups 2 and 3). The highest baPWV was in group 3. The ROC curve analysis for the relationship between baPWV and RH is shown in Figure 2.
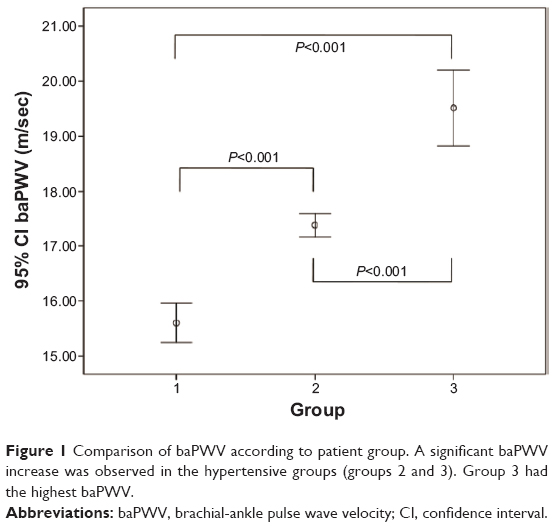 | Figure 1 Comparison of baPWV according to patient group. A significant baPWV increase was observed in the hypertensive groups (groups 2 and 3). Group 3 had the highest baPWV. |
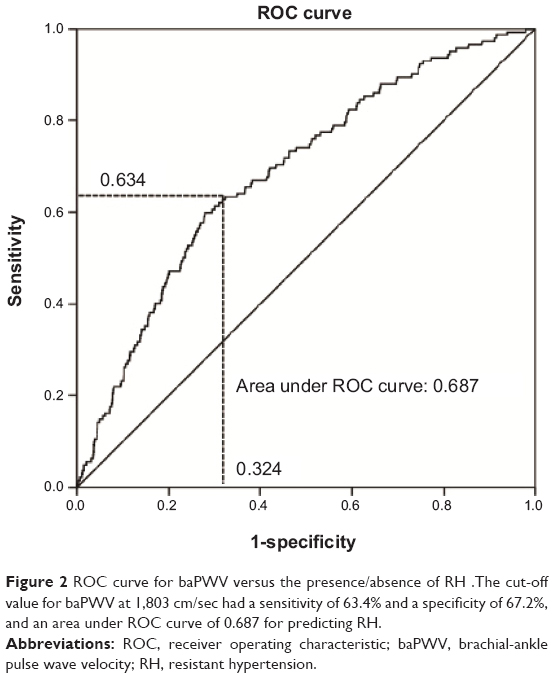 | Figure 2 ROC curve for baPWV versus the presence/absence of RH .The cut-off value for baPWV at 1,803 cm/sec had a sensitivity of 63.4% and a specificity of 67.2%, and an area under ROC curve of 0.687 for predicting RH. |
Using the ROC curve, we determined the optimal cut-off value of baPWV that could predict the presence of RH (Figure 2). The cut-off value of baPWV, which was set at 1,803 cm per second, had a sensitivity of 63.4%, a specificity of 67.2%, and an area under the ROC curve of 0.687 in predicting RH.
Discussion
According to the Framingham Heart Study, approximately 60% of the population has hypertension by the age of 60 years, and about 65% of men and about 75% of women have the disease by 70 years. The elderly are also more likely to suffer from the complications of high BP and are more likely to have uncontrolled hypertension. Compared with younger patients with similar BP, elderly hypertensive patients have lower cardiac output, higher peripheral resistance, wider pulse pressure, lower intravascular volume, and lower renal blood flow. These age-related pathophysiological changes must be considered when treating hypertension in the elderly. Most elderly hypertensive patients with RH have multiple comorbidities, and need multiple drugs to control their BP. A decade ago, in a meta-analysis of more than 15,000 patients aged 62–76 years, Staessen et al15 showed that treating isolated systolic hypertension substantially reduced morbidity and mortality rates. Another large-scale meta-analysis demonstrated the relevance of BP to cardiovascular mortality in the population aged 40–89 years, but the contribution of high BP to cardiovascular mortality decreases with advancing age.16 Further, a 2011 meta-analysis of randomized controlled trials in hypertensive patients aged 75 years and older concluded that treatment reduced cardiovascular morbidity and mortality rates and the incidence of heart failure, even though the total mortality rate was not affected.17 Opinion on treating the very elderly (≥80 years) was divided until the results of the Hypertension in the Very Elderly Trial18 were published in 2008. This study documented major benefits of treatment in the very elderly age group as well.
To our knowledge, this is the first study showing a direct relationship between RH and AS by assessment of baPWV. We observed increased AS in patients with RH when compared with subjects who had controlled hypertension. This study showed that RH patients had greater numbers of risk factors than BP controlled patients, including diabetes mellitus, dyslipidemia, metabolic syndrome and baPWV. Multivariate logistic regression analysis showed that diabetes mellitus and baPWV were significantly related to the presence of RH. Other factors correlated negatively with the presence of RH. In two large studies, AS predicted future development of hypertension in normotensive subjects.
The first of these trials was the Atherosclerosis Risk in Communities study in middle-aged subjects (aged 45–64 years), in which 6,992 normotensive subjects were followed over 6 years.19 AS was assessed by carotid artery diameter using high-resolution B-mode ultrasound and was found to significantly predict future hypertension. Each standard deviation increase in AS correlated with a 15% greater risk of future hypertension, independent of established risk factors and BP levels. However, this trial was criticized because of its nonadjusted analysis. Since most determinants of AS are also risk factors for hypertension, it is important to verify the predictive value of AS with regards to future hypertension remaining after adjustment for these risk factors.
The second trial assessed 2,571 normotensive subjects (aged 35–93 years) who were followed up for 4 years. AS was measured using aortic strain and distensibility parameters.20 Aortic stiffness was determined by M-mode echocardiography using the polynomial regression analysis technique,21 which calculated aortic systolic and diastolic diameters using standard equations for aortic strain, distensibility, and stiffness index (β). Aortic stiffness in normotensive individuals then predicted future hypertension after correcting for other risk factors by multiple linear regression modeling. This association was noted in both young and old subjects of both sexes.
AS occurs as a result of structural changes in connective tissue proteins within the endothelial and smooth muscle cells of the tunica media in the arterial wall, which are potentially related to the risk of development and progression of atherosclerosis.22 The data from this study demonstrating increased baPWV also reflected stiffening as a result of structural changes in the arterial wall. AS related to hypertension is an insidious and progressive process, and is associated with numerous adverse hemodynamic effects and conditions associated with endothelial dysfunction.6,23,24 It also sets up a vicious cycle whereby subtle early damage accelerates the rise in systolic pressure, causing further degeneration of aortic function.25–27 This results in a mid-life rise in systolic pressure, subsequently progressing to both isolated systolic hypertension and resistant systolic hypertension.28–30 Poorly controlled hypertension undoubtedly can lead to progressive vascular damage. This effect also sets up a further vicious cycle whereby increasing vascular stiffness leads to increased BP, thus contributing to further AS. This sets the stage for progressive worsening of hypertension and an increasing need for more BP medications.29,31 Accordingly, the current data support the hypothesis that progressive rigidity in the large arteries is characterized by progression from early to severe stages of hypertension that are difficult to control.29,31,32 Recognition of this progression is clinically important, as it may allow vascular stiffness indexing to facilitate early identification of patients at risk of RH.
More recently, Daugherty et al33 confirmed that there was a high rate of cardiovascular events (ie, death, myocardial infarction, heart failure, stroke, chronic kidney disease) in RH patients. Among 205,750 patients with hypertension found incidentally, 1.9% developed RH at a median of 1.5 years from the initial treatment. These RH patients were older, more often of male sex, and more frequently diabetic than patients who did not have RH. Cardiovascular event rates were significantly higher in RH patients as compared with non-RH patients (18.0% versus 13.5%, respectively; hazard ratio 1.47 [CI 1.33–1.62]; P<0.001) after adjusting for patient and clinical characteristics.
Our study also demonstrated that diabetes mellitus is an independent risk factor for RH. RH represents an uncontrolled BP subset that is strongly associated with organ involvement, particularly at the cardiac, renal, and vascular levels.35 The relationship between RH and cardiovascular disease/target organ damage may be bidirectional. RH may directly cause both development and worsening of target organ damage through persistent elevation of BP. Similarly, cardiovascular target organ damage may worsen the resistance to treatment, rendering hypertension even more difficult to control.35,36 The prevalence and incidence of RH is comparatively high in patients with renal disease, microvascular disease, left ventricular hypertrophy, aortic stiffness, or cerebrovascular disease, and in those with secondary hypertension. The findings of Dernellis and Panaretou,20 as well as those of Liao et al19 together with earlier studies, provide support for the bidirectional interaction of AS and hypertension. Numerous lifestyle and pharmacological interventions are effective for reducing AS. Furthermore, its early diagnosis with noninvasive techniques before development of RH or cardiovascular complications may identify individuals at risk at a time when lifestyle intervention may be useful.
Conclusion
We have demonstrated that patients with RH have more elevated vascular stiffness than hypertensive patients with well controlled BP in older age. Thus, increases in baPWV, as demonstrated by AS, have a direct correlation with BP levels. It appears reasonable that strict BP control associated with reducing AS should be obtained to prevent severe functional and structural vascular changes during the hypertensive disease’s course. We also propose that noninvasive modalities evaluating vascular stiffness (ie, baPWV) should be used in clinical practice to stratify cardiovascular risk.
Disclosure
The authors report no conflicts of interest in this work.
References
Calhoun DA, Jones D, Textor S, et al. Resistant hypertension: diagnosis, evaluation, and treatment. A scientific statement from the American Heart Association Professional Education Committee of the Council for High Blood Pressure Research. Circulation. 2008;117:e510–e526. | ||
Persell SD. Prevalence of resistant hypertension in the United States, 2003–2008. Hypertension. 2011;57:1076–1080. | ||
Henry RM, Kostense PJ, Spijkerman AM, Dekker JM, Nijpels G, Heine RJ. Arterial stiffness increases with deteriorating glucose tolerance status: the Hoorn Study. Circulation. 2003;107:2089–2095. | ||
van Popele NM, Grobbee DE, Bots ML, et al. Association between arterial stiffness and atherosclerosis: the Rotterdam Study. Stroke. 2001;32:454–460. | ||
Cruickshank K, Riste L, Anderson SG, Wright JS, Dunn G, Gosling RG. Aortic pulse wave velocity and its relationship to mortality in diabetes and glucose intolerance: an integrated index of vascular function? Circulation. 2002;106:2085–2090. | ||
Laurent S, Cockcroft J, Van Bortel L, et al. Expert consensus document on arterial stiffness: methodological issues and clinical applications. Eur Heart J. 2006;27:2588–2605. | ||
Chung CM, Hsiao JF, Yang TY, Lin YS, Hsu JT. Arterial stiffness assessed by brachial-ankle pulse wave velocity between patients with acute coronary syndrome and stable angina. Exp Clin Cardiol. 2014;20: 1685–1720. | ||
Lehmann ED, Gosling RG, Sönksen PH. Arterial wall compliance in diabetes. Diabet Med. 1992;9:114–119. | ||
London GM, Marchais SJ, Safar ME, et al. Aortic and large artery compliance in end-stage renal failure. Kidney Int. 1990;37:137–142. | ||
Laurent S, Boutouyrie P, Asmar R, Gautier I, Laloux B, Guize L. Aortic stiffness is an independent predictor of all-cause and cardiovascular mortality in hypertensive patients. Hypertension. 2001;37:1236–1241. | ||
Pickering TG. Arterial stiffness as a cause of resistant hypertension. J Clin Hypertens. 2007;9:390–395. | ||
Pabuccu T, Baris N, Ozpelit E, Akdeniz B, Guneri S. The relationship between resistant hypertension and arterial stiffness. Clin Exp Hypertens. 2012;34:57–62. | ||
Yamashina A, Tomiyama H, Takeda K, et al. Validity, reproducibility, and clinical significance of noninvasive brachial-ankle pulse wave velocity measurement. Hypertens Res. 2002;25:359–364. | ||
Devereux RB, Reicheck N. Echocardiographic determination of left ventricular mass in man. Anatomic validation of the method. Circulation. 1977;55:613–618. | ||
Staessen JA, Gasowski J, Wang JG, et al. Risks of untreated and treated isolated systolic hypertension in the elderly: meta-analysis of outcome trials. Lancet. 2000;355:865–872. | ||
Lewington S, Clarke R, Qizilbash N, Peto R, Collins R. Age-specific relevance of usual blood pressure to vascular mortality: a meta-analysis of individual data for one million adults in 61 prospective studies. Lancet. 2002;360:1903–1913. | ||
Schall P, Wehling M. Treatment of arterial hypertension in the very elderly: a meta-analysis of clinical trials. Arzneimittelforschung. 2011; 61:221–228. | ||
Beckett NS, Peters R, Fletcher AE, et al; HYVET Study Group. Treatment of hypertension in patients 80 years of age or older. N Engl J Med. 2008;358:1887–1898. | ||
Liao D, Arnett DK, Tyroler HA, et al. Arterial stiffness and the development of hypertension. The ARIC study. Hypertension. 1999;34: 201–206. | ||
Dernellis J, Panaretou M. Aortic stiffness is an independent predictor of progression to hypertension in nonhypertensive subjects. Hypertension. 2005;45:426–431. | ||
Stefanadis C, Dernellis J, Tsiamis E, Diamantopoulos L, Michaelides A, Toutouzas P. Assessment of aortic line of elasticity using polynomial regression analysis. Circulation. 2000;101:1819–1825. | ||
Duprez DA, Cohn JN. Arterial stiffness as a risk factor for coronary atherosclerosis. Curr Atheroscler Rep. 2007;9:139–144. | ||
Zieman SJ, Melenovsky V, Kass DA. Mechanisms, pathophysiology, and therapy of arterial stiffness. Arterioscler Thromb Vasc Biol. 2005; 25:932–943. | ||
Laurent S, Boutouyrie P. Recent advances in arterial stiffness and wave reflection in human hypertension. Hypertension. 2007;49:1202–1206. | ||
Ahlund C, Pettersson K, Lind L. Pulse wave analysis on fingertip arterial pressure: effects of age, gender and stressors on reflected waves and their relation to brachial and femoral artery blood flow. Clin Physiol Funct Imaging. 2008;28:86–95. | ||
London GM, Marchais SJ, Guerin AP, Pannier B. Arterial stiffness: pathophysiology and clinical impact. Clin Exp Hypertens. 2004;26: 689–699. | ||
O’Rourke MF. Clinical assessment of arterial stiffness. Am J Hypertens. 2007;20:839. | ||
Williams B. The aorta and resistant hypertension. J Am Coll Cardiol. 2009;53:452–454. | ||
Martins LC, Figueiredo VN, Quinaglia T, et al. Characteristics of resistant hypertension: ageing, body mass index, hyperaldosteronism, cardiac hypertrophy and vascular stiffness. J Hum Hypertens. 2011;25: 532–538. | ||
Mackenzie IS, McEniery CM, Dhakam Z, Brown MJ, Cockcroft JR, Wilkinson IB. Comparison of the effects of antihypertensive agents on central blood pressure and arterial stiffness in isolated systolic hypertension. Hypertension. 2009;54:409–493. | ||
Safar ME, Blacher J, Protogerou A, Achimastos A. Arterial stiffness and central hemodynamics in treated hypertensive subjects according to brachial blood pressure classification. J Hypertens. 2008;26:130–137. | ||
Safar ME, Levy BI, Struijker-Boudier H. Current perspectives on arterial stiffness and pulse pressure in hypertension and cardiovascular diseases. Circulation. 2003;107:2864–2869. | ||
Daugherty SL, Powers JD, Magid DJ, et al. Incidence and prognosis of resistant hypertension in hypertensive patients. Circulation. 2012;125: 1635–1642. | ||
Mancia G, De Backer G, Dominiczak A, et al. Guidelines for the management of arterial hypertension. The Task force for the management of arterial hypertension of the European Society of Hypertension (ESH) and of the European Society of Cardiology (ESC). J Hypertens. 2007;25:1105–1187. | ||
McAlister FA, Lewanczuk RZ, Teo KK. Resistant hypertension: an overview. Can J Cardiol. 1996;12:822–828. | ||
Ram CV. Management of refractory hypertension. Am J Ther. 2003;10: 122–126. |
 © 2014 The Author(s). This work is published and licensed by Dove Medical Press Limited. The
full terms of this license are available at https://www.dovepress.com/terms
and incorporate the Creative Commons Attribution
- Non Commercial (unported, 3.0) License.
By accessing the work you hereby accept the Terms. Non-commercial uses of the work are permitted
without any further permission from Dove Medical Press Limited, provided the work is properly
attributed. For permission for commercial use of this work, please see paragraphs 4.2 and 5 of our Terms.
© 2014 The Author(s). This work is published and licensed by Dove Medical Press Limited. The
full terms of this license are available at https://www.dovepress.com/terms
and incorporate the Creative Commons Attribution
- Non Commercial (unported, 3.0) License.
By accessing the work you hereby accept the Terms. Non-commercial uses of the work are permitted
without any further permission from Dove Medical Press Limited, provided the work is properly
attributed. For permission for commercial use of this work, please see paragraphs 4.2 and 5 of our Terms.