Back to Journals » Clinical Ophthalmology » Volume 10
Relationship between macular thickness measurement and signal strength using Stratus optical coherence tomography
Authors Segal O, Shapira Y, Gershoni A, Vainer I, Nemet AY ![]() , Geffen N, Mimouni M
, Geffen N, Mimouni M
Received 13 January 2016
Accepted for publication 7 April 2016
Published 11 November 2016 Volume 2016:10 Pages 2259—2264
DOI https://doi.org/10.2147/OPTH.S104153
Checked for plagiarism Yes
Review by Single anonymous peer review
Peer reviewer comments 3
Editor who approved publication: Dr Scott Fraser
Ori Segal,1 Yinon Shapira,2 Assaf Gershoni,1 Igor Vainer,2 Arie Y Nemet,1 Noa Geffen,1 Michael Mimouni2
1Department of Ophthalmology, Meir Medical Center, Kfar Saba, Israel and the Sackler School of Medicine, Tel Aviv University, Tel Aviv, 2Department of Ophthalmology, Rambam Health Care Campus, Haifa, Israel
Purpose: To examine the relationship between signal strength and macular thickness as measured by Stratus optical coherence tomography (OCT)’s fast macular thickness protocol in healthy subjects.
Methods: In this prospective cross-sectional study 79 eyes of 42 healthy subjects were enrolled. The age, gender, and eye (right vs left) of each subject were recorded. The Stratus OCT fast macular thickness scan protocol was used and the macular thickness was measured with retinal thickness map analysis. Each eye was imaged at least six times to acquire images with signal strengths of 4, 5, 6, 7, 8, and 9 out of 10 via adjustment of the focusing knob. The OCT parameters included in the analysis were thickness in the central 1 mm and in the different quadrants in the 3-mm area.
Results: Overall 79 eyes of 42 patients with a mean age of 38.4±12.4 were included. There was no significant difference between the signal strength measurements obtained with different signal strengths in the central thickness (P=0.20). In the superior, nasal, inferior, and temporal quadrants, a signal strength of 8 demonstrated up to 3 µm thicker measurements than a signal strength of 5 (P<0.05). In general linear regression analysis, after accounting for age and gender, signal strength did not remain a significant predictor of thickness in any quadrant.
Conclusions: When using fast map macular measurements, a signal strength of 5 is clinically as efficient as a signal strength of 8 in measuring macular thickness in all quadrants. Insisting on higher signal strength may not be necessary.
Keywords: macular thickness, signal strength, Stratus OCT, fast map macular measurement, retinal thickness
Introduction
Since first reported by Huang et al in 1991,1 the optical coherence tomography (OCT) has become an essential diagnostic tool for monitoring patients with macular diseases and to evaluate the efficacy of treatment.2 Specifically, the OCT-measured retinal thickness has become an integral part of routine clinics and has been chosen as a primary end point in countless clinical studies.3–6
Several studies have reported the accuracy,7 precision,8 and influencing factors9–11 of OCT measurements such as retinal nerve fiber layer (RNFL) thickness. Time domain OCT (Stratus OCT, Carl Zeiss, Jena, Germany) uses partial coherence interferometry to obtain the optical A-scans of the retina. Using this method, changes in the reflectivity are utilized in order to define the different retinal boundaries. The once popular signal-to-noise ratio has now been replaced by signal strength as the essential method of assessing quality. The signal strength measurement is in fact a combination of signal-to-noise ratio with the uniformity of the signal. It is measured on a scale of 1–10 with 1 representing the poorest image quality and 10 the best. Signal strength serves as the main method of assessing the quality and its effect on RNFL thickness measurement is well documented.9–11 Scans with lower signal strength have been shown to be less accurate, most probably due to segmentation error.12 However, it is unclear whether scans with lower signal strength that maintain correct segmentation of the layers produce reliable measurements of macular thickness.
Of the several scanning programs provided by the Stratus, one of the most commonly employed protocols for assessing the macula, due to its time efficiency, is the fast macular thickness map protocol.13 To the best of our knowledge, no study has investigated the effect of signal strength on macular thickness measurements using the fast macular thickness map protocol in healthy subjects.
The purpose of this study was to examine the relationship between signal strength and macular thickness as measured by Stratus OCT’s fast macular thickness protocol in healthy subjects. Specifically, we sought to examine whether scans with lower signal strength with correct segmentation produce similar results to those with higher signal strength.
Materials and methods
All data for this prospective cohort study were collected and analyzed in accordance with the policies and procedures of the Institutional Review Board of the Meir Medical Center and the tenets set forth in the declaration of Helsinki. This study was approved by the Institutional Review Board of the Meir Medical Center. Written informed consent for participation in the study was obtained from all participants.
Study participants
A total of 79 eyes of 42 subjects were enrolled in this cross-sectional study. Volunteers were recruited among employees at the Meir Medical Center. Subjects were enrolled in the study if they had no history or evidence of eye disease or surgery, 20/30 visual acuity, intraocular pressure <22 mmHg, refractive error <±4 diopters spherical equivalent or 3 diopters of astigmatism, and normal-appearing optic nerve head and retina on dilated fundus examination.
The age, gender, and eye (right vs left) of each subject were recorded. OCT was performed with the Stratus OCT (analysis software version 5.0.1). The fast macular thickness scan protocol was used and the macular thickness was measured with retinal thickness map analysis as previously reported.14–16 By adjusting the focusing knob of the OCT imaging system, images with different signal strength can be acquired as previously described.9 By adjusting the focusing knob, the image is defocused gradually in order to intentionally reduce the signal strength. Each eye was imaged at signal strengths of 4, 5, 6, 7, 8, and 9 with a set of three images taken for each signal strength (overall 18 scans). Subjects were encouraged to blink their eyes after each scan. Scans would not be included if they failed to complete the OCT scanning or if visible segmentation errors were detected. Only scans with correct segmentation of the layers were included and therefore multiple attempts were performed in the lower signal strength range. The parameters included in the analysis were thickness in the central 1 mm and in the different quadrants in the 3-mm area.
Statistical analysis
Data were analyzed using StatSoft Statistica software, version 10 (StatSoft, Tulsa, OK, USA). A repeated-measures analysis of variance was conducted to compare means for each of the macular quadrants according to four increments in signal strength. A post hoc Bonferroni test was used for correction of multiple comparisons. The tested eye was included in the analysis as a covariate in order to control for potential inter-ocular influences. Student’s t-test was used to compare independent groups’ averages, and Pearson correlation coefficients (and respective P-values) were calculated for the relationship between continuous variables. Variables that were found to be associated with thickness measurement were entered into a general linear regression model in order to verify their independent effect. Continuous variables are presented as mean ± standard deviation. A two-sided P-value of <0.05 was considered statistically significant.
Results
Overall there were 79 eyes of 42 patients. The mean age of patients was 38.4±12.4 (range 18–67), and 62% were female.
Figure 1 provides an example of a subject with a macular thickness scan with signal strengths between 4 and 9 and fulfilling the study protocol of no segmentation errors. Central thickness was slightly greater in males when compared with females (215.3±11.9 vs 194.9±15.3, P<0.0001; respectively). The same was observed for the superior quadrant (287.1±9.1 vs 280.2±14.3, P<0.0001, respectively), nasal quadrant (286.4±8.3 vs 277.3±15.7, P<0.0001, respectively), inferior quadrant (288.6±8.1 vs 278.2±13.7, P<0.0001, respectively), and temporal quadrant (273.3±8.5 vs 264.7±13.0, P<0.0001, respectively).
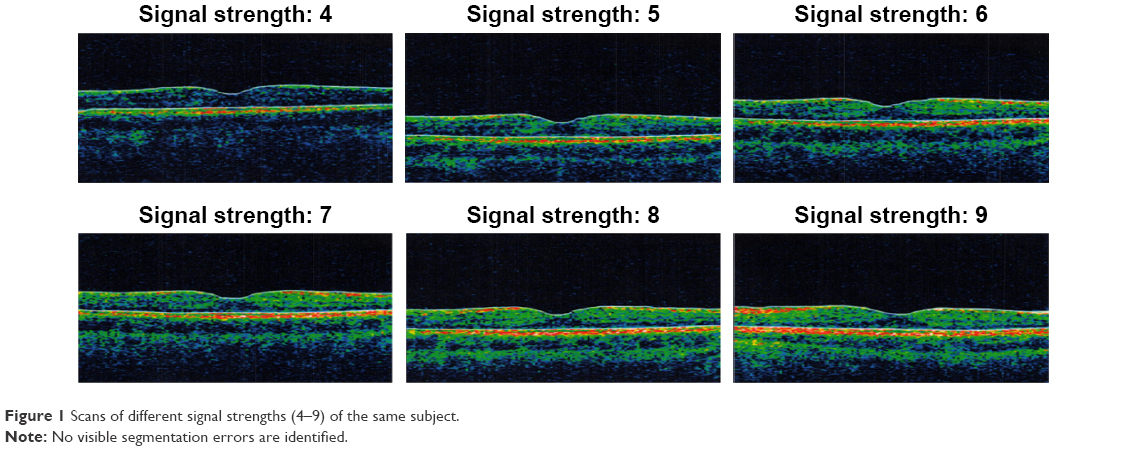 | Figure 1 Scans of different signal strengths (4–9) of the same subject. |
There was no correlation between the subject’s age and central thickness measurement (r=0.03, P>0.05). There was however an inverse correlation between the age and the superior quadrant thickness (r=−0.19, P<0.0001), the nasal thickness (r=−0.18, P<0.0001), the inferior thickness (r=−0.19, P<0.0001), and the temporal thickness (r=−0.22, P<0.0001).
Full measurement data for four signal strengths (5–8) for the macular center and four quadrants was available for 48 eyes of 24 patients, which were included in the repeated-measures analysis.
There was no significant difference between the measurements obtained with different signal strengths in the central thickness (P=0.20; Figure 2).
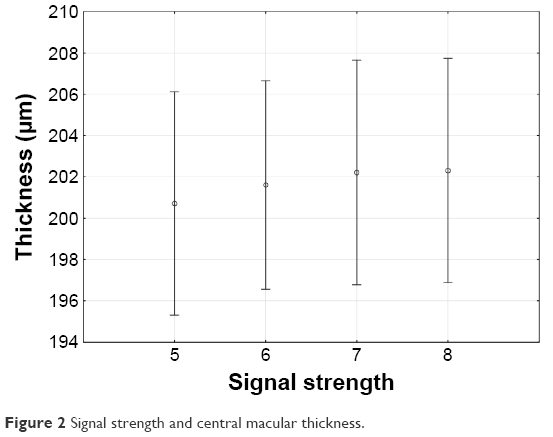 | Figure 2 Signal strength and central macular thickness. |
In the superior quadrant, on the other hand, a signal strength of 8 yielded a greater thickness measurement in comparison with each of the lower signal strength measurements (P<0.02 for all comparisons; Figure 3).
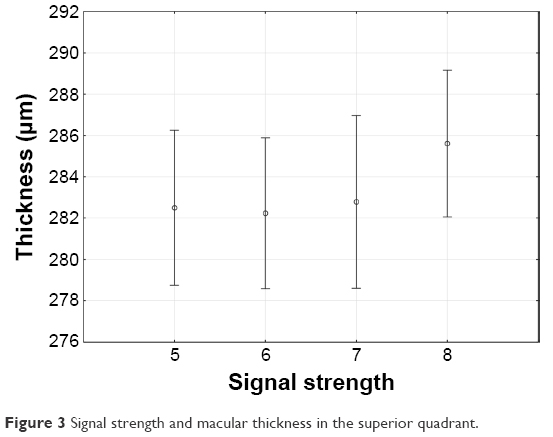 | Figure 3 Signal strength and macular thickness in the superior quadrant. |
In the nasal quadrant (Figure 4), a signal strength of 8 yielded a greater thickness measurement when compared with a signal strength of 6 (P<0.05) and a signal strength of 5 (P<0.05), but not when compared with a signal strength of 7 (P>0.05).
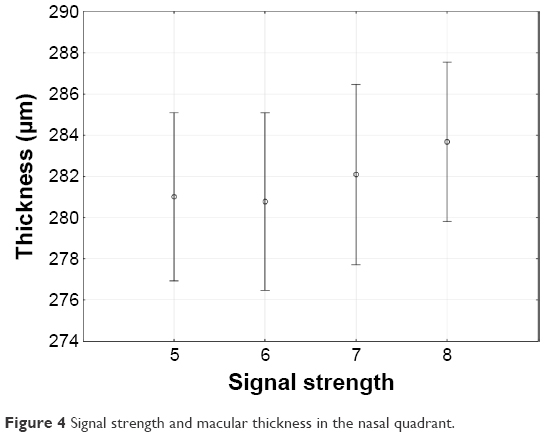 | Figure 4 Signal strength and macular thickness in the nasal quadrant. |
In the inferior quadrant (Figure 5), similarly, a signal strength of 8 yielded a greater thickness measurement when compared with a signal strength of 6 (P<0.01) and a signal strength of 5 (P<0.05), but not when compared with a signal strength of 7 (P>0.05).
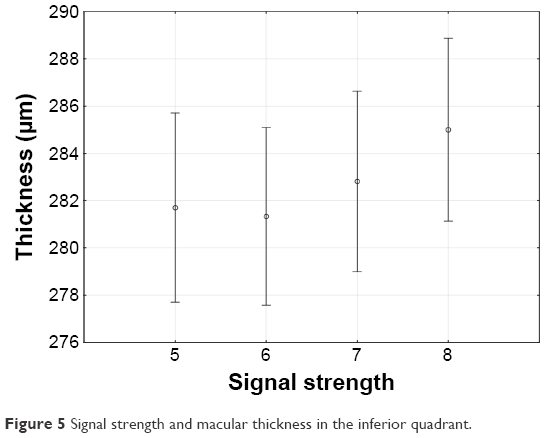 | Figure 5 Signal strength and macular thickness in the inferior quadrant. |
Also in the temporal quadrant (Figure 6) a signal strength of 8 yielded a greater thickness measurement in comparison with each of the lower signal strength measurements (P<0.02 for all comparisons; Figure 3).
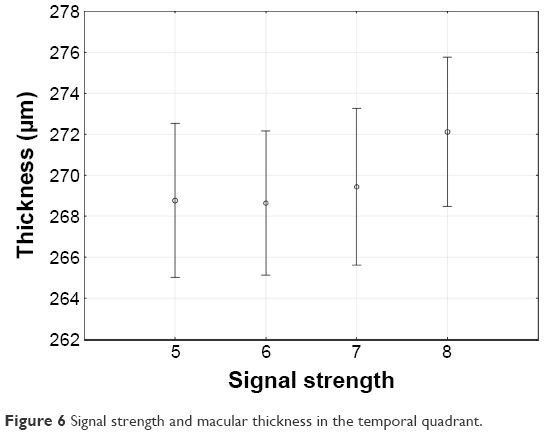 | Figure 6 Signal strength and macular thickness in the temporal quadrant. |
Finally, a linear regression analysis confirmed that signal strength was not a significant predictor of central thickness measurement (P>0.05), while female gender was an independent predictor of lower central thickness measurement (partial r=−0.56, P<0.0001). In a regression analysis for superior quadrant thickness, signal strength did not remain a significant predictor of thickness measurement (P>0.05), while female gender (partial r=−0.23, P<0.0001) and age (partial r=−0.11, P<0.05) were independent predictors of a lower quadrant thickness measurement. In a regression analysis for nasal quadrant thickness, signal strength and age did not remain significant predictors of thickness measurement (P>0.05), while female gender (partial r=−0.3, P<0.0001) remained an independent predictor of a lower quadrant thickness measurement. The same was observed for inferior thickness analysis, in which only female gender (partial r=−0.4, P<0.0001) remained an independent predictor of a lower quadrant thickness measurement. In a regression analysis for temporal quadrant thickness, similarly signal strength did not remain a significant predictor of thickness measurement (P>0.05), while female gender (partial r=−0.31, P<0.0001) and age (partial r=−0.11, P<0.05) were independent predictors of a lower temporal quadrant thickness measurement.
Discussion
Retinal thickness, defined as the distance between the vitreoretinal interface and the highly reflective thin band adjacent to the retinal pigment epithelium, is a routine parameter used to diagnose and monitor the progress of patients suffering from a wide spectrum of ocular pathologies.3–6
In many parts of the world, despite its smaller optical axial resolution of 10 μm, the Stratus OCT is still in use in both clinical practice and research. A search in PubMed with the query “retina AND thickness AND OCT AND stratus” provided 26 results in 2014–2015 alone. Therefore, correctly interpreting and adjusting the measurements based on signal strength is imperative.
The Stratus OCT fast macular thickness map protocol, which is relatively quick and easy to perform, has gained popularity and is currently used in both clinical practice and trials.17 The importance of identifying factors that may influence the fast macular thickness measurements has been recognized. Several factors such as age,18,19 ethnicity, gender,20 the presence of a cataract,21 and the presence of posterior capsular opacification22 have been reported to have a significant correlation with the measurement of macular thickness.
In these prospective 79 eyes of 42 healthy subjects, we found that higher signal strengths demonstrated thicker measurements than lower signal strengths. However, the clinical significance in such cases was quite small (2–3 μm difference). Furthermore, in general linear regression analysis which accounted for gender and age showed that the signal strength no longer remained a predictor of thickness measurements. To the best of our knowledge, this is the first study to focus on the effect the signal strength has on fast map macular measurements by studying scans of healthy subjects without visible segmentation errors.
Previous studies have focused mainly on the effect of signal strength on RNFL measurements. Cheung et al9 examined this effect in 40 healthy subjects and found that an increase in signal strength from 5 to 10 could lead to an increase of 10% in measurements. A study by Wu et al11 showed that scans with higher signal strengths are associated with greater RNFL thickness measurements up until a signal strength of 7 out of 10. This study has shown that there is no clinically significant difference in macular thickness measurement between a signal strength of 5 or a signal strength of 8 (3 μm difference).
In this study, a significant inverse correlation was found between age and the superior and temporal quadrant measurement areas. These results are supported by those of two previous reports on the relationship between age and Stratus OCT macular measurements.18,19 Sung et al detected lower macular measurements as age increased in all of the measured areas except the center area.19 They postulated that this was the result of the central foveal area being devoid of RNFL therefore remaining relatively stable throughout life.19 Eriksson and Alm reported a similar negative relationship between retinal thickness and age for all of the measured areas with the weakest being in the central foveal area.18 Neuville et al reported macular thinning with age, with the greatest amount of thinning occurring in the area nasal to the fovea, accounted partially by the corresponding loss of RNFL.23
In this study, in all measured areas, females demonstrated an association with lower thickness measurements in multivariate analyses. This finding is supported by those of previous studies that found that males have thicker foveal measurements than female counterparts.20,24,25 As the difference in retinal thickness between genders seems to be greater in younger populations (as opposed to older adults), it has been suggested that a gonadal hormonal influence may contribute to this finding.24
As retinal thickness, obtained via fast map macular measurements, is used to diagnose and monitor patients with several diseases,26 imprecise measurements or measurements made with varying signal strengths may lead to miscalculating treatment response therefore baffling treatment decision making or misinterpreting clinical research conclusions. However, apparently, a cutoff signal strength of 5 may be as good as a cutoff signal strength of 7 or even 8.
Several studies have reported the results of comparing multiple OCT devices with each other,27–29 including methods of converting measurements from one model to those of another.30 In this study, the signal strength did not play a significant role in predicting macular thickness measurements. This may imply that signal strength in itself is not a critical element to take into consideration when comparing between models or measurements or when building formulas to convert measurement from one model to another. This also strengthens the notion that retinal layer segmentation and shifting of the boundaries for measurement is much more likely to affect macular thickness measurements than the signal strength itself. Therefore, relying on the signal strength itself is insufficient and clinicians should always verify that scans have correctly segmented the layers of the retina.
A limitation of this study is its relatively small sample size. Despite not including scans with segmentation errors in this study, one must also bear in mind that the fast macular protocol itself allows for a shorter acquisition time at the cost of being prone to segmentation errors and therefore this study’s findings may not apply to other protocols. In addition, the method of adjusting the focusing knob to obtain a variety of signal strengths, though previously described,9 may differ from the clinical setting when signal strength is reduced by media opacity such as cataract. Last, a gold standard measurement by spectral domain OCT was not performed in these eyes, future studies may consider doing so as this would provide useful information.
In conclusion, when using fast map macular measurements, a signal strength of 5 is clinically as efficient as a signal strength of 8 in measuring macular thickness in all quadrants. Insisting on higher signal strength may not be necessary.
Acknowledgment
This study and its authors did not receive funding or financial support of any kind.
Disclosure
The authors report no conflicts of interest in this work.
References
Huang D, Swanson EA, Lin CP, et al. Optical coherence tomography. Science. 1991;254(5035):1178–1181. | ||
Adhi M, Duker JS. Optical coherence tomography–current and future applications. Curr Opin Ophthalmol. 2013;24(3):213–221. | ||
Schmidt-Erfurth U, Eldem B, Guymer R, et al. Efficacy and safety of monthly versus quarterly ranibizumab treatment in neovascular age-related macular degeneration: the EXCITE study. Ophthalmology. 2011;118(5):831–839. | ||
Massin P, Bandello F, Garweg JG, et al. Safety and efficacy of ranibizumab in diabetic macular edema (RESOLVE Study): a 12-month, randomized, controlled, double-masked, multicenter phase II study. Diabetes Care. 2010;33(11):2399–2405. | ||
Krebs I, Schmetterer L, Boltz A, et al. A randomised double-masked trial comparing the visual outcome after treatment with ranibizumab or bevacizumab in patients with neovascular age-related macular degeneration. Br J Ophthalmol. 2013;97(3):266–271. | ||
Brown DM, Heier JS, Ciulla T, et al. Primary endpoint results of a phase II study of vascular endothelial growth factor trap-eye in wet age-related macular degeneration. Ophthalmology. 2011;118(6):1089–1097. | ||
Hougaard JL, Heijl A, Bengtsson B. Glaucoma detection by Stratus OCT. J Glaucoma. 2007;16(3):302–306. | ||
Villain MA, Greenfield DS. Peripapillary nerve fiber layer thickness measurement reproducibility using optical coherence tomography. Ophthalmic Surg Lasers Imaging. 2003;34(1):33–37. | ||
Cheung CY, Leung CK, Lin D, Pang CP, Lam DS. Relationship between retinal nerve fiber layer measurement and signal strength in optical coherence tomography. Ophthalmology. 2008;115(8):1347–1351, 1351 e1341–e1342. | ||
Vizzeri G, Bowd C, Medeiros FA, Weinreb RN, Zangwill LM. Effect of signal strength and improper alignment on the variability of stratus optical coherence tomography retinal nerve fiber layer thickness measurements. Am J Ophthalmol. 2009;148(2):249–255 e241. | ||
Wu Z, Vazeen M, Varma R, et al. Factors associated with variability in retinal nerve fiber layer thickness measurements obtained by optical coherence tomography. Ophthalmology. 2007;114(8):1505–1512. | ||
Keane PA, Mand PS, Liakopoulos S, Walsh AC, Sadda SR. Accuracy of retinal thickness measurements obtained with Cirrus optical coherence tomography. Br J Ophthalmol. 2009;93(11):1461–1467. | ||
Schuman JS, Puliafito CA, Fujimoto JG. Optical Coherence Tomography of Ocular Diseases. Thorofare, NJ: SLACK Inc; 2004. | ||
Eriksson U, Alm A. Repeatability in and interchangeability between the macular and the fast macular thickness map protocols: a study on normal eyes with Stratus optical coherence tomography. Acta Ophthalmol. 2009;87(7):725–730. | ||
Taban M, Sharma S, Williams DR, Waheed N, Kaiser PK. Comparing retinal thickness measurements using automated fast macular thickness map versus six-radial line scans with manual measurements. Ophthalmology. 2009;116(5):964–970. | ||
Domalpally A, Danis RP, Myers D, Kruse CN. Quantitative analysis of the Stratus optical coherence tomography fast macular thickness map reports. Indian J Ophthalmol. 2010;58(2):131–136. | ||
Ritter M, Elledge J, Simader C, et al. Evaluation of optical coherence tomography findings in age-related macular degeneration: a reproducibility study of two independent reading centres. Br J Ophthalmol. 2011;95(3):381–385. | ||
Eriksson U, Alm A. Macular thickness decreases with age in normal eyes: a study on the macular thickness map protocol in the Stratus OCT. Br J Ophthalmol. 2009;93(11):1448–1452. | ||
Sung KR, Wollstein G, Bilonick RA, et al. Effects of age on optical coherence tomography measurements of healthy retinal nerve fiber layer, macula, and optic nerve head. Ophthalmology. 2009;116(6):1119–1124. | ||
Kelty PJ, Payne JF, Trivedi RH, Kelty J, Bowie EM, Burger BM. Macular thickness assessment in healthy eyes based on ethnicity using Stratus OCT optical coherence tomography. Invest Ophthalmol Vis Sci. 2008;49(6):2668–2672. | ||
van Velthoven ME, van der Linden MH, de Smet MD, Faber DJ, Verbraak FD. Influence of cataract on optical coherence tomography image quality and retinal thickness. Br J Ophthalmol. 2006;90(10):1259–1262. | ||
Gonzalez-Ocampo-Dorta S, Garcia-Medina JJ, Feliciano-Sanchez A, Scalerandi G. Effect of posterior capsular opacification removal on macular optical coherence tomography. Eur J Ophthalmol. 2008;18(3):435–441. | ||
Neuville JM, Bronson-Castain K, Bearse MA Jr, et al. OCT reveals regional differences in macular thickness with age. Optom Vis Sci. 2009;86(7):E810–E816. | ||
Wexler A, Sand T, Elsas TB. Macular thickness measurements in healthy Norwegian volunteers: an optical coherence tomography study. BMC Ophthalmol. 2010;10:13. | ||
Kashani AH, Zimmer-Galler IE, Shah SM, et al. Retinal thickness analysis by race, gender, and age using Stratus OCT. Am J Ophthalmol. 2010;149(3):496–502 e491. | ||
Chen J, Lee L. Clinical applications and new developments of optical coherence tomography: an evidence-based review. Clin Exp Optom. 2007;90(5):317–335. | ||
Major JC Jr, Wykoff CC, Mariani AF, Chen E, Croft DE, Brown DM. Comparison of spectral-domain and time-domain optical coherence tomography in the detection of neovascular age-related macular degeneration activity. Retina. 2014;34(1):48–54. | ||
Giammaria D, Ioni A, Bartoli B, Cofini V, Pellegrini G, Giannotti B. Comparison of macular thickness measurements between time-domain and spectral-domain optical coherence tomographies in eyes with and without macular abnormalities. Retina. 2011;31(4):707–716. | ||
Matt G, Sacu S, Buehl W, et al. Comparison of retinal thickness values and segmentation performance of different OCT devices in acute branch retinal vein occlusion. Eye (Lond). 2011;25(4):511–518. | ||
Tan CS, Li KZ, Lim TH. Calculating the predicted retinal thickness from spectral domain and time domain optical coherence tomography – comparison of different methods. Graefes Arch Clin Exp Ophthalmol. 2014;252(9):1491–1499. |
 © 2016 The Author(s). This work is published and licensed by Dove Medical Press Limited. The
full terms of this license are available at https://www.dovepress.com/terms
and incorporate the Creative Commons Attribution
- Non Commercial (unported, 3.0) License.
By accessing the work you hereby accept the Terms. Non-commercial uses of the work are permitted
without any further permission from Dove Medical Press Limited, provided the work is properly
attributed. For permission for commercial use of this work, please see paragraphs 4.2 and 5 of our Terms.
© 2016 The Author(s). This work is published and licensed by Dove Medical Press Limited. The
full terms of this license are available at https://www.dovepress.com/terms
and incorporate the Creative Commons Attribution
- Non Commercial (unported, 3.0) License.
By accessing the work you hereby accept the Terms. Non-commercial uses of the work are permitted
without any further permission from Dove Medical Press Limited, provided the work is properly
attributed. For permission for commercial use of this work, please see paragraphs 4.2 and 5 of our Terms.