Back to Journals » Clinical Interventions in Aging » Volume 13
Reference values of hand-grip dynamometry and the relationship between low strength and mortality in older Chileans
Authors Lera L ![]() , Albala C
, Albala C ![]() , Leyton B, Márquez C
, Leyton B, Márquez C ![]() , Angel B
, Angel B ![]() , Saguez R, Sánchez H
, Saguez R, Sánchez H
Received 30 September 2017
Accepted for publication 2 December 2017
Published 22 February 2018 Volume 2018:13 Pages 317—324
DOI https://doi.org/10.2147/CIA.S152946
Checked for plagiarism Yes
Review by Single anonymous peer review
Peer reviewer comments 4
Editor who approved publication: Dr Richard Walker
Lydia Lera, Cecilia Albala, Bárbara Leyton, Carlos Márquez, Bárbara Angel, Rodrigo Saguez, Hugo Sánchez
Public Health Nutrition Unit, Institute of Nutrition and Food Technology, University of Chile, Santiago, Chile
Aim: This study was aimed to set reference values of hand-grip strength by age and sex and validate cut points for risk of functional limitation and mortality in older Chileans.
Methods: This was a pooled analysis of four studies including 6,426 people ≥60 years of nondependent community-dwelling Chileans. After exclusion criteria, the final sample included 5,250 subjects, from whom 2,193 were followed to study all-cause mortality associated with low hand-grip strength. Face-to-face interviews registering sociodemographic characteristics, self-reported chronic diseases, and functional limitations were conducted. Anthropometric measurements and observed mobility were performed by trained professionals. Hand-grip strength was measured with a hand dynamometer T-18 (Country Technology, Inc.) before 2008 or with JAMAR brand from 2008 onwards. Percentiles were calculated through descriptive analysis and quantile regression models for specific groups of age and sex. Adjusted Cox regression hazard models for mortality risk according to low dynamometry condition and covariates were developed.
Results: We deliver reference values of hand-grip strength for older Chileans proposing the 25th percentile as the cut-off point for low dynamometry risk: men ≤27 kg, women ≤15 kg. Low hand-grip strength was associated with Instrumental Activities of Daily Living limitations (p=0.001), and altered physical performance evaluated through the Timed Up and Go test (p=0.0001), grasping (p=0.001), bending (p<0.0001), and lifting (p<0.0001). After Cox proportional hazard regression models were assessed with a median follow-up of 9.2 years, the adjusted risk of all-cause mortality associated with a hand-grip strength lower than the 25th percentile in older Chileans showed a hazard ratio of 1.39 (95% confidence interval: 1.13–1.71).
Conclusion: The cut-off points of dynamometry validated for the older Chileans allow the incorporation in the geriatric evaluation in primary health care of an easy-to-use, inexpensive indicator to identify older adults at risk of sarcopenia, frailty, and dismobility. In addition this also helps to optimize the evaluation of intervention strategies focused on the maintenance of functionality.
Keywords: hand-grip strength, dynamometry, aging, functional limitation, mortality
Introduction
Muscular strength is an important determinant of physical function in older people. Several studies have shown a close relationship between strength and muscle mass, and that the combination of sarcopenia and loss of muscle strength contributes significantly to the decline in functional ability and independence with aging. It has also been observed that decreased muscle strength is predictive of future functional decline, incidence of disability, and increased risk of all-cause mortality, cardiovascular disease, and cardiovascular mortality.1
The decrease in both the mass and the muscular strength that occurs with aging is well documented.2,3 Cross-sectional studies have shown that decreased muscle mass is associated with poor functional performance4 and self-reported disability. Loss of muscle strength is explained not only by the decrease in muscle mass. In addition to the decrease in muscle volume, the composition of the muscle changes, resulting in increased fat infiltration, an important feature of sarcopenia. Some studies4,5 have shown an association between the amount of fat infiltration in the muscle, determined by the attenuation of thigh muscle tissue through the use of computed tomography, and muscle strength and mobility.
Studies performed using calf magnetic resonance imaging and maximal plantar isometric flexion measurement have found that muscle strength decreased by more than 50% when young men (19–34 years) were compared with the elderly (69–82 years) and that the decrease in muscle volume accounts for only half of the decrease in muscle strength that occurs with aging.6 In the very old (≥85 years), a low hand-grip strength predicts a rapid decline in Activities of Daily Living performance and subsequent dependency.7
At present, dynamometry is widely used for the diagnosis of geriatric syndromes as important as sarcopenia, frailty, and dysmobility, all of which include hand-grip strength within their diagnostic criteria. However, the prognostic value largely depends on the standardization and determination of risk points for different populations. Considering that most data come from high-income countries,1 to have validated reference values for different demographic and socioeconomic contexts is imperative for making adequate comparisons and evaluating interventions.
The aim of the present study was to set reference values of hand-grip strength by age and sex and validate cut points for risk of functional limitation and mortality in older Chileans. The data are based on the pooled analysis of four studies conducted between 2000 and 2015 in older Chileans.
Methods
Study population
This is a pooled analysis of four studies of nondependent community-dwelling Chilean people 60 years and older with baseline hand-grip strength measurements conducted by our group between 2000 and 2015. The pooled sample consisted of 6,426 people ≥60 years (min–max: 61–101 years), composed as follows:
Alexandros cohort study: designed to study disabilities associated with obesity in older Chileans and composed of 3,198 older Chileans already described.8,9
HTSMayor cohort study: designed to study sarcopenia in older Chilean people. Baseline data of 439 people ≥60 years.10
PACAM study: designed to determine optimal levels of fortification with Vitamin B12 and Vitamin D in food distributed by Chile’s nutritional supplementation program for older people. Baseline data of 1,324 people ≥60 years.
National Study of Dependence in Chile: cross-sectional study of a national probabilistic representative sample of 4,766 people 60 years and older, from which a subsample of 1,465 with hand-grip strength measurements was included in the present study.
After determining the exclusion criteria (body mass index [BMI] <20 kg/m2 or ≥40 kg/m2, functional dependence, current cancer, chronic obstructive pulmonary disease, and hand osteoarthritis), 1,176 subjects were excluded. The final sample was composed of 5,250 people (37.3% men) (Figure 1). From the 5,250 subjects, 2,193 from the Alexandros and HTS Mayor cohorts study were followed to study all-cause mortality associated with low hand-grip strength (Figure 1).
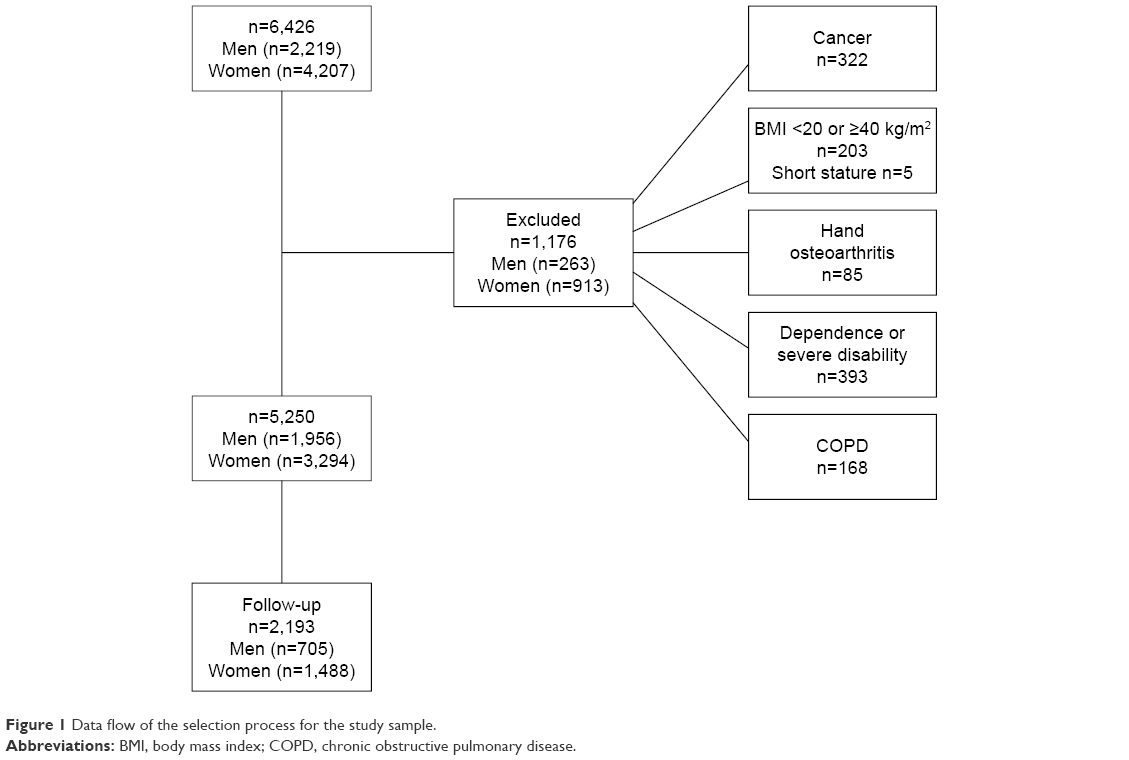 | Figure 1 Data flow of the selection process for the study sample. |
Procedures
The study and the consent form were approved by the ethics committee of the Institute of Nutrition and Food Technology. All subjects signed a consent form before any procedure was undertaken. Face-to-face interviews registering sociodemographic characteristics, self-reported chronic diseases, and functional limitations were conducted.
Anthropometric measurements, weight, height, knee height, and waist, hip, calf, and arm circumferences were performed and observed mobility was assessed by trained professionals. All measurements were done according to methods described previously.11 Height was measured in centimeters using a Harpenden Pocket Stadiometer (Holtain Ltd, Crosswell, UK) with the subject standing barefoot with heels together and head in the Frankfort horizontal plane. Weight was measured using an SECA platform scale graduated to the nearest 0.1 kg with the subject barefoot. Knee height was measured to the nearest 0.1 cm with the subject seated in a chair, using a broad-blade caliper. Waist circumference was measured in a horizontal plane around the abdomen at the level of iliac crest parallel to the floor. The mid-arm circumference was measured to the nearest 0.1 cm, midway between the lateral projection of the acromion process of the scapula and the inferior margin of the olecranon process of the ulna with the elbow flexed 90°. Calf circumference was registered in the middle of the fleshy and bulky part of the calf to the nearest 0.1 cm. Hand-grip strength measurements in kilograms were performed with a hand dynamometer T-18 (Country Technology, Inc., Gays Mills, WI, USA) with a precision of 0.1 kg in the subjects with baseline measurements before 2008 or with JAMAR brand for measurements done from 2008 onwards. Measurements were previously standardized (Lin’s concordance correlation coefficient =0.9), allowing us to use a JAMAR dynamometer, currently the gold standard for hand-grip dynamometry. The measurements were done according to the Southampton protocol with previously calibrated dynamometers, with the dominant hand, registering the highest figure. The subjects were seated, with forearms rested on the arms of the chair, asking them to exercise the maximum possible strength. The variables included in the Lawton and Brody Instrumental Activities of Daily Living (IADL) Scale12 including ability to use the telephone, shopping, food preparation, housekeeping, responsibility for own medication, laundry, mode of transportation, and ability to handle finances were used for the evaluation of IADL. Observed mobility limitations were holding 5 kg, picking up a coin from a table, and bending to pick up a pencil. Gait speed was evaluated measuring the time for a three-meters walking at usual speed. The Timed Up and Go (TUG) test measured the time, in seconds, taken by an individual to stand up from an armchair, walk a distance of 3 meters, turn, walk back to the chair, and sit down again.13
Statistical analysis
Continuous variables were expressed as mean ± standard deviation (SD) and 95% confidence intervals (95% CI). Categorical variables were expressed as percentages and 95% CI. A two-sample mean-comparison test or Pearson’s χ2 test, depending on the kind of variable and test for trend across ordered groups, was performed. Percentiles were calculated through descriptive analysis and quantile regression models for specific groups of age and sex. Kaplan–Meier survival curves and probabilities of survival were estimated for low dynamometry (≤25th percentile) condition. Cox regression hazard models for mortality risk according to low dynamometry condition and covariates adjusted by sex and age were developed. All statistical analyses were performed using STATA 15 (StataCorp.2015. Stata Statistical Software, Release 14; StataCorp LP, College Station, TX, USA).
Results
Table 1 shows sociodemographic and health characteristics of the study sample by sex. Both males and females presented similar age averages. There were no differences between age groups, living alone, years of education, and self-reported health in men and women. Women had a higher percentage of hypertension than men (65.5% vs 59.1%, p<0.0001). The men smoked significantly more than the women (62.8% vs 44.7%, p<0.0001). BMI was higher in women than in men (29.0±4.9 vs 27.7±4.0 kg/m2, p<0.0001). No differences were found between the sexes for diabetes or cardiovascular diseases. Both men and women were sedentary (73.5% vs 76%, p<0.0001), and only 15.2% of men and 6.9% of women did physical activity four or more times/wk.
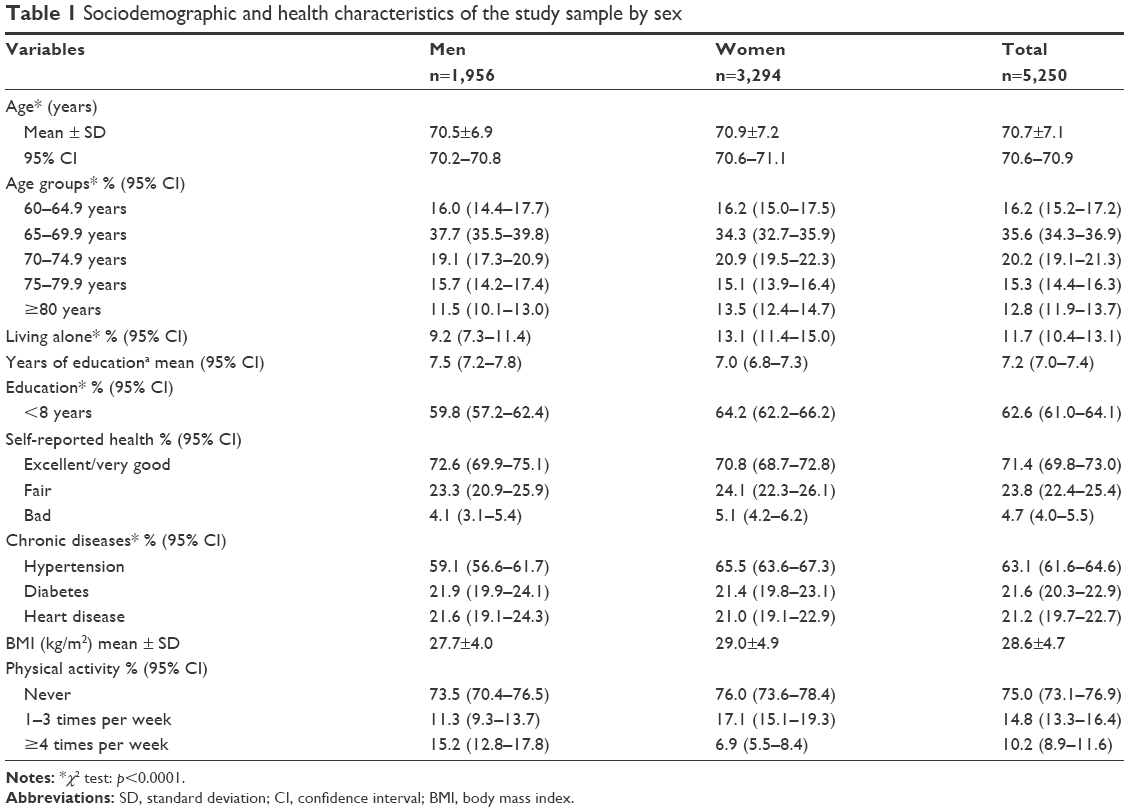 | Table 1 Sociodemographic and health characteristics of the study sample by sex |
Table 2 shows the normative values for hand-grip strength (in kg) derived from quantile regression models, according to age and sex (n=5,255). We observed that the values obtained using quantile regression models for hand-grip strength decrease with increasing age (p<0.0001). We also observed that from 70 years onward, the decrease in hand-grip strength is progressive in both sexes. In all age groups as well as in the total sample, hand-grip strength was higher in men than in women (27 vs 15.3 kg, p<0.0001).
 | Table 2 Normative values for hand-grip strength derived from quantile regression models, according to age and sex (n=5,255) |
In Table 3, we describe functional and physical performance according to dynamometry. All the variables studied, including gait speed, calf, and mid-arm circumferences; IADL limitations; TUG; bending; lifting; and grasping, were performed better by subjects with dynamometry above 25th percentile (≥ p25) than in individuals with a hand-grip strength under p25.
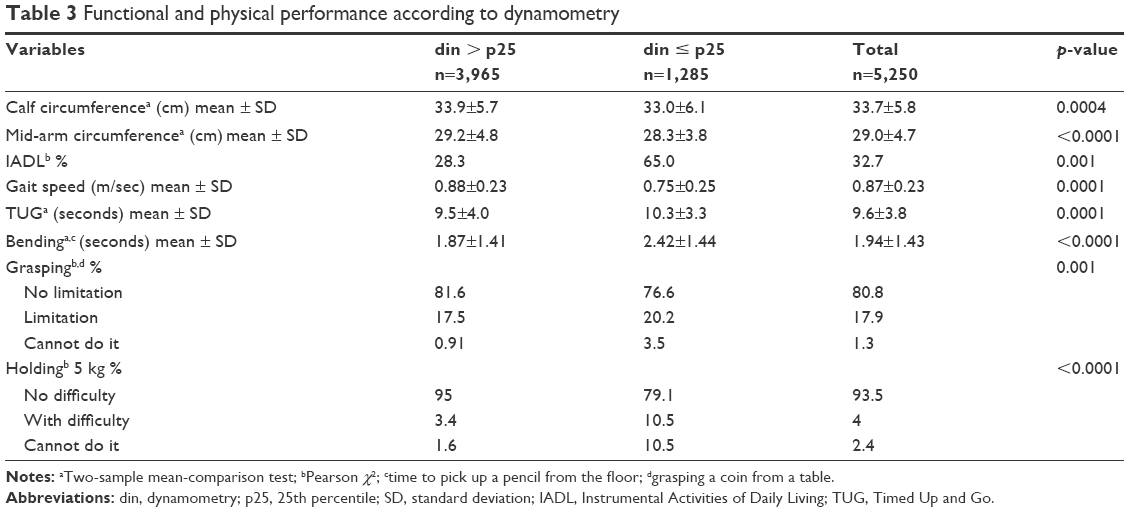 | Table 3 Functional and physical performance according to dynamometry |
Figure 2 shows Kaplan–Meier survival estimates according to hand-grip strength, demonstrating the lowest survival rates for people with low hand-grip strength in both sexes (log-rank test for equality of survivor functions: p<0.0001).
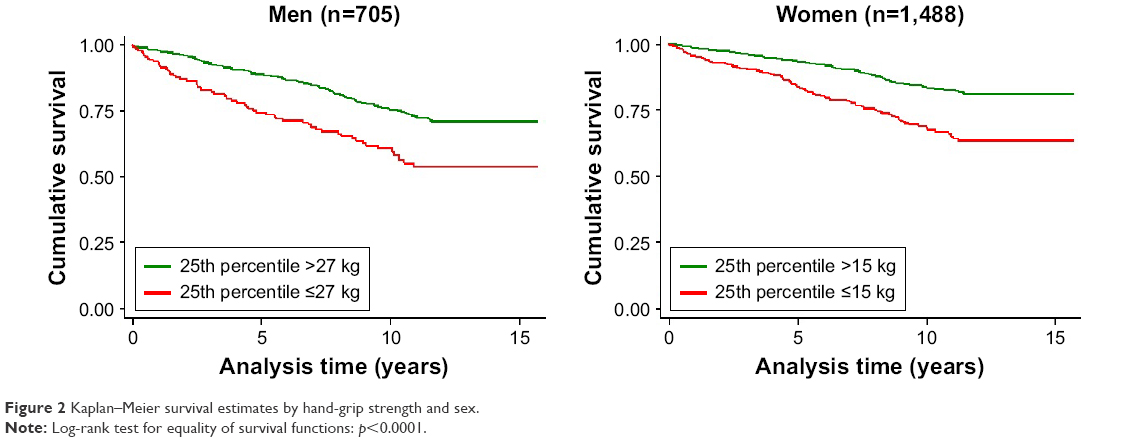 | Figure 2 Kaplan–Meier survival estimates by hand-grip strength and sex. |
After adjusting by age, sex, nutritional status, number of chronic diseases, and smoking, hazard ratios for death showed higher risk in subjects with low muscle strength in all models, in comparison to people with normal muscle strength (Table 4). Cox proportional hazards models show an association between low muscle strength and mortality for all causes, independent of patient characteristics of age, sex, obesity, number of chronic diseases, and smoking habits.
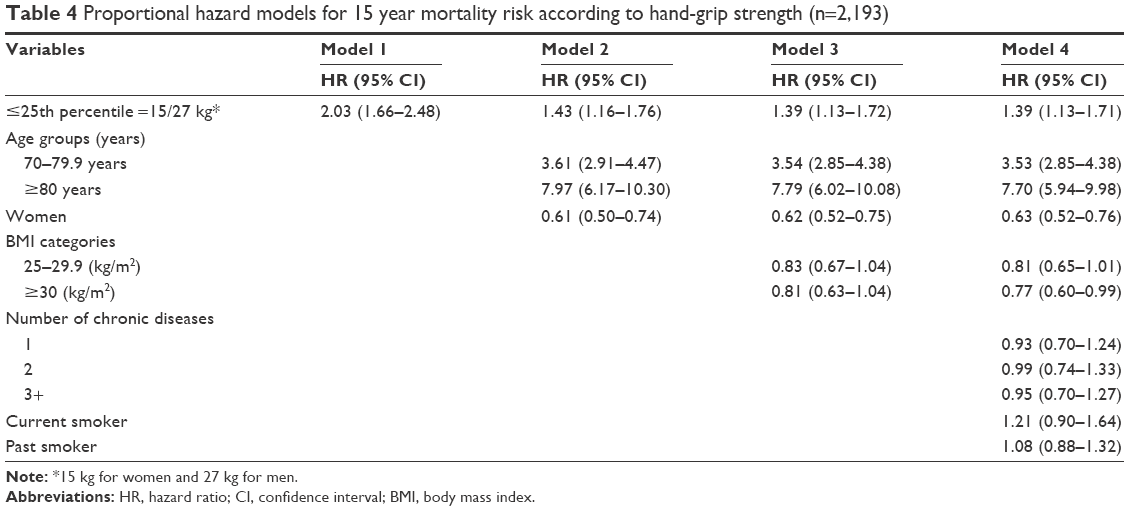 | Table 4 Proportional hazard models for 15 year mortality risk according to hand-grip strength (n=2,193) |
Discussion
Dynamometry is widely used in the physical assessment of older people. It correlates with other muscle groups’ strength and is a good indicator of overall strength.14 In this study, we report reference values of hand-grip strength for older Chileans based on a pooled analysis of 5,255 subjects 60 years and older, proposing p25 as the cut-off point for low dynamometry risk: men ≤27 kg, women ≤15 kg. In previous studies based on the SABE study,15 we defined low dynamometry under the value of the 25th percentile of the distribution, yielding the same values as in the present study for both men and women. With this definition, low hand-grip strength was associated at baseline with calf circumference, a proxy for muscle mass,16,17 IADL limitations, and altered physical performance were evaluated through TUG, grasping, bending, and lifting. In previous studies, we demonstrated that a low dynamometry and muscle mass are the main predictors of osteoporosis in Chilean older people.18 We also validated these values for use in the identification of sarcopenia10 and frailty.9 These results are in agreement with several studies reporting the same associations.2,3,7 The abovementioned studies demonstrate that muscle function is as important as, or more important than, muscle mass size and validates hand dynamometry as an indicator of functionality.
Using Cox proportional hazard regression models with a median follow-up of 9.2 years, we observed an increased risk of all-cause mortality associated with a hand-grip strength lower than p25 (hazard ratio =1.39 [95% CI: 1.13–1.71]). Although we cannot discard the influence of other nonmeasured parameters on the association between grip strength and mortality, several longitudinal studies have reported similar findings. The studies of Newman et al,19 who performed force measurements on both the upper and lower extremities, found the same association. Moreover, they observed that hand dynamometry delivers estimates of mortality risk similar to those of quadriceps strength.
Rantanen et al14 evaluated the risk of mortality in a 30-year follow-up study in healthy men aged 45–64 years at baseline and found that baseline hand dynamometry was associated with mortality regardless of BMI. In the KORA-age study20 a significant adjusted association of hand-grip strength with all-cause mortality was observed. Moreover, a dose–response relationship was observed for mortality according to tertiles of dynamometry, with the association being higher for women than for men. In the review of Volaklis21 including 23 large studies, the association between low hand-grip strength and all-cause mortality was strong after adjusting for several covariates. However, standardized methods are needed to compare results.22 Previous research suggests that measurements done with different dynamometers are similar to JAMAR brand, considered the gold standard for the study of reliability of measurements.22 Cuesta-Vargas and Hilgenkamp23 estimated the grip strength reference values for adults with intellectual disability and no intellectual disability in a large sample of 1,526 adults aged between 20 and 90 years using a JAMAR dynamometer. Mitsionis et al24 established data on normal grip strength and explored possible associations with anthropometric parameters in 232 individuals with a mean age of 39.8 years, also using a JAMAR dynamometer. A normative reference for the German population based on measurements done with a Smedley dynamometer in 11,790 people 17–90 years old has recently been published.25
Different authors have reported reference values of grip strength using different methods and cut-off points in different age groups and by sex. In the abovementioned German study,25 the cut-off for risk was defined as 2 SD under the maximum grip strength through the life course, although the author suggests that the threshold for increased mortality risk is between 1 SD and 2 SD below the standardized mean of the hand-grip strength. Our reference values for hand-grip strength are derived from quantile regression models, according to age and sex, selecting the 25th percentile as the cut-off point for risk. Dodds et al26 calculated normative data for grip strength during life course from 12 studies in Britain. They used the least mean squares method and modeled the mean and SD of the grip strength at each age using the normal distribution. Seino et al27 determined age- and sex-specific reference values for six measures of physical performance, including hand-grip strength, in a large sample of nondisabled community-dwelling older Japanese. Our reference values are lower than others reported,25,28 although this can be explained by the morphological characteristics of the Latin American population, who are different from the Europeans.29
Considering the important differences in the criteria for selecting cut-off values and the different outcomes related to low dynamometry such as functional and physical performance, disability, institutionalization, and mortality, it is important to validate the reference values for their use along with health indicators. Besides the association with functional and physical performance and the higher risk of mortality in people with low dynamometry, we also developed an anthropometric equation for muscle mass prediction,29 which includes dynamometry as one of its variables, allowing the identification of sarcopenia in older adults10 without resorting to an expensive and inaccessible method in the Chilean public health network, such as dual-energy X-ray absorptiometry.
Among the strengths of the present study are the large size of the national sample of older adults and the longitudinal study design to validate cut-off points against mortality. The main limitation of this study is the use of dynamometers of two brands, but we did not find differences between the measurements made with the JAMAR or Country Technology dynamometers.
Conclusion
Having cut-off points of dynamometry validated for the older Chilean population allows the incorporation in the geriatric evaluation at the Chilean Primary Health Care Centers of an easy-to-use, inexpensive indicator to identify older adults at risk of sarcopenia, frailty, and dismobility.30 In addition, it has important implications for future interventions and programs, helping to optimize the identification of subjects at risk, as well as the evaluation of intervention strategies focused on the maintenance of functionality, considering the negative association of dynamometry with mortality, disability, and institutionalization.
Acknowledgment
Research related to this study was funded by the Chilean National Fund for Scientific and Technological Development (Fondecyt grant 1130947 and Fondef 15I10053).
Disclosure
The authors report no conflicts of interest in this work.
References
Leong DP, Teo KK, Rangarajan S, et al. Prognostic value of grip strength: findings from the Prospective Urban Rural Epidemiology (PURE) study. Lancet. 2015;386(9990):266–273. | ||
Sternfeld B, Ngo L, Satariano WA, Tager IB. Associations of body composition with physical performance and self-reported functional limitation in elderly men and women. Am J Epidemiol. 2002;156(2):110–121. | ||
Landers KA, Hunter GR, Wetzstein CJ, Bamman MM, Weinsier RL. The interrelationship among muscle mass, strength, and the ability to perform physical tasks of daily living in younger and older women. J Gerontol A Biol Sci Med Sci. 2001;56(10):B443–B448. | ||
Visser M, Kritchevsky S, Goodpaster B, et al. Leg muscle mass and composition in relation to lower extremity performance in men and women aged 70 to 79: the health, aging and body composition study. J Am Geriatr Soc. 2002;50(5):897–904. | ||
Goodpaster BH, Carlson CL, Visser M, et al. Attenuation of skeletal muscle and strength in the elderly: The Health ABC Study. J Appl Physiol. 2001;90(6):2157–2165. | ||
Morse CI, Thom JM, Mian OS, Muirhead A, Birch KM, Narici MV. Muscle strength volume and activation following 12-month resistance training in 70-year-old males. Eur J Appl Physiol. 2005;95:197–204. | ||
Taekema DG, Gussekloo J, Maier AB, Westendorp RG, de Craen AJ. Handgrip strength as a predictor of functional, psychological and social health. A prospective population-based study among the oldest old. Age Ageing. 2010;39(3):331–337. | ||
Albala C, Sánchez H, Lera L, Angel B, Cea X. Socioeconomic inequalities in active life expectancy and disability related to obesity among older people. Rev Med Chil. 2011;139(10):1276–1285. | ||
Albala C, Lera L, Sánchez H, et al. Frequency of Frailty and its association with mental health and survival in Chilean older people. J Cachexia Sarcopenia Muscle. In press 2015:995–1001. | ||
Lera L, Albala C, Sánchez H, et al. Prevalence of sarcopenia in community-dwelling Chilean elders according to an adapted version of the European Working Group on Sarcopenia in Older People (EWGSOP) criteria. J Frailty Aging. 2017;6(1):12–17. | ||
Santos JL, Albala C, Lera L, et al. Anthropometric measurements in the elderly population of Santiago, Chile. Nutrition. 2004;20(5):452–457. | ||
Lawton MP, Brody EM. Assessment of older people: self-maintaining and instrumental activities of daily living. Gerontologist. 1969;9:181. | ||
Podsiadlo D, Richardson S. The timed “Up & Go”: a test of basic functional mobility for frail elderly persons. J Am Geriatr Soc. 1991;39(2):142–148. | ||
Rantanen T, Volpato S, Ferrucci L, et al. Handgrip strength and cause-specific and total mortality in older disabled women: exploring the mechanism. J Am Geriatr Soc. 2003;51(5):636–641. | ||
Arroyo P, Leraa L, Sánchez H, Bunout D, Santosb JL, Albala C. Indicadores antropométricos, composición corporal y limitaciones funcionales en ancianos. Rev Med Chil. 2007;135(7):846–854. | ||
Arango-Lopera VE, Arroyo P, Gutiérrez-Robledo LM, Pérez-Zepeda MU, Cesari M. Prevalence of sarcopenia in Mexico City. Eur Geriatr Med. 2012;3:157–160. | ||
Samper-Ternent R, Reyes-Ortiz C, Ottenbacher KJ, Canco CA. Frailty and sarcopenia in Bogotá: results from the SABE BogotáStudy. Aging Clin Exp Res. 2017;29(2):265–272. | ||
Albala C, Lera L, Sánchez H, Angel B, Arroyo P, Cea X. Body composition and 5y incidence of osteoporosis in Chilean elders. International. Osteoporosis. 2010;21(Suppl 1):S69. | ||
Newman AB, Kupelian V, Visser M, et al. Strength, but not muscle mass, is associated with mortality in the health, aging and body composition study cohort. J Gerontol A Biol Sci Med Sci. 2006;61(1):72–77. | ||
Arvandi M, Strasser B, Meisinger C, et al. Gender differences in the association between grip strength and mortality in older adults: results from the KORA-age study. BMC Geriatr. 2016;16(1):201. | ||
Volaklis KA, Halle M, Meisinger C. Muscular strength as a strong predictor of mortality: a narrative review. Eur J Intern Med. 2015;26(5):303–310. | ||
Roberts HC, Denison HJ, Martin HJ, et al. A review of the measurement of grip strength in clinical and epidemiological studies: towards a standardised approach. Age Ageing. 2011;40(4):423–429. | ||
Cuesta-Vargas A, Hilgenkamp T. Reference values of grip strength measured with a Jamar dynamometer in 1526 adults with intellectual disabilities and compared to adults without intellectual disability. PLoS One. 2015;10(6):e0129585. | ||
Mitsionis G, Pakos EE, Stafilas KS, Paschos N, Papakostas T, Beris AE. Normative data on hand grip strength in a Greek adult population. Int Orthop. 2009;33(3):713–717. | ||
Steiber N. Strong or weak handgrip? normative reference values for the German population across the life course stratified by sex, age, and body height. PLoS One. 2016;11(10):1–14. | ||
Dodds RM, Syddall HE, Cooper R, et al. Grip strength across the life course: normative data from twelve British studies. PLoS One. 2014;9(12):e113637. | ||
Seino S, Shinkai S, Fujiwara Y, et al. Reference values and age and sex differences in physical performance measures for community-dwelling older Japanese: a pooled analysis of six cohort studies. PLoS One. 2014;9(6):e99487. | ||
Bahat G, Tufan A, Tufan F, et al. Cut-off points to identify sarcopenia according to European Working Group on Sarcopenia in Older People (EWGSOP) definition. Clin Nutr. 2016;35(6):1557–1563. | ||
Lera L, Albala C, Ángel B, et al. Anthropometric model for the prediction of appendicular skeletal muscle mass in Chilean older adults. Nutr Hosp. 2014;29(3):611–617. | ||
Lino VTS, Rodrigues NCP, O’Dwyer G, Andrade MKDN, Mattos IE, Portela MC. Handgrip strength and factors associated in poor elderly assisted at a primary care unit in Rio de Janeiro, Brazil. PLoS One. 2016;11(11):1–11. |
 © 2018 The Author(s). This work is published and licensed by Dove Medical Press Limited. The
full terms of this license are available at https://www.dovepress.com/terms
and incorporate the Creative Commons Attribution
- Non Commercial (unported, 3.0) License.
By accessing the work you hereby accept the Terms. Non-commercial uses of the work are permitted
without any further permission from Dove Medical Press Limited, provided the work is properly
attributed. For permission for commercial use of this work, please see paragraphs 4.2 and 5 of our Terms.
© 2018 The Author(s). This work is published and licensed by Dove Medical Press Limited. The
full terms of this license are available at https://www.dovepress.com/terms
and incorporate the Creative Commons Attribution
- Non Commercial (unported, 3.0) License.
By accessing the work you hereby accept the Terms. Non-commercial uses of the work are permitted
without any further permission from Dove Medical Press Limited, provided the work is properly
attributed. For permission for commercial use of this work, please see paragraphs 4.2 and 5 of our Terms.