Back to Journals » Research Reports in Clinical Cardiology » Volume 7
Real-time three-dimensional speckle tracking echocardiography: technical aspects and clinical applications
Authors Sorrentino R, Esposito R, Pezzullo E, Galderisi M
Received 20 July 2016
Accepted for publication 13 September 2016
Published 24 November 2016 Volume 2016:7 Pages 147—158
DOI https://doi.org/10.2147/RRCC.S107374
Checked for plagiarism Yes
Review by Single anonymous peer review
Peer reviewer comments 2
Editor who approved publication: Dr Richard Kones
Regina Sorrentino, Roberta Esposito, Enrica Pezzullo, Maurizio Galderisi
Department of Advanced Biomedical Sciences, Interdepartmental Laboratory of Cardiac Imaging, Federico II University Hospital, Naples, Italy
Abstract: Three-dimensional speckle tracking echocardiography (3D STE) is a novel technique for the quantification of cardiac deformation based on tracking of ultrasonic speckles in gray scale full-volume 3D images. Developments in ultrasound technologies have made 3D speckle tracking widely available. Two-dimensional echocardiography has intrinsic limitations regarding estimation of left ventricular (LV) volumes, ejection fraction, and LV mechanics, due to its inherent foreshortening errors and dependency on geometric models. The development of 3D echocardiography has improved reproducibility and accuracy. Data regarding the feasibility, accuracy, and clinical applications of 3D STE are rapidly assembling. From the tracking results, 3D STE derives several parameters, including longitudinal, circumferential and radial strain, as well as a combined assessment of longitudinal and circumferential strain, termed area strain. 3D STE can also quantify LV rotational movements such as rotation, twist, and torsion. 3D STE provides a better insight on global and regional myocardial deformation. Main applications include detection of subclinical myocardial involvement in heart failure, arterial hypertension, dyssynchrony, and ischemic heart disease. Emerging areas of application include a large spectrum of heart-involving systemic conditions, such as prediction of rejection in heart transplant patients, early detection of cardiotoxicity in patients receiving chemotherapy for cancer, and deeper physiological understanding of LV contraction mechanics in different types of athletes. Aim of this review is to discuss background, technical acquisition and processing aspects as well as recognized and developing clinical applications of this emerging ultrasound technology.
Keywords: speckle tracking echocardiography, three-dimensional echocardiography, myocardial deformation, validation, clinical applications
Introduction
Ultrasonic myocardial deformation imaging techniques allow the quantitative analysis of strain (i.e., the relative lengthening or shortening of the myocardial segment expressed as a percentage of its initial length) and strain rate (i.e., the rate of this lengthening or shortening). Both these measurements are gaining field in either clinical or research purposes. Speckle tracking echocardiography (STE), due to its ability to discriminate between active and passive myocardial segment movements, estimate myocardial deformation, and quantify intraventricular dyssynchrony, allows a comprehensive assessment of myocardial function.1
From its introduction in the clinical setting, real-time three-dimensional (RT3D) echocardiography has clearly demonstrated the ability in improving the accuracy of evaluation of cardiac chamber volumes by eliminating the need for geometric modeling and the errors caused by foreshortened apical views.2,3 As a result, more and improved imaging modalities are available for evaluating cardiac anatomy, ventricular function, blood flow velocity, and valvular diseases. Since 2006, one of the most significant advances in this field has been the development and refinement of RT3D-STE. This new ultrasound equipment and technique improves and expands the diagnostic capabilities of cardiac ultrasound, providing superior image quality, greater accuracy, and have the potential to overcome many of the limitations of two-dimensional (2D) STE. 3D echocardiographic imaging has developed software that track the motion of speckles and allow a homogeneous spatial distribution of each component of the myocardial displacement vector, irrespective of the speckle direction.4
Our purpose is to review the scientific basis for and the clinical use of 3D ultrasound imaging of the heart and provide readers with an update on the latest developments and the current status of this noninvasive imaging tool. The different potential applications of RT3D echocardiography imaging will be described here separately, and each application will be discussed.
3D STE offers the advantage of a complete analysis of the left ventricle from a single volume of data obtained from the apical transducer position. 3D speckle tracking in RT3D echocardiography data sets has the potential to overcome the intrinsic limitations of 2D STE (Table 1) since it does not rely on 2D views that can be foreshortened, and the motion tracking of the speckles is done within the scan volume, heedless of their direction, having the advantage to assess left ventricular (LV) deformation inside a volumetric image rather than into bidimensional sections.5 In addition, its use is less time consuming; it considerably reduces the duration of analysis to one-third in comparison with 2D STE as it calculates all the strain components within the same heart beat, that is at the same heart rate and under the same loading conditions.6 These circumstances cannot be obtained by 2D STE, which needs the acquisition of multiple views to determine the different directional strains.
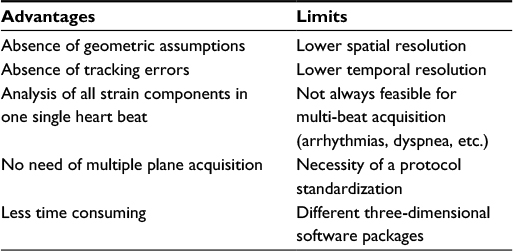 | Table 1 Advantages and limits of real-time three-dimensional speckle tracking echocardiography |
Different studies have described that longitudinal strain (LS) values do not differ substantially between 3D STE and 2D STE.7,8 However, significantly higher absolute 3D STE-derived circumferential (CS) values than those derived by 2D STE were found, due to the “out of plane phenomenon”. Accordingly, the same authors showed that LV twisting also affects LS values: higher twisting is a major determinant of differences between 2D and 3D LS values. Based on these findings, 3D STE can have a better insight in LV translation and rotation effects and may provide reliable deformation data compared to 2D STE for the assessment of LV contraction.9 Based on all these findings, RT3D-STE appears potentially to be more accurate and efficient than 2D STE in the assessment of LV myocardial function.10–15
3D technique has required rigorous testing and comparison against other accepted techniques on different levels. The accuracy of the new RT3D echocardiography side by side with 2D STE against cardiac magnetic resonance (CMR) reference values, in patients with a wide range of LV sizes and functions, has been validated for LV volume and mechanics measurements, demonstrating its superior accuracy and reproducibility over 2D STE.16 3D measurements of LV volumes and mechanics were found to be in close agreement with the CMR reference values, and the levels of agreement, in the same population, had higher correlation coefficients, smaller biases, and tighter limits of agreement, and therefore were higher than for 2D measurements.16–19 Moreover, 3D measurements showed lower interobserver and intra-observer variability levels and thus are more reproducible than the corresponding 2D measurements.16
Despite growing interest in applying 3D STE to measure LV myocardial deformation in various diseases, normal values for 3D STE parameters and effects of demographic, hemodynamic, and technical factors on these values are still subject of study. Normal ranges of global and regional LV strain using 3D STE have been established for clinical use (Table 2). Sex and age-related differences in the magnitude of LV strain, which may reflect myocardial maturation and aging, as well as differences between different myocardial segments, walls, and levels as part of the functional nonuniformity of the normal left ventricle, were observed.17 This suggests the use of segment-specific normal ranges for radial and longitudinal strains. Circumferential and area strains demonstrate the most consistent normal ranges overall.17–20 In healthy subjects, reference values of LV 3D strain parameters are significantly influenced by demographic, cardiac, and technical factors. Limits of normality of LV strain by 3D STE should not be used interchangeably with 2D STE or with 3D STE software.20,21
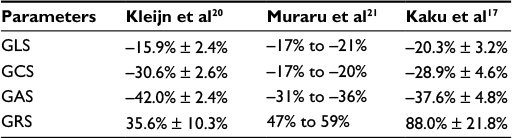 | Table 2 Normal ranges of three-dimensional speckle tracking echocardiography Abbreviations: GLS, global longitudinal strain; GCS, global circumferential strain; GAS, global area strain; GRS, global radial strain. |
Technical aspects
RT3D echocardiography allows for the simultaneous acquisition of full-volume data sets; it is usually performed during a breath hold by multi-beat acquisition to ensure high temporal and spatial resolution and to avoid stitch artifacts. New transducer technology is able to provide a one-beat full-volume acquisition, particularly useful in patients with irregular heartbeats, such as atrial fibrillation, and in children in whom breath hold may be challenging.
A 3D echocardiographic study combines an integrated assessment of biventricular volumes and function, valvular morphology, and hemodynamic conditions.
3D echocardiography is inherently volumetric, on the contrary of 2D echocardiography, in which standard views rely on a single plane. From an apical approach, acquisition of full-volume scans is made using a frame rate (in volume per second) higher than 40% of the individual heart beat or >25 frames per second, in order to raise the recognition of the “speckles” in successive frames. Accordingly, during end-expiratory apnea, up to 6 ECG-gated consecutive beats are acquired (multi-beat acquisition) producing a full-volume scan from single-beat sub-volumes, securing an appropriate frame rate for following analysis.
Before storing the volume data set, a 12-slice display mode may be selected to check the acquisition quality and to certify that the entire LV cavity and walls are included in the full-volume scan (Figure 1).
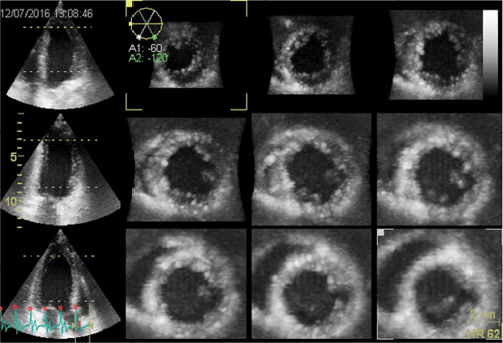 | Figure 1 Three-dimensional 12-slice display of full-volume acquisition. Nine short axis views (three basal, three middle, and three apical of the left ventricle) and three apical views (four chamber, two chamber, and long axis) are displayed. The operator can ensure that the entire left ventricular cavity and walls are included in the full volume before storing the volume data set. |
The software provides image automatic or semiautomatic alignment. Endocardial boundaries are defined in the end-diastolic volume and propagated to end systole, allowing the estimation of volumes and LV ejection fraction (LVEF). Next step is the definition of the subepicardial borders and subsequently the estimation of LV mass. For the conservation of mass as a restriction, end-systolic and end-diastolic masses are comparable.
The 3D strain post-processing tracks ‘speckles’ from frame to frame inside the 3D image in each of the three dimensions over time. The previously established borders, during LV mass acquisition stage, are used to define a region of interest (ROI), which encompasses the LV myocardial wall (i.e., from the endocardium to the epicardium). ROI’s shape may be corrected by placing attractor points to pull the nearby ROI border toward. This represents a further quality check for the correct processing of the data set. All areas inside the ROI are tracked. Software generates regional and global directional strains, longitudinal (GLS) (Figure 2A), circumferential (GCS) (Figure 2B), and radial (GRS) (Figure 2C), as well as the area strain (GAS) (Figure 2D) and presents them through strain curves and 17-segment color-coded bull’s eye plot. Directional strains are calculated from variations of distance in their own respective directions. On the contrary, the area strain (AS) and GAS are, respectively, the measure of the relative % change in the area of a given myocardial segment and in the whole chamber. Hence, they represent the myocardial surface percentage change from its initial dimensions.
 | Figure 2 3D longitudinal (A), circumferential (B), radial (C), and area (D) strain imaging, based on speckle tracking in a healthy volunteer. For each panel, the upper part shows a plot with yellow traces for each of the 17 segments, in addition to a white trace for the global strain. The lower part shows a color-coded bull’s eye plot with instantaneous strain values. The instantaneous global strain is shown marked with a “G:” to the lower left of the bull’s eye plot. (Care should be taken when comparing 2D AFI and 3D strain, as the strain values in 2D AFI are the peak systolic values, including positive peaks, while in 3D strain representation the strain values from the current frame, typically the end systolic frame, are used.) Abbreviations: 3D, three dimensional; 2D, two dimensional; AFI, . |
RT3D-STE software also generates LV basal and apical rotation angles and LV twist time curves, from which peak basal rotation, peak apical rotation, peak LV twist, and peak LV torsion are automatically measured.22 In a normal heart, the base and apex are rotating in opposite directions. The bull’s eye is divided into 4 rings: base, mid, and apical regions and apex; for base, mid, and apical regions, a single curve (yellow) is displayed. LV twist represents the amount of rotation of the different sections of the left ventricle, expressed in degrees. The white curve shows the difference between the apical and base rotation, which is known as twist, by using the following formula: rotation of the apex – rotation of the base (Figure 3A). LV torsion represents the amount of rotation in degrees normalized by the length of the left ventricle (°/cm). Again, for base, mid, and apical regions, a single curve (yellow) is displayed, showing the torsion of this segment. The white curve shows the global torsion, which is calculated by dividing the twist by the length of the left ventricle (Figure 3B).
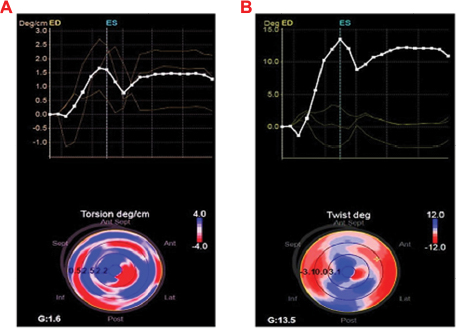 | Figure 3 Three-dimensional torsion (A) and twisting (B) strain imaging, based on speckle tracking in a healthy volunteer. |
Clinical applications
3D STE has been applied in several clinical subsettings, mainly for research purposes (Table 3).
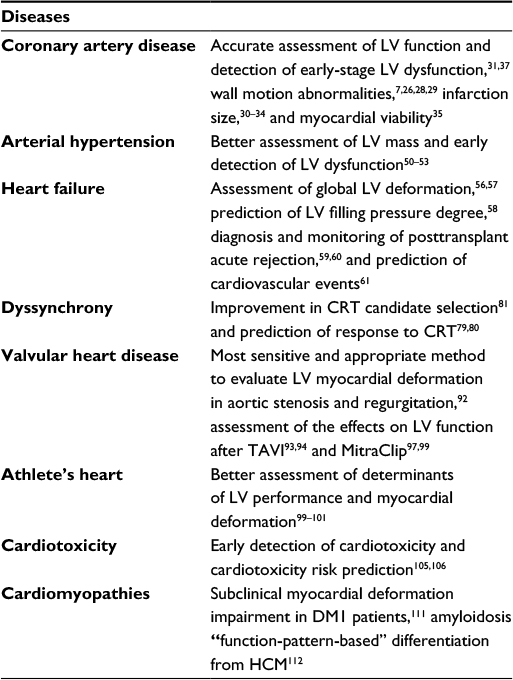 | Table 3 Clinical applications of real-time three-dimensional speckle tracking echocardiography Abbreviations: LV, left ventricle; CRT, cardiac resynchronization therapy; TAVI, transcatheter aortic valve implant; DM1, dystrophia myotonica type 1; HCM, hypertrophic cardiomyopathy. |
Coronary artery disease
Systolic LV function based on visual wall motion analysis and LVEF measurement and visual wall motion abnormalities using 2D echocardiography is subjective and poorly sensitive and reproducible. Myocardial deformation indexes, strain and strain rate, have emerged as helpful tools for a comprehensive assessment of myocardial function,23 being superior to wall motion analysis and LVEF in detecting early myocardial dysfunction and outcomes in ischemic patients.24 However, 2D strain suffers for the intrinsic limitations of 2D imaging, which prevents a full assessment of the complex myocardial deformation, for radial and circumferential strains in particular. RT3D-STE, having the potentials to overcome these limitations,25,26 provides a more accurate and convenient assessment in this clinical setting. The possible incremental value of resting 3D STE in the detection of early-stage LV impairment in patients with coronary artery disease has been widely assessed.7,27,28 RT3D-STE, in particular GAS,29 has been evaluated for regional wall motion indexes, demonstrating its superiority over 2D STE.26 When compared to single-photon emission computed tomography and magnetic resonance imaging, longitudinal and area strains by 3D STE correlate with infarct size, providing an accurate and reproducible measurement of myocardial deformation in patients with ischemic LV dysfunction. The superiority of RT3D-STE is salient for regional strain values; in particular, area, longitudinal, and circumferential 3D strains correlate with global scar extent.30–32 RT3D-STE may provide indirect means for the accurate determination of transmural involvement in infarct segments.33,34 In this context, one of the major potentials for RT3D-STE’s future is the possibility to widen knowledge into cardiac pathophysiology and disease process.
Moreover, RT3D-STE may provide a new way to assess myocardial viability35 and ischemia-related changes in myocardial deformation before the stage of wall motion abnormality in patients with acute myocardial infarction.36,37 In patients with myocardial bridging, GLS and AS correlated with the increasing severity of systolic compression of the mural coronary artery and were significantly lower in patients with reduced fractional flow reserve (<0.75) than in those with normal fractional flow reserve. These data suggest that RT3D-STE can detect subtle myocardial dysfunction in patients with myocardial bridging.38
New initial experiences with 3D-derived STE highlight the potential usefulness of this technique during stress echo, in both animals and humans.39,40 However, this kind of application is still far from being of current clinical practice.
Arterial hypertension
Heart involvement in patients affected by arterial hypertension has been extensively evaluated by standard echocardiography. Measurements of LV mass identify LV hypertrophy, which is an independent predictor of morbidity and mortality,41 whereas LV concentric or eccentric (normal) geometry is differentiated by relative wall thickness.42
Measures of LV systolic function derived from standard 2D echocardiography and Doppler indices of LV diastolic function, as well as innovative evaluation of myocardial deformation by two-dimensional STE, are used in a large number of studies in hypertensive cohorts. By this technique, longitudinal strain has been demonstrated to be lower in hypertensive patients with LV hypertrophy than in those without LV hypertrophy.43 2D GLS is the earliest systolic deformation component to be impaired in native hypertensive patients when diastolic abnormalities are already detectable, but LV geometry is still normal.44
In this context, RT3D-STE can easily provide additional insight.45 RT3D echo has been successfully compared in different clinical contexts, with CMR for the assessment of the LV mass.46–48
In the assessment of LV function, comparative studies have shown that global strains derived from RT3D-STE are as accurate as LVEF obtained by 2D and 3D echocardiography. There is a good correlation between 2D GLS and 3D GLS as well as good intra-observer, interobserver, and test–retest agreements. Time for image acquisition to post-processing analysis was significantly reduced with RT3D-STE compared with 2D STE.49
Galderisi et al50 first assessed LV structure, systolic function, and strain components using RT3D-STE as an alternative to standard echocardiography in newly diagnosed hypertensive patients. Myocardial deformation impairment involved GLS, GRS, and GAS and was manifest in patients without LV hypertrophy and with normal EF, showing an additional and reliable detection of early myocardial deformation abnormalities. Interestingly, all the parameters obtained by RT3D-STE had good reproducibility and thus appear amply reliable in the setting of hypertensive patients. In another study,51 impaired LV mechanics and functional capacity were found in uncontrolled and untreated hypertensive patients in comparison with controls and well-controlled hypertensives. 3D GLS, GCS, GRS, and GAS were significantly decreased in patients with untreated or inadequately controlled hypertension, but were comparable among the normal group and well-controlled hypertensive patients. Accordingly, LV torsion and twist rate had analogous trends. On the contrary, LV untwisting rate progressively worsened from the controls, through the well-controlled group, to the patients with untreated or uncontrolled hypertension.
LV phasic strain rate, subendocardial strain rate during systole, assessed by RT3D-STE proved to be a valuable tool for the prediction of subclinical LV layer dysfunction in hypertensive patients.52 RT3D-STE was investigated in well-treated type 2 diabetes patients with or without hypertension. 3D STE was able to detect even subclinical changes. In fact, impaired LV strain shown in early-stage diabetic patients with well-controlled blood glucose and blood pressure was deteriorated by concomitant hypertension.53
Heart failure
Early diagnosis and treatment of patients with asymptomatic LV systolic dysfunction and overt heart failure (HF) are promoted by recent major HF guidelines,54 as this population’s life expectancy and prevalence of cardiovascular risk factors in general population are rising globally. LVEF is the most used echocardiographic index of myocardial systolic function, despite its low sensitivity. Early myocardial dysfunction may alternatively be comprehensively detected using strain, a direct measure of myocardial tissue deformation.55
In this context, the newly developed RT3D-STE is an encouraging tool to accurately measure LV strain.7,16 GLS, GCS, GRS, and in particular GAS, accordingly with LVEF, have shown a downward trend from normal controls to patients with end-stage HF.56,57Measurement of GAS is a sensitive and reproducible tool for an accurate and comprehensive assessment of global LV deformation.56 GAS and in particular the early diastolic area change rate (E-ACR) have been tested: E and E-ACR ratio (E/E-ACR) can accurately predict LV filling pressure degree in both patients with reduced and preserved EF (≥50 %).58 RT3D-STE has also been evaluated in the identification of myocardial pathophysiological mechanics in heart transplant recipients and for noninvasive monitoring and diagnosis of posttransplant acute rejection.59,60 Significantly impaired global and regional mechanics obtained with RT3D-STE, particularly evident for GLS, had independent association with NYHA functional class, highlighting a relationship between myocardial mechanics and clinical status in heart transplant recipients. Moreover, some authors have proved that the assessment of contractile reserve during dobutamine infusion using 3D GCS in patients with idiopathic dilated cardiomyopathy may predict cardiovascular events, with clinical implications for these patients’ management.61
Dyssynchrony
LV dyssynchrony has been studied in assessing cardiac resynchronization therapy (CRT) patients’ selection and responses. CRT is an established therapy for patients with advanced chronic HF with electromechanical delay.62,63 In patients with HF and cardiac dyssynchrony, CRT has benefits on symptoms, functional capacity, cardiac function, and prognosis.64 QRS morphology and width are important determinants of response to CRT, although approximately one-third of patients do not improve after CRT.65 Moreover, little is known on how to select patients for CRT for class IIa or IIb indication (with non-left bundle branch block morphologies or QRS duration of 120–149 ms). In this context, baseline mechanical dyssynchrony may contribute to further selection criteria and add prognostic information.66 The presence and grade of baseline mechanical dyssynchrony, along with the intercourse with QRS duration and morphology, is studied in relation to CRT response and following outcomes. Despite several imaging techniques and standard echocardiographic parameters have been evaluated for the identification of LV mechanical dyssynchrony, in a multicenter study none of them showed evident improvement in CRT candidate selection when compared to standard criteria.67
3D echocardiographic measurement of LV systolic dyssynchrony index (SDI) may be a valuable and feasible tool for the prediction of short- and long-term response to CRT and further improve patient selection for CRT.68,69 Moreover, different studies have demonstrated the superiority of 3D echocardiography over tissue Doppler imaging in the assessment of LV reverse modeling and identification of optimal pacing site.70,71 SDI quantifies the severity of cardiac dyssynchrony as it is the deviation of the time taken to reach minimum regional volume for each segment. It is reproducible and has good interobserver and intra-observer correlation coefficients.72 There is an inverse relationship between SDI and 3DLVEF.73 Baseline SDI predicts acute hemodynamic response74 and long-term outcomes65,73,75 of CRT. Delgado et al76found that SDI was higher in dilated cardiomyopathy patients compared with healthy volunteers and after receiving CRT, the SDI presented an immediate and progressive decrease.
STE is a promising tool to assess mechanical dyssynchrony as it overcomes the intrinsic limits of standard techniques. A combined assessment of radial, circumferential, and longitudinal SDI can improve the prediction of responders.77 Radial dyssynchrony, assessed with 2D STE, was associated with significant ameliorations in clinical outcomes after CRT, independently of QRS duration or morphology.78
Newly developed 3D STE system quantifies endocardial area change ratio (area strain) and area strain dyssynchrony index (i.e., the average difference between peak and end-systolic area strain derived from 16 segments). GAS coupled with GLS and GCS are considered the best predictors of response to CRT;79 in particular, GAS is superior to other 3D strain measurements.80 Interestingly, some authors have suggested that 3D STE may be used to select HF patients with narrow QRS for CRT.81 It is also worthy to note that LV dyssynchrony has been often detected in hypertensive patients with normal LV systolic function, with or without LV hypertrophy and with no evidence of HF.82,83 In patients with LV hypertrophy, dyssynchrony might be a mechanism involved in the progressive worsening of clinical status, toward systolic heart failure.84,85 In this clinical setting, LV dyssynchrony assessed by 3D imaging may have an additional role.86
Valve heart disease
The use of RT3D-STE has been expanded to anatomical and functional assessment of cardiac structures. We will focus our attention on aortic and mitral valves and their disorders.
Aortic valve
In patients with aortic valve stenosis, progressive LV hypertrophy is a response to pressure overload and may be due to interstitial myocardial fibrosis starting at the subendocardial layers and progressing toward replacement fibrosis.87 Subendocardial fibers are more vulnerable to increased wall stress and decreased myocardial perfusion.88 Reduced LVEF in these patients may be due to either afterload mismatch or reduced myocardial perfusion and increased myocardial oxygen consumption, which lead to impairment of myocardial contractility.88
Strain imaging has demonstrated to be the most sensitive and appropriate method to evaluate LV myocardial deformation89 and accordingly enables a better characterization of subtle changes in LV performance in aortic stenosis patients.90,91 Strains measured by RT3D-STE have shown to be useful indices of early-stage LV dysfunction caused by aortic valve disease. Longitudinal strain is more vulnerable to pressure overload caused by aortic stenosis, whereas circumferential strain is more sensitive to volume overload due to aortic regurgitation.92
The usefulness of RT3D-STE has been proven in the assessment of the effects on LV function after either transcatheter aortic valve implantation for aortic stenosis or surgical valve replacement for aortic stenosis or regurgitation.93,94 Also, this technique has been proven to have an incremental value in patients with optimal aortic coarctation repair. The authors suggest that decreased GAS found in this population, as index of subtle subendocardial microvascular damage, might be an early indicator of late cardiovascular complications, highlighting RT3D-STE potential in risk stratification.95
Mitral valve
The mitral valve is crucial in LV and left atrial function; therefore, the assessment of its physiology is necessary in mitral valve disease diagnosis and treatment. RT3D echo allows a precise and accurate evaluation of both mitral annulus size and function not only in normal subjects but also in patients affected by cardiomyopathies in which anatomic alterations of mitral valve apparatus are expected, such as dilated cardiomyopathy and hypertrophic cardiomyopathy.96 Studying mitral valve function expands the knowledge of the underlying pathophysiology of the mitral regurgitation in different cardiomyopathies and affects therapeutic decision making, as its accurate assessment is crucial either for selection of patient in which invasive valve correction procedures are indicated or for latter (subsequent) LV function evaluation. In this context, RT3D-STE showed lower post-procedural LV strain values in patients with worse preexisting right ventricular function as well as LV and right ventricular strain improvement after MitraClip implantation.97,98
These findings suggest a potential prognostic role of RT3D-STE that may help in guiding treatment strategies on the basis of marked LV or RV impairment.
Athlete’s heart
RT3D-STE analysis allows a deeper physiological understanding of LV contraction mechanics in different types of athletes and is thus a feasible and helpful echocardiographic technique for the assessment of sport-specific pattern of ventricular morphological and functional remodeling.99 Determinants of LV performance and myocardial deformation properties in the athlete’s heart have been investigated using RT3D-STE. By using 3D STE, GLS and GCS did not differ among sedentary controls and athletes with tricuspid or bicuspid aortic valve.100 In strength athletes, GLS, GCS, GAS, and GRS were lower than in sedentary normal volunteers,99 whereas competitive endurance athletes showed higher GLS, GAS, and GCS in comparison with sedentary controls. Conversely, GRS did not differ significantly between endurance athletes and controls, it appears therefore not involved in the supernormal myocardial function process at rest.101
Cardiotoxicity
Studies of early myocardial changes induced by chemotherapy have demonstrated that alterations of myocardial deformation precede significant changes in LVEF. Using 2D STE, GLS appears to be the most useful parameter for the prediction of cardiotoxicity, most commonly defined as a >5% reduction in symptomatic patients (or >10% reduction in asymptomatic patients) in LVEF from baseline to an LVEF >55%.102 Subclinical LV dysfunction is defined as a >15% reduction in GLS during treatment, as compared to baseline.103 In late cancer survivors, measures of GRS and GCS are consistently abnormal, even in the context of normal LVEF. Thus, 2D global radial strain is a reliable and sensitive tool for the early myocardial damage in this clinical setting.104 Recently, 3D strain echocardiography has been developed as a way to further increase the sensitivity for early detection of chemotherapy-induced cardiotoxicity. In breast cancer patients undergoing anthracycline-based chemotherapy, 3D-derived GLS and GCS were found to be all strongly correlated with 3D LVEF. However, LV torsion was only weakly correlated to LVEF, suggesting that LVEF is determined less by torsion than by 3D strain. With a further study, 3D strain appears to play an important role in chemotherapy cardiotoxicity risk prediction.105 In patients receiving anthracycline chemotherapy, reduced GAS was found even in patients with preserved LVEF, showing this may be a sensitive marker to detect early LV systolic dysfunction.106
Cardiomyopathies
RT3D-STE has been poorly investigated in the setting of patients with cardiomyopathies. Structural and electrical cardiac abnormalities are prevalent in asymptomatic adults with myotonic dystrophy 1 (MD1).107 However, little is known about structural cardiac abnormalities, particularly in asymptomatic patients with MD. Cardiac involvement in MD2 patients compared to MD1 patients is less frequent and severe. Careful cardiac evaluation is recommended in this patient population to identify patients at risk for potential major cardiac arrhythmias.108 Myocardial deformation in patients with MD1 has been assessed with 2D STE, showing reduced GLS.109,110 RT3D-STE has demonstrated an impairment that involved GCS and GAS components, with relatively preserved GLS, in dystrophia myotonica type 1 (DM1) patients with preserved LVEF.111 These data indirectly prove that, even in the early stages of the disease, DM1 might induce a loss of myocardial fibers mostly involving the mid-wall myocardium layer, which is detectable by 3D STE, but not by 2D STE. In one single study, 3D speckle tracking echocardiographic parameters enabled differentiation of cardiac amyloidosis and hypertrophic cardiomyopathy by a disease-specific pattern. Comparing cardiac amyloidosis and hypertrophic cardiomyopathy, basal GRS was reduced in patients with amyloidosis; furthermore the “physiological” basal–apical RS gradient had oppositional tendencies in cardiac amyloidosis and hypertrophic cardiomyopathy, suggesting a “function-pattern-based” differentiation of these two pathologies.112
Implications and future directions
Perceiving the drawbacks of nonquantitative measurements such as eyeballing evaluation of LVEF and regional myocardial function, an integrative approach with 2D and 3D echocardiography is auspicable for an objective quantification of LV volumes and functions as well as a complete standardization of LV function assessment. In recent years, RT3D-STE is proving its additional value over 2D STE in a wide spectrum of clinical applications. Nonetheless, as with any developing technology, the interest must be supported by a critical evidence-based evaluation. The evaluation of the particular capabilities provided by a novel technique should be coupled with the recognition of its limitations. Some of the main limitations of the RT3D-STE method are its lower spatial resolution compared to 2DE and the need of a single-beat acquisistion in presence of arrythmias. One of the main limitations of the RT3D-STE method is its lower spatial resolution compared to 2D echocardiography. Also, in the presence of arrhythmias multi-beat acquisition is not feasible. Future advances in both spatial and temporal resolution will improve performance and further widen RT3D echocardiography imaging clinical applications. To date, the positive results, however, are providing an insight on this technique’s potential. The definition of standardized processing and analyzing methods as well as appropriate utilization criteria should be based on current evidence. In relation with some preliminary experiences showing the importance of combining the 3D volumetric assessment of the right ventricle with 2D STE of the same chamber,113–115 novel RT3D-STE software of the right ventricle could also have successful applications in the clinical setting. Different studies of right ventricle 3D STE have highlighted the potential of incremental value of this technique, in particular in the clinical setting of pulmonary hypertension.115–117
Disclosure
The authors report no conflicts of interest in this work.
References
Dandel, M, Lehmkuhl H, Knosalla C, Suramelashvili N, Hetzer R. Strain and strain rate imaging by echocardiography – basic concepts and clinical applicability. Curr Cardiol Rev. 2009;5(2):133–148. | ||
Mor-Avi V, Sugeng L, Lang RM. Real-time 3-dimensional echocardiography: an integral component of the routine echocardiographic examination in adult patients? Circulation. 2009;119(2):314–329. | ||
Jacobs LD, Salgo IS, Goonewardena S, et al. Rapid online quantification of left ventricular volume from real-time three-dimensional echocardiographic data. Eur Heart J. 2006;27(4):460–468. | ||
Mor-Avi V, Lang RM, Badano LP, et al. Current and evolving echocardiographic techniques for the quantitative evaluation of cardiac mechanics: ASE/EAE consensus statement on methodology and indications endorsed by the Japanese Society of Echocardiography. Eur J Echocardiogr. 2011;12(3):167–205. | ||
Pérez De Isla L, Vivas D, Zamorano JL. Three-dimensional speckle tracking. Curr Cardiovasc Imaging Rep. 2008;1(1):25–29. | ||
Pérez De Isla L, Balcones DV, Fernandez-Golfin C, et al. Three-dimensional wall motion tracking: a new and faster tool for myocardial strain assessment: comparison with two-dimensional wall motion tracking. J Am Soc Echocardiogr. 2009;22(4):325–330. | ||
Maffessanti F, Nesser HJ, Weinert L, et al. Quantitative evaluation of regional left ventricular function using three-dimensional speckle tracking echocardiography in patients with and without heart disease. Am J Cardiol. 2009;104(12):1755–1762. | ||
Wu VC, Takeuchi M, Otani K, et al. Effect of through-plane and twisting motion on left ventricular strain calculation: direct comparison between two-dimensional and three-dimensional speckle-tracking echocardiography. J Am Soc Echocardiogr. 2013;26(11):1274–1281. | ||
Seo Y, Ishizu T, Aonuma K. Current status of 3-dimensional speckle tracking echocardiography: a review from our experiences. J Cardiovasc Ultrasound. 2014;22(2):49–57. | ||
Xu TY, Sun JP, Lee AP, et al. Three-dimensional speckle strain echocardiography is more accurate and efficient than 2D strain in the evaluation of left ventricular function. Int J Cardiol. 2014;176(2):360–366. | ||
Jasaityte R, Heyde B, D’hooge J. Current state of three-dimensional myocardial strain estimation using echocardiography. J Am Soc Echocardiogr. 2013;26(1):15–28. | ||
Saito K, Okura H, Watanabe N, et al. Comprehensive evaluation of left ventricular strain using speckle tracking echocardiography in normal adults: comparison of three-dimensional and two-dimensional approaches. J Am Soc Echocardiogr. 2009;22(9):1025–1030. | ||
Kleijn SA, Aly MF, Terwee CB, van Rossum AC, Kamp O. Reliability of left ventricular volumes and function measurements using three-dimensional speckle tracking echocardiography. Eur Heart J Cardiovasc Imaging. 2012;13(2):159–168. | ||
Jasaityte R, Heyde B, Ferferieva V, et al. Comparison of a new methodology for the assessment of 3D myocardial strain from volumetric ultrasound with 2D speckle tracking. Int J Cardiovasc Imaging. 2012;28(5):1049–1060. | ||
Reant P, Barbot L, Touche C, et al. Evaluation of global left ventricular systolic function using three-dimensional echocardiography speckle-tracking strain parameters. J Am Soc Echocardiogr. 2012;25(1):68–79. | ||
Nesser HJ, Mor-Avi V, Gorissen W, et al. Quantification of left ventricular volumes using three-dimensional echocardiographic speckle tracking: comparison with MRI. Eur Heart J. 2009;30(13):1565–1573. | ||
Kaku K, Takeuchi M, Tsang W, et al. Age-related normal range of left ventricular strain and torsion using three-dimensional speckle-tracking echocardiography. J Am Soc Echocardiogr. 2014;27(1):55–64. | ||
Kleijn SA, Brouwer WP, Aly MF, et al. Comparison between three-dimensional speckle-tracking echocardiography and cardiac magnetic resonance imaging for quantification of left ventricular volumes and function. Eur Heart J Cardiovasc Imaging. 2012;13(10):834–839. | ||
Kawamura R, Seo Y, Ishizu T, et al. Feasibility of left ventricular volume measurements by three-dimensional speckle tracking echocardiography depends on image quality and degree of left ventricular enlargement: validation study with cardiac magnetic resonance imaging. J Cardiol. 2014;63(3):230–238. | ||
Kleijn SA, Pandian NG, Thomas JD, et al. Normal reference values of left ventricular strain using three-dimensional speckle tracking echocardiography: results from a multicentre study. Eur Heart J Cardiovasc Imaging. 2015;16(4):410–416. | ||
Muraru D, Cucchini U, Miha˘ila˘ S, et al. Left ventricular myocardial strain by three-dimensional speckle-tracking echocardiography in healthy subjects: reference values and analysis of their physiologic and technical determinants. J Am Soc Echocardiogr. 2014;27(8):858–871. | ||
Tadic M, Ilic S, Cuspidi C, et al. Left ventricular mechanics in untreated normotensive patients with type 2 diabetes mellitus: a two- and three-dimensional Speckle Tracking study. Echocardiography. 2015;32(6):947–955. | ||
Hoit BD. Strain and strain rate echocardiography and coronary artery disease. Circ Cardiovasc Imaging. 2011;4(2):179–190. | ||
Stanton T, Leano R, Marwick TH. Prediction of all-cause mortality from global longitudinal speckle strain: comparison with ejection fraction and wall motion scoring. Circ Cardiovasc Imaging. 2009;2:356–364. | ||
Urbano-Moral JA, Patel AR, Maron MS, Arias-Godinez JA, Pandian NG. Three-dimensional speckle-tracking echocardiography: methodological aspects and clinical potential. Echocardiography. 2012;29: 997–1010. | ||
Altman M, Bergerot C, Aussoleil A, et al. Assessment of left ventricular systolic function by deformation imaging derived from speckle tracking: a comparison between 2D and 3D echo modalities. Eur Heart J Cardiovasc Imaging. 2014;15(3):316–323. | ||
Weidemann F, Wacker C, Rauch A, et al. Sequential changes of myocardial function during acute myocardial infarction, in the early and chronic phase after coronary intervention described by ultrasonic strain rate imaging. J Am Soc Echocardiogr. 2006;19(7):839–847. | ||
Hanekom L, Jenkins C, Jeffries L, et al. Incremental value of strain rate analysis as an adjunct to wall-motion scoring for assessment of myocardial viability by dobutamine echocardiography: a follow-up study after revascularization. Circulation. 2005;112(25):3892–3900. | ||
Kleijn SA, Aly MF, Terwee CB, van Rossum AC, Kamp O. Three-dimensional speckle tracking echocardiography for automatic assessment of global and regional left ventricular function based on area strain. J Am Soc Echocardiogr. 2011;24(3):314–321. | ||
Wang Q, Zhang C, Huang D, et al. Evaluation of myocardial infarction size with three-dimensional speckle tracking echocardiography: a comparison with single photon emission computed tomography. Int J Cardiovasc Imaging. 2015;31(8):1571–1581. | ||
Hayat D, Kloeckner M, Nahum J, et al. Comparison of real-time three-dimensional speckle tracking to magnetic resonance imaging in patients with coronary heart disease. Am J Cardiol. 2012;109(2):180–186. | ||
Huttin O, Zhang L, Lemarié J, et al. Global and regional myocardial deformation mechanics of microvascular obstruction in acute myocardial infarction: a three dimensional speckle-tracking imaging study. Int J Cardiovasc Imaging. 2015;31(7):1337–1346. | ||
Zhu W, Liu W, Tong Y, Xiao J. Three-dimensional speckle tracking echocardiography for the evaluation of the infarct size and segmental transmural Involvement in patients with acute myocardial infarction. Echocardiography. 2014;31(1):58–66. | ||
Chan J, Hanekom L, Wong C, Leano R, Cho GY, Marwick TH. Differentiation of subendocardial and transmural infarction using two-dimensional strain rate imaging to assess short-axis and long-axis myocardial function. J Am Coll Cardiol. 2006;48(10):2026–2033. | ||
Ran H, Zhang PY, Zhang YX, et al. Assessment of left ventricular myocardial viability by 3-dimensional speckle-tracking echocardiography in patients with myocardial infarction. J Ultrasound Med. 2016;35(8):1631–1638. | ||
Ternacle J, Gallet R, Champagne S, et al. Changes in three-dimensional speckle-tracking-derived myocardial strain during percutaneous coronary intervention. J Am Soc Echocardiogr. 2013;26(12):1444–1449. | ||
Abate E, Hoogslag GE, Antoni ML, et al.Value of three-dimensional speckle-tracking longitudinal strain for predicting improvement of left ventricular function after acute myocardial infarction. Am J Cardiol. 2012;110(7):961–967. | ||
Wang D, Sun JP, Lee AP, et al. Evaluation of left ventricular function by three-dimensional speckle-tracking echocardiography in patients with myocardial bridging of the left anterior descending coronary artery. J Am Soc Echocardiogr. 2015;28(6):674–682. | ||
Nemes A, Szántó G, Kalapos A, Domsik P, Forster T. Reversal of left ventricular “rigid body rotation” during dipyridamole-induced stress in a patient with stable angina: a case from the three-dimensional speckle tracking echocardiographic MAGYAR-Stress Study. Quant Imaging Med Surg. 2016;6(3):308–311. | ||
Liu J, Xu Y, Wang J, et al. Diagnostic value of quantitative low-dose dobutamine stress echocardiography with three-dimensional speckle-tracking for non-ST-elevation acute coronary syndrome. Nan Fang Yi Ke Da Xue Xue Bao. 2015;35(7):947–953. | ||
Levy D, Garrison RJ, Savage DD, Kannel WB, Castelli WP. Prognostic implications of echocardiographically determined left ventricular mass in the Framingham Heart Study. N Engl J Med. 1990;322(22):1561–1566. | ||
Lang RM, Bierig M, Devereux RB, et al; Chamber Quantification Writing Group; American Society of Echocardiography’s Nomenclature and Standards Committee; European Association of Echocardiography. Recommendations for chamber quantification: a report from the American Society of Echocardiography’s Guidelines and Standard Committee and the Chamber Quantification Writing Group, developed in conjunction with the European Association of Echocardiography. Eur J Echocardiogr. 2006;7(2):79–108. | ||
Kouzu H, Yuda S, Muranaka A, et al. Left ventricular hypertrophy causes different changes in longitudinal, radial and circumferential mechanics in patients with hypertension: a two-dimensional speckle tracking study. J Am Soc Echocardiogr. 2011;24(2):192–199. | ||
Galderisi M, Lomoriello VS, Santoro A, et al. Differences of myocardial systolic deformation and correlates of diastolic function in competitive rowers and young hypertensives: a speckle-tracking echocardiography study. J Am Soc Echocardiogr. 2010;23(11):1190–1198. | ||
Jenkins C, Bricknell K, Hanekom L, Marwick TH. Reproducibility and accuracy of echocardiographic measurements of left ventricular parameters using real-time three-dimensional echocardiography. J Am Coll Cardiol. 2004;44(4):878–886. | ||
Bicudo LS, Tsutsui JM, Shiozaki A, et al. Value of real-time three-dimensional echocardiography in patients with hypertrophic cardiomyopathy: comparison with two-dimensional echocardiography and magnetic resonance imaging. Echocardiography. 2008;25(7):717–726. | ||
Yap SC, van Geuns RJ, Nemes A, et al. Rapid and accurate measurement of LV mass by biplane real-time 3D echocardiography in patients with concentric LV hypertrophy: comparison to CMR. Eur J Echocardiogr. 2008;9(2):255–260. | ||
Caiani EG, Corsi C, Sugeng L, et al. Improved quantification of left ventricular mass based on endocardial and epicardial surface detection with real time three dimensional echocardiography. Heart. 2006;92(2):213–219. | ||
Luis SA, Yamada A, Khandheria BK, et al. Use of three-dimensionals peckle-tracking echocardiography for quantitative assessment of global left ventricular function: a comparative study to three-dimensional echocardiography. J Am Soc Echocardiogr. 2014;27(3):285–291. | ||
Galderisi M, Esposito R, Schiano-Lomoriello V, et al. Correlates of global area strain in native hypertensive patients: a three-dimensional speckle-tracking echocardiography study. Eur Heart J Cardiovasc Imaging. 2012;13(9):730–738. | ||
Celic V, Tadic M, Suzic-Lazic J, et al. Two- and three-dimensional speckle tracking analysis of the relation between myocardial deformation and functional capacity in patients with systemic hypertension. Am J Cardiol. 2014;113(5):832–839. | ||
Saeki M, Sato N, Kawasaki M, et al. Left ventricular layer function in hypertension assessed by myocardial strain rate using novel one-beat real-time three-dimensional speckle tracking echocardiography with high volume rates. Hypertens Res. 2015;38(8):551–559. | ||
Wang Q, Gao Y, Tan K, Xia H, Li P. Assessment of left ventricular function by three-dimensional speckle-tracking echocardiography in well-treated type 2 diabetes patients with or without hypertension. J Clin Ultrasound. 2015;43(8):502–511. | ||
Hunt SA, Abraham WT, Chin MH, et al; American College of Cardiology Foundation; American Heart Association. 2009 Focused update incorporated into the ACC/AHA 2005 guidelines for the diagnosis and management of heart failure in adults a report of the American College of Cardiology Foundation/American Heart Association Task Force on practice guidelines developed in collaboration with the International society for heart and lung transplantation. J Am Coll Cardiol. 2009;53(15):e1–e90. | ||
Yip GW, Zhang Q, Xie JM, et al. Resting global and regional left ventricular contractility in patients with heart failure and normal ejection fraction: insights from speckle-tracking echocardiography. Heart. 2011;97(4):287–294. | ||
Wen HL, Liang Z, Zhao Y, Yang K. Feasibility of detecting early left ventricular systolic dysfunction using global area strain: a novel index derived from three-dimensional speckle-tracking echocardiography. Eur J Echocardiogr.2011;12(12):910–916. | ||
Ma C, Chen J, Yang J, et al. Quantitative assessment of left ventricular function by 3-dimensional speckle-tracking echocardiography in patients with chronic heart failure: a meta-analysis. J Ultrasound Med. 2014;33(2):287–295. | ||
Tatsumi K, Tanaka H, Matsumoto K, et al. Global endocardial area change rate for the assessment of left ventricular relaxation and filling pressure: using 3-dimensional speckle-tracking study. Int J Cardiovasc Imaging. 2014;30(8):1473–1481. | ||
Du GQ, Hsiung MC, Wu Y, et al. Three-dimensional speckle-tracking echocardiographic monitoring of acute rejection in heart transplant recipients. J Ultrasound Med. 2016;35(6):1167–1676. | ||
Urbano-Moral JA, Arias-Godinez JA, Ahmad R, et al. Evaluation of myocardial mechanics with three-dimensional speckle tracking echocardiography in heart transplant recipients: comparison with two-dimensional speckle tracking and relationship with clinical variables. Eur Heart J Cardiovasc Imaging. 2013;14(2):1167–1673. | ||
Matsumoto K, Tanaka H, Kaneko A, et al. Contractile reserve assessed by three-dimensional global circumferential strain as a predictor of cardiovascular events in patients with idiopathic dilated cardiomyopathy. J Am Soc Echocardiogr. 2012;25(12):1299–1308. | ||
Tracy CM, Epstein AE, Darbar D, et al. ACCF/AHA/HRS focused update of the 2008 guidelines for device-based therapy of cardiac rhythm abnormalities: a report of the American College of Cardiology Foundation/AmericanHeart Association Task Force on Practice Guidelines. J Am Coll Cardiol. 2012;60(14):1297–1313. | ||
Abraham WT, Fisher WG, Smith AL, et al. Cardiac resynchronization in chronic heart failure. N Engl J Med. 2002;346(24):1845–1853. | ||
Cleland JG, Daubert JC, Erdmann E, et al. The effect of cardiac resynchronization on morbidity and mortality in heart failure. N Engl J Med. 2005;352(15):1539–1549. | ||
Padeletti L, Paoletti Perini A, Gronda E. Cardiac resynchronization therapy: the issue of non-response. Heart Fail Rev. 2012;17(1):97–105. | ||
Bank AJ, Gage RM, Marek JJ, et al. Mechanical dyssynchrony is additive to ECG criteria and independently associated with reverse remodelling and clinical response to cardiac resynchronisation therapy in patients with advanced heart failure. Open Heart. 2015;2(1):e000246. | ||
Chung ES, Leon AR, Tavazzi L, et al. Results of the Predictors of Response to CRT (PROSPECT) trial. Circulation. 2008;117(20):2608–2616. | ||
Cai Q, Ahmad M. Left ventricular dyssynchrony by three-dimensional echocardiography: current understanding and potential future clinical applications. Echocardiography. 2015;32(8):1299–1306. | ||
Kleijn SA, Aly MF, Knol DL, et al. A meta-analysis of left ventricular dyssynchrony assessment and prediction of response to cardiac resynchronization therapy by three-dimensional echocardiography. Eur Heart J Cardiovasc Imaging. 2012;13(9):763–775. | ||
Helm RH, Byrne M, Helm PA, et al. Three-dimensional mapping of optimal left ventricular pacing site for cardiac resynchronization. Circulation. 2007;115(8):953–961. | ||
Samir R, Tawfik M, El Missiri AM, El Shahid G, Maaty MA, El Sayed M. Assessment of left ventricular mechanical dyssynchrony using real time three-dimensional echocardiography: a comparative study to Doppler tissue imaging. Echocardiography. 2012;29(2):173–181. | ||
Russo C, Jaubert MP, Jin Z, Homma S, Di Tullio MR. Intra- and interobserver reproducibility of left ventricular mechanical dyssynchrony assessment by real time three-dimensional echocardiography. Echocardiography. 2012;29(5):598–607. | ||
Tani T, Sumida T, Tanabe K, et al. Left ventricular systolic dyssynchrony index by three-dimensional echocardiography in patients with decreased left ventricular function: comparison with tissue Doppler echocardiography. Echocardiography. 2012;29(3):346–352. | ||
Marsan NA, Bleeker GB, Ypenburg C, et al. Real-time three-dimensional echocardiography permits quantification of left ventricular mechanical dyssynchrony and predicts acute response to cardiac resynchronization therapy. J Cardiovasc Electrophysiol. 2008;19(4):392–399. | ||
Kapetanakis S, Kearney MT, Siva A, Gall N, Cooklin M, Monaghan MJ. Real-time three-dimensional echocardiography: a novel technique to quantify global left ventricular mechanical dyssynchrony. Circulation. 2005;112(7):992–1000. | ||
Delgado V, Sitges M, Vidal B, et al. Assessment of left ventricular dyssynchrony by real-time three-dimensional echocardiography. Rev Esp Cardiol. 2008;61(8):825–834. | ||
Tatsumi K, Tanaka H, Yamawaki K, et al. Utility of comprehensive assessment of strain dyssynchrony index by speckle tracking imaging for predicting response to cardiac resynchronization therapy. Am J Cardiol. 2011;107(3):439–446. | ||
Delgado V, Ypenburg C, van Bommel RJ, et al. Assessment of left ventricular dyssynchrony by speckle tracking strain imaging comparison between longitudinal, circumferential, and radial strain in cardiac resynchronization therapy. J Am Coll Cardiol. 2008;51(20):1944–1952. | ||
Tatsumi K, Tanaka H, Tsuji T, et al. Strain dyssynchrony index determined by three-dimensional speckle area tracking can predict response to cardiac resynchronization therapy. Cardiovasc Ultrasound. 2011;9:11. | ||
Thebault C, Donal E, Bernard A, et al. Real-time three-dimensional speckle tracking echocardiography: a novel technique to quantify global left ventricular mechanical dyssynchrony. Eur J Echocardiogr. 2011;12(1):26–32. | ||
Tatsumi K, Tanaka H, Matsumoto K, et al. Mechanical left ventricular dyssynchrony in heart failure patients with narrow QRS duration as assessed by three-dimensional speckle area tracking strain. Am J Cardiol. 2011;108(6):867–872 | ||
Kwon BJ, Choi KY, Kim DB, et al. Systolic synchrony is impaired in non left ventricular hypertrophy of never-treated hypertensive patients. J Hypertens. 2011;29(11):2246–2254. | ||
Tan HW, Zheng GL, Li L, et al. Impaired left ventricular synchronicity in hypertensive patients with ventricular hypertrophy. J Hypertens. 2008;26(3):553–559. | ||
Wang J, Kurrelmeyer KM, Torre-Amione G, Nagueh SF. Systolic and diastolic dyssynchrony in patients with diastolic heart failure and the effect of medical therapy. J Am Coll Cardiol. 2007;49(1):88–96. | ||
Yang B, Chettiveettil D, Jones F, Aguero M, Lewis JF. Left ventricular dyssynchrony in hypertensive patients without congestive heart failure. Clin Cardiol. 2008;31(12):597–601. | ||
Kobayashi D, Patel SR, Mattoo TK, Valentini RP, Aggarwal S. The impact of change in volume and left-ventricular hypertrophy on left-ventricular mechanical dyssynchrony in children with end-stage renal disease. Pediatr Cardiol. 2012;33(7):1124–1130. | ||
Hein S, Arnon E, Kostin S, et al. Progression from compensated hypertrophy to failure in the pressure-overloaded human heart: structural deterioration and compensatory mechanisms. Circulation. 2003;107(7):984–991. | ||
Weidemann F, Herrmann S, Stork S, et al. Impact of myocardial fibrosis in patients with symptomatic severe aortic stenosis. Circulation. 2009;120(7):577–584. | ||
Edvardsen T, Helle-Valle T, Smiseth OA. Systolic dysfunction in heart failure with normal ejection fraction: speckle-tracking echocardiography. Prog Cardiovasc Dis. 2006;49(3):207–214. | ||
Ng, AC, Delgado V, Bertini M, et al. Alterations in multidirectional myocardial functions in patients with aortic stenosis and preserved ejection fraction: a two-dimensional speckle tracking analysis. Eur Heart J. 2011;32(12):1542–1550. | ||
Delgado V, Tops LF, van Bommel RJ, et al. Strain analysis in patients with severe aortic stenosis and preserved left ventricular ejection fraction undergoing surgical valve replacement. Eur Heart J. 2009;30(24):3037–3047. | ||
Li CM, Li C, Bai WJ, et al. Value of three-dimensional speckle-tracking in detecting left ventricular dysfunction in patients with aortic valvular diseases. J Am Soc Echocardiogr. 2013;26(11):1245–1252. | ||
Schueler R, Sinning JM, Momcilovic D, et al. Three-dimensional speckle-tracking analysis of left ventricular function after transcatheter aortic valve implantation. J Am Soc Echocardiogr. 2012;25(8):827–834. | ||
Chen Y, Zhang Z, Cheng L, Fan L, Wang C, Shu X. The early variation of left ventricular strain after aortic valve replacement by three-dimensional echocardiography. PLoS One. 2015;10(10):e0140469. | ||
Kowalik E, Kowalski M, Klisiewicz A, Hoffman P. Global area strain is a sensitive marker of subendocardial damage in adults after optimal repair of aortic coarctation: three-dimensional speckle-tracking echocardiography data. Heart Vessels. Epub 2016 Feb 3. | ||
Anwar AM, Soliman OI, Nemes A, et al. Assessment of mitral annulus size and function by real-time 3-dimensional echocardiography in cardiomyopathy: comparison with magnetic resonance imaging. J Am Soc Echocardiogr. 2007;20(8):941–948. | ||
Vitarelli A, Mangieri E, Capotosto L, et al. Assessment of biventricular function by three-dimensional speckle-tracking echocardiography in secondary mitral regurgitation after repair with the MitraClip system. J Am Soc Echocardiogr. 2015;28(9):1070–1082. | ||
Scandura S, Dipasqua F, Gargiulo G, et al. Early results of MitraClip system implantation by real-time three-dimensional speckle-tracking left ventricle analysis. J Cardiovasc Med (Hagerstown). Epub 2015 Aug 7. | ||
Monte IP, Mangiafico S, Buccheri S, et al. Myocardial deformational adaptations to different forms of training: a real-time three-dimensional speckle tracking echocardiographic study. Heart Vessels. 2015;30(3):386–395. | ||
Stefani L, De Luca A, Toncelli L, Pedrizzetti G, Galanti G. 3D strain helps relating LV function to LV and structure in athletes. Cardiovasc Ultrasound. 2014;12:33. | ||
Lo Iudice F, Petitto M, Ferrone M, et al Determinants of myocardial mechanics in top-level endurance athletes: three-dimensional speckle tracking evaluation. Eur Heart J Cardiovasc Imaging. Epub 2016 Jun 19. | ||
Seidman A, Hudis C, Pierri MK, et al. Cardiac dysfunction in the trastuzumab clinical trials experience. J Clin Oncol. 2002;20(5):1215–1221. | ||
Plana JC, Galderisi M, Barac A, et al. Expert consensus for multimodality imaging evaluation of adult patients during and after cancer therapy: a report from the American Society of Echocardiography and the European Association of Cardiovascular Imaging. J Am Soc Echocardiogr. 2014;27(9):911–939. | ||
Tarr A, Stoebe S, Tuennemann J, et al. Early detection of cardiotoxicity by 2D and 3D deformation imaging in patients receiving chemotherapy. Echo Res Pract. 2015;2(3):81–88. | ||
Gulati G, French B, Zhang KW, et al. Three dimensional ejection fraction is more strongly determined by strain than by torsion in a cohort of breast cancer patients undergoing anthracycline-based chemotherapy. Circulation. 2015;132(3):A14645. | ||
Miyoshi T, Tanaka H, Kaneko A, et al. Left ventricular endocardial dysfunction in patients with preserved ejection fraction after receiving anthracycline. Echocardiography. 2014;31(7):848–857. | ||
Choudhary P, Nandakumar R, Greig H, et al. Structural and electrical cardiac abnormalities are prevalent in asymptomatic adults with myotonic dystrophy. Heart. Epub 2016 May 10. | ||
Sansone VA, Brigonzi E, Schoser B, et al. The frequency and severity of cardiac involvement in myotonic dystrophy type 2 (DM2): long-term outcomes. Int J Cardiol. 2013;168(2):1147–1453. | ||
Wahbi K, Ederhy S, Bécane HM, et al. Impaired myocardial deformation detected by speckle-tracking echocardiography in patients with myotonic dystrophy type 1. Int J Cardiol. 2011;152(3):375–376. | ||
Petri H, Witting N, Ersboll MK, et al. High prevalence of cardiac involvement in patients with myotonic dystrophy type 1: a cross-sectional study. Int J Cardiol. 2014;174(1):31–36. | ||
Galderisi M, De Stefano F, Santoro C, et al. Early changes of myocardial deformation properties in patients with dystrophia myotonica type 1: a three-dimensional speckle tracking echocardiographic study. Int J Cardiol. 2014;176(3):1094–1096. | ||
Baccouche H, Maunz M, Beck T, et al. Differentiating cardiac amyloidosis and hypertrophic cardiomyopathy by use of three-dimensional speckle tracking echocardiography. Echocardiography. 2012;29(6):668–677. | ||
Lu KJ, Chen JX, Profitis K, et al. Right ventricular global longitudinal strain is an independent predictor of right ventricular function: a multimodality study of cardiac magnetic resonance imaging, real time three-dimensional echocardiography and speckle tracking echocardiography. Echocardiography. 2015;32(6):966–974. | ||
Esposito R, Galderisi M, Schiano-Lomoriello V, et al. Non symmetric myocardial contribution to supranormal right ventricular function in the athlete’s heart: combined assessment by speckle tracking and real time three-dimensional echocardiography. Echocardiography. 2014;31(8):996–1004. | ||
Ozawa K, Funabashi N, Takaoka H, et al. Utility of three-dimensional global longitudinal strain of the right ventricle using transthoracic echocardiography for right ventricular systolic function in pulmonary hypertension. Int J Cardiol. 2014;174(2):426–430. | ||
Smith BC, Dobson G, Dawson D, Charalampopoulos A, Grapsa J, Nihoyannopoulos P. Three-dimensional speckle tracking of the right ventricle: toward optimalquantification of right ventricular dysfunction in pulmonary hypertension. J Am Coll Cardiol. 2014;64(1):41–51. | ||
Vitarelli A, Mangieri E, Terzano C, et al. Three-dimensional echocardiography and 2D-3D speckle-tracking imaging in chronic pulmonary hypertension: diagnostic accuracy in detecting hemodynamic signs of right ventricular (RV) failure. J Am Heart Assoc. 2015;4(3):e001584. |
 © 2016 The Author(s). This work is published and licensed by Dove Medical Press Limited. The
full terms of this license are available at https://www.dovepress.com/terms
and incorporate the Creative Commons Attribution
- Non Commercial (unported, 3.0) License.
By accessing the work you hereby accept the Terms. Non-commercial uses of the work are permitted
without any further permission from Dove Medical Press Limited, provided the work is properly
attributed. For permission for commercial use of this work, please see paragraphs 4.2 and 5 of our Terms.
© 2016 The Author(s). This work is published and licensed by Dove Medical Press Limited. The
full terms of this license are available at https://www.dovepress.com/terms
and incorporate the Creative Commons Attribution
- Non Commercial (unported, 3.0) License.
By accessing the work you hereby accept the Terms. Non-commercial uses of the work are permitted
without any further permission from Dove Medical Press Limited, provided the work is properly
attributed. For permission for commercial use of this work, please see paragraphs 4.2 and 5 of our Terms.