Back to Journals » International Journal of Nanomedicine » Volume 12
Quercetin-mediated synthesis of graphene oxide–silver nanoparticle nanocomposites: a suitable alternative nanotherapy for neuroblastoma
Authors Yuan YG, Wang YH, Xing HH, Gurunathan S ![]()
Received 27 April 2017
Accepted for publication 30 June 2017
Published 16 August 2017 Volume 2017:12 Pages 5819—5839
DOI https://doi.org/10.2147/IJN.S140605
Checked for plagiarism Yes
Review by Single anonymous peer review
Peer reviewer comments 3
Editor who approved publication: Dr Linlin Sun
Yu-Guo Yuan,1 Yan-Hong Wang,1 Hui-Hui Xing,1 Sangiliyandi Gurunathan2
1Jiangsu Co-Innovation Center for Prevention and Control of Important Animal Infectious Diseases and Zoonosis, College of Veterinary Medicine, Yangzhou University, Yangzhou, Jiangsu, People’s Republic of China; 2Department of Stem Cell and Regenerative Biotechnology, Konkuk University, Seoul, Republic of Korea
Background: Graphene and graphene-related materials have gained substantial interest from both academia and industry for the development of unique nanomaterials for biomedical applications. Graphene oxide (GO) and silver nanoparticles (AgNPs) are a valuable platform for the development of nanocomposites, permitting the combination of nanomaterials with different physical and chemical properties to generate novel materials with improved and effective functionalities in a single platform. Therefore, this study was conducted to synthesize a graphene oxide–silver nanoparticle (GO-AgNPs) nanocomposite using the biomolecule quercetin and evaluate the potential cytotoxicity and mechanism of GO-AgNPs in human neuroblastoma cancer cells (SH-SY5Y).
Methods: The synthesized GO-AgNPs were characterized using various analytical techniques. The potential toxicities of GO-AgNPs were evaluated using a series of biochemical and cellular assays. The expression of apoptotic and anti-apoptotic genes was measured by quantitative real-time reverse transcription polymerase chain reaction. Further, apoptosis was confirmed by caspase-9/3 activity and a terminal deoxynucleotidyl transferase dUTP nick end labeling assay, and GO-AgNPs-induced autophagy was also confirmed by transmission electron microscopy.
Results: The prepared GO-AgNPs exhibited significantly higher cytotoxicity toward SH-SY5Y cells than GO. GO-AgNPs induced significant cytotoxicity in SH-SY5Y cells by the loss of cell viability, inhibition of cell proliferation, increased leakage of lactate dehydrogenase, decreased level of mitochondrial membrane potential, reduced numbers of mitochondria, enhanced level of reactive oxygen species generation, increased expression of pro-apoptotic genes, and decreased expression of anti-apoptotic genes. GO-AgNPs induced caspase-9/3-dependent apoptosis via DNA fragmentation. Finally, GO-AgNPs induced accumulation of autophagosomes and autophagic vacuoles.
Conclusion: In this study, we developed an environmentally friendly, facile, dependable, and simple method for the synthesis of GO-AgNPs nanocomposites using quercetin. The synthesized GO-AgNPs exhibited enhanced cytotoxicity compared with that of GO at very low concentrations. This study not only elucidates the potential cytotoxicity against neuroblastoma cancer cells, but also reveals the molecular mechanism of toxicity.
Keywords: neuroblastoma, cell viability, cytotoxicity, graphene oxide–silver nanoparticles nanocomposite, apoptosis, autophagy
Introduction
Neuroblastoma is a childhood cancer, and it is the single most common tumor that occurs primarily in children younger than 5 years. It is also the most common extracranial solid tumor in children and accounts for 15% of pediatric cancer deaths.1 There are ~700 new cases of neuroblastoma each year in the United States.2,3 It is one of the most common and deadly tumors in children.2 Neuroblastoma accounts for 7%–10% of childhood cancers with an annual incidence of 8 per million children younger than 15 years.4–6 Human neuroblastoma SH-SY5Y cells seem to be one of the best in vitro model systems for neuronal studies due to their lack of contamination and capability of proliferating in culture for long periods, a prerequisite for the development of an in vitro cell model. The cells can also be maintained in an undifferentiated state.7–9 SH-SY5Y cells exhibit properties of stem cells and differentiate upon treatment with a variety of agents, including retinoic acid and silver nanoparticles (AgNPs).7,10,11 Consequently, the SH-SY5Y cell line has been widely used in analyses of neuronal differentiation, metabolism, neurodegenerative and neuro-adaptive processes, neurotoxicity, and neuroprotection.6,10,12 Therefore, the selection of classical cellular models is critical to dissect the functional aspects and molecular mechanisms of action of new molecules, potential toxins, or cytotoxic agents.13 Although highly advanced technologies are being developed for many types of cancers, including childhood oncological disorders, children with metastatic neuroblastoma have only a 5%–15% chance of long-term survival.14 Until now, this miserable long-term prognosis has not changed in the past 2 decades. Clearly, neuroblastoma is a tumor for which new treatment approaches are needed. Although a wide spectrum of toxicity studies have been performed in various cancer cell lines with anticancer drugs and different types of nanoparticles, so far no studies have reported the effects of graphene oxide–silver nanoparticles (GO-AgNPs) nanocomposites on human neuroblastoma cells.
Recently, nanotechnology has become an essential and important field tool to develop various kinds of nanoparticles with high surface area to volume ratios and unique properties.15 Among several nanoparticles, AgNPs are the most frequently used nanoparticles in a variety of biomedical applications, including diagnostics, drug delivery, biomarkers, and distinct antibacterial, antifungal, and anti-biofilm agents.16–18 In addition, AgNPs exhibited an anticancer property in various cancer cell lines, such as Dalton’s lymphoma ascites (DLA) cell lines,19 human lung cancer cells,17 human breast cancer cells,20 and human ovarian cancer cells,21 and an antiangiogenic property in endothelial cells.22,23 Similarly, graphene and graphene-related nanomaterials have attracted much interest due to their unique physical and chemical properties, such as their exceptionally large surface area, high electrical conductivity, good thermal stability, and excellent mechanical strength and elasticity,24 and they have been used as anticancer agents and in other biomedical applications, including bio-imaging, gene delivery, tissue engineering, and drug delivery.15 In the development of graphene-related materials for biomedical applications under in vivo conditions, cytotoxicity and biocompatibility studies are indispensable. Therefore, many studies have been dedicated to examining the effects of graphene, GO, and graphene-related nanomaterials in various cell culture systems. For instance, Mullick Chowdhury et al25 reported the toxicity of oxidized graphene nanoribbons in four different cell lines, including HeLa, MCF-7, SKBR3, and NIH3T3, using six different biochemical and cellular assays. The results indicated that the cytotoxicity differs in a dose- and time-dependent manner and also depends on cell type. Similarly, our studies have shown the toxicity of GO and biomolecule-functionalized reduced graphene in various types of cancer and non-cancer cells, including mouse embryonic fibroblast cells,26 human breast cancer cells,27 and human ovarian cancer cells.28 GO induced cytotoxicity in human neuroblastoma SH-SY5Y cells at higher concentrations of 80 μg/mL at 96 h in a dose- and time-dependent manner,29 and GO nanoribbons induced toxicity by generation of reactive oxygen species (ROS), impairment of mitochondrial membrane potential (MMP), and formation of autophagosomes (APs),30 which also depends on the size, charge, surface chemistry, and physical and chemical nature of the synthesized graphene.27,28,31,32 On the other hand, the biocompatibility was analyzed using a variety of chemically and biologically functionalized graphene in several cell lines. For example, GO composites containing Tween-20 and chemically reduced GO showed excellent stability in water and were non-toxic to three different mammalian cell lines, including Vero cells, embryonic bovine cells, and Crandell–Rees feline kidney cells.33 GO reduced with dextran showed significant biocompatibility with HeLa cells.34 Lee et al35 demonstrated that graphene- and GO-coated substrates accelerated mesenchymal stem cell (MSC) adhesion, proliferation, and differentiation. Biologically functionalized graphene showed excellent biocompatibility in various cell lines, such as mouse embryonic fibroblast cells,26 human breast cancer cells,31 and human embryonic kidney (HEK) 293 cells.36
Although both AgNPs and graphene are widely known for their outstanding antimicrobial and anticancer activity in a variety of bacteria and cell lines, respectively, the disadvantage of AgNPs is their strong tendency to aggregate in aqueous solutions and susceptibility to aggregation into large particles owing to their high surface energy, resulting in deterioration of their unique chemical properties and loss of their antibacterial activities.37 However, surfactants can maintain the colloidal stability of AgNPs and also hinder the particles’ surface oxidation.38 This leads to a reduced toxicity to bacterial cells that might be a result of the decreased rate of AgNPs+ ion release.38 Therefore, many researchers are interested in developing distinct and effective antimicrobial, anticancer, or cytotoxic molecules, and GO seems to be an attractive platform for building novel nanocomposites. GO sheets act as support layers to allow the combination of nanomaterials with different properties to produce novel materials with improved or new functionalities, such as increased stability. For example, attachment of AgNPs on the surface of GO sheets can prevent AgNPs from aggregating, allowing a more controlled release of AgNPs+ ions, which eventually can increase antibacterial and anticancer activity.21,37,39–42
Recent studies on basic and translational cancer have been focused on development of novel therapeutic agents targeting multidimensional aspects that contribute to the development and progression of cancers and the resistance of tumors to conventional therapies.43,44 Although several studies have addressed the molecular mechanism of cancer pathogenesis, the process of understanding remains extremely complex, and much is still unknown because of intrinsic resistance and loss of sensitivity to a therapeutic agent.45 Generally, neuroblastoma is sensitive to chemotherapy but eventually develops resistance to chemotherapy. Therefore, developing a novel nanoparticle-mediated therapy is essential and necessary. For instance, nanoparticle-mediated cancer therapy could target cancer stem cells, but it may be linked to treatment resistance of cancer stem cells.46 Considering the available literature, we designed our work with the following objectives. The first objective of this study was to synthesize and characterize the GO–silver nanocomposite using the biomolecule quercetin. The second objective was to evaluate the potential cytotoxicity of GO-AgNP nanocomposites in the human neuroblastoma (SH-SY5Y) cell line, which is commonly used in studies related to neurotoxicity, oxidative stress, and neurodegenerative diseases. The final objective of this study was to determine the mechanism of toxicity of GO-AgNP nanocomposites in the human neuroblastoma cancer cell line (SH-SY5Y).
Materials and methods
Materials
Penicillin–streptomycin solution, trypsin–ethylenediaminetetraacetic acid (EDTA) solution, Dulbecco’s Modified Eagle’s Medium (DMEM), and 1% antibiotic–antimycotic solution were obtained from Life Technologies (Thermo Fisher Scientific, Waltham, MA, USA). Fetal bovine serum (FBS), CCK-8, and an in vitro cell-counting assay kit were purchased from Dojindo (ck04; Rockville, MD, USA). Quercetin, AgNO3, FBS, and the in vitro toxicology assay kit were purchased from Sigma-Aldrich (St Louis, MO, USA). Graphite (Gt) powder, NaOH, KMnO4, NaNO3, anhydrous ethanol, 98% H2SO4, 36% HCl, 30% H2O2 aqueous solution, acetaminophen, and all other chemicals were purchased from Sigma-Aldrich unless otherwise stated.
Synthesis of GO
GO was synthesized as described previously with suitable modifications.26,28,31 In a typical synthesis process, 2 g natural Gt powder was added to 350 mL H2SO4 at 0°C; 8 g KMnO4 and 1 g NaNO3 were added gradually while stirring. The mixture was transferred to a 40°C water bath and stirred for 60 min. Deionized water (250 mL) was slowly added, and the temperature was increased to 98°C. The mixture was maintained at 98°C for 30 min; the reaction was terminated by the addition of 500 mL deionized water and 40 mL 30% H2O2 solution. The color of the mixture changed to brilliant yellow, indicating the oxidation of pristine Gt to Gt oxide. The mixture was filtered and washed with diluted HCl to remove metal ions. The product was washed repeatedly with distilled water until a pH of 7.0 was achieved; the synthesized Gt oxide was further sonicated for 120 min.
Synthesis and characterization of GO-AgNPs nanocomposite
Synthesis and characterization of the GO-AgNPs nanocomposite was followed as described previously.21,37 Synthesized GO-AgNPs nanocomposites were prepared using quercetin. Aqueous solutions of 100 mg GO and 1 mM AgNO3 were used as precursors for the GO-AgNPs nanocomposites. Initially, 100 mg GO was dispersed in 60 mL water by 60 min of sonication. The reaction mixture was prepared in a 250 mL round-bottom flask by dissolving 1 mM AgNO3 in 30 mL water. To this solution, 60 mL of the GO dispersion was added, followed by a quick addition of 10 mL of aqueous 1 mM quercetin. The mixture was stirred at 90°C for 12 h. After 12 h, the reaction was stopped, and the resultant mixture was washed three times with water using centrifugation. The product was obtained as a black powder and used for further experiments.
Cell culture and exposure of SH-SY5Y cells to GO-AgNPs nanocomposite
SH-SY5Y human neuroblastoma cells were obtained from the American Type Culture Collection and were maintained in DMEM supplemented with 2 mM glutamine, 10% FBS, and 1% antibiotic–antimycotic solution.7,8 Cells were grown to confluence at 37°C in a 5% CO2 atmosphere. All experiments were performed in 96-well plates and 100 mm cell culture dishes. The cells were prepared in 100 μL aliquots at a density of 1×10⁵ mL and plated in 96-well plates. After the cells were cultured for 24 h, the medium was replaced with a medium containing GO (0–50 μg/mL) or GO-AgNPs (0–10 μg/mL). After incubation for an additional 24 h, the cells were analyzed for viability. The cells that were not exposed to GO or GO-AgNPs served as controls.
Cell viability assay
The cell viability was measured with a CCK-8 cell-counting assay kit. Briefly, the SH-SY5Y cells were plated on to 96-well flat-bottom culture plates with various concentrations of GO or GO-AgNPs. All cultures were incubated for 24 h at 37°C in a humidified incubator. After 24 h of incubation (37°C and 5% CO2 in a humid atmosphere), 10 μL of CCK-8 reagent was added to each well, and then the plates were incubated for a further 1 h at 37°C. The resulting formazan absorbance was measured at 450 nm with an ELISA reader (Spectra MAX; Molecular Devices LLC, Sunnyvale, CA, USA). The results were expressed as the mean of three independent experiments. Concentrations of GO and GO-AgNPs that showed a 50% reduction in cell viability (ie, IC50 values) were then calculated.
Trypan blue exclusion assay
A trypan blue exclusion assay was performed according to the method described earlier.27 The SH-SY5Y cells were plated in 96-well plates. The cells were treated with various concentrations of GO (10–50 μg/mL) or GO-AgNPs (2–10 μg/mL) for 24 h. After treatment, cells attached to the 96-well plate were washed using phosphate-buffered saline (PBS, pH 7.4) once, trypsinized for 1 min in a 37°C incubator, and then neutralized with FBS-supplemented growth media. The cells were stained using 4% trypan blue to determine live cell numbers. The cell count was performed manually with a hemocytometer.
Membrane integrity
The membrane integrity of SH-SY5Y cells was evaluated according to the manufacturer’s instructions (LDH Cytotoxicity Detection Kit; Takara, Tokyo, Japan). Briefly, cells were exposed to IC50 concentrations of GO (25 μg/mL), GO-AgNPs (5 μg/mL), or doxorubicin (DOX) (1 μg/mL) for 24 h, and 100 μL per well of cell-free supernatant was transferred in triplicate into 96-well plates. Then, 100 μL of the LDH reaction mixture was added to each well. After 3 h incubation under standard conditions, the optical density of the color generated was determined at a wavelength of 490 nm using a microplate reader.
Assessment of dead-cell protease activity
A dead-cell protease activity assay was performed according to the method described earlier.47 The cytotoxicity assay was employed to evaluate the cytotoxicity effects of GO (25 μg/mL), GO-AgNPs (5 μg/mL), or DOX (1 μg/mL) for 24 h on SH-SY5Y cells. The cytotoxicity was determined by association of intracellular protease with a luminogenic peptide substrate (alanyl-alanylphenylalanyl-aminoluciferin). The degree of protease reaction can measure dead-cell protease activity. As a control, we treated cells with 1% Triton X-100 to exclude the background value of the medium color. Luminogenic peptide substrate (5 μL) was added to each well, and luminescence was measured to determine the number of dead cells. The peptide substrate was incubated for 15 min at 37°C. The luminescence was measured with a luminescence counter (PerkinElmer Inc., Waltham, MA, USA).
Analysis of mitochondrial dysfunction
The cells were exposed to GO (25 μg/mL), GO-AgNPs (5 μg/mL), or DOX (1 μg/mL) for 24 h, and then MMP was measured as described previously17,46 using the cationic fluorescent indicator JC-1 (Molecular Probes, Eugene, OR, USA). JC-1 is a lipophilic cation, which, in a reaction driven by ΔΨm in normal polarized mitochondria, assembles into a red fluorescence-emitting dimer, forming JC-1-AgNPs aggregates. Cells were incubated with 10 μM JC-1 at 37°C for 15 min, washed with PBS, resuspended in PBS, and then the fluorescence intensity was measured. MMP was expressed as the ratio of the fluorescence intensity of the JC-1 aggregates to that of the monomers.
A mitochondrial dysfunction analysis was also carried out by determining the mitochondria copy number using real-time polymerase chain reaction (PCR) amplification. The cells were treated with GO (25 μg/mL), GO-AgNPs (5 μg/mL), or DOX (1 μg/mL) for 24 h. To determine the copy number, the following primers were used: mitochondrial DNA (mtDNA) forward primer, CCTATCACCCTTGCCATCAT; mtDNA reverse primer, AGNPSGCTGTTGCTTGTGTGAC. To quantify the nuclear DNA, we used a primer set that detects the PECAM gene on chromosome 6 of nuclear DNA: forward primer, ATGGAAAGNPSCCTGCCATCATG; reverse primer, TCCTTGTTGTTCAGNPSCATCAC.48
Determination of ROS
ROS was estimated according to a method described previously.17 Intracellular ROS was measured based on the intracellular peroxide-dependent oxidation of 2′,7′-dichlorodihydrofluorescein diacetate (DCFH-DA; Molecular Probes) to form the fluorescent compound 2′,7′-dichlorofluorescein (DCF), as previously described. The cells were seeded on to 24-well plates at a density of 5×10⁴ cells per well and cultured for 24 h. After washing twice with PBS, fresh medium containing GO (25 μg/mL), GO-AgNPs (5 μg/mL), or DOX (1 μg/mL) was added and incubated for 24 h. The cells were then supplemented with 20 μM DCFH-DA, and the incubation continued for 30 min at 37°C. The cells were rinsed with PBS, and 2 mL of PBS was added to each well. The fluorescence intensity was determined using a spectrofluorometer (Gemini EM; Molecular Devices LLC) with excitation at 485 nm and emission at 530 nm.
Determination of malondialdehyde (MDA)
MDA was measured according to the method described earlier.49 The SH-SY5Y cells were seeded into 6-well microplates at 2.0×10⁶ cells per well. The cells were treated with GO (25 μg/mL), GO-AgNPs (5 μg/mL), or DOX (1 μg/mL) for 24 h. After incubation, the cells were harvested and washed twice with an ice-cold PBS solution. The cells were collected and disrupted by ultrasonication for 5 min on ice. The cell extract (100 μL) was used to detect MDA according to the procedure recommended by the manufacturer of the MDA assay kit. The concentration of MDA was measured on a microplate reader at a wavelength of 530 nm. The protein concentration was determined using the Bio-Rad protein assay kit (Bio-Rad Laboratories Inc., Hercules, CA, USA).
Quantitative reverse transcription polymerase chain reaction (qRT-PCR) assay
Total RNA was extracted from the cells treated with GO (25 μg/mL), GO-AgNPs (5 μg/mL), or DOX (1 μg/mL) for 24 h using the Arcturus PicoPure RNA isolation kit (Arcturus Bioscience, Mountain View, CA, USA), and then samples were prepared according to the manufacturer’s instructions. Real-time RT-PCR was conducted using a Vill7 (Thermo Fisher Scientific) and SYBR Green as the double-stranded DNA-specific fluorescent dye (Thermo Fisher Scientific). Target gene expression levels were normalized to GAPDH expression, which was unaffected by treatment. The RT-PCR primer sets are shown in Table 1. Real-time qRT-PCR was performed independently in triplicate for each of the different samples; the data are presented as the mean values of gene expression measured in treated samples versus control.
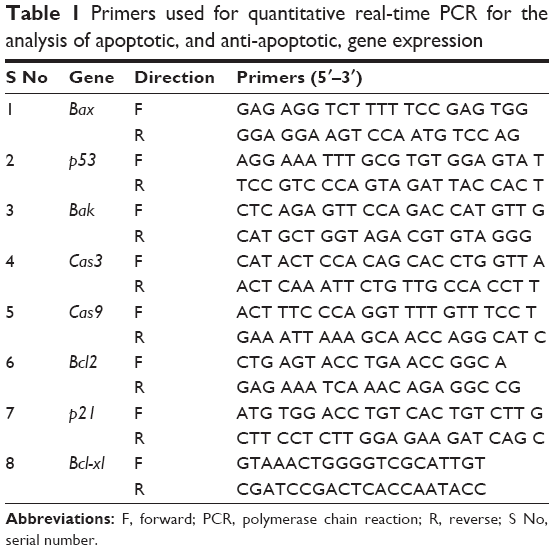 | Table 1 Primers used for quantitative real-time PCR for the analysis of apoptotic, and anti-apoptotic, gene expression |
Measurement of caspase-9/3 activity
The measurement of caspase-9/3 activity was performed according to the method described earlier.21 The samples were collected from the cells that were treated with GO (25 μg/mL), GO-AgNPs (5 μg/mL), or DOX (1 μg/mL) for 24 h with and without caspase-3/9 inhibitor for 24 h. The activity of caspase-9/3 was measured in the cancer cells using a kit from Sigma-Aldrich according to the manufacturer’s instructions.
TUNEL assay
Apoptosis induced by GO (25 μg/mL), GO-AgNPs (5 μg/mL), or DOX (1 μg/mL) was determined using the TUNEL assay. Apoptotic cells were determined using a DNA fragmentation imaging kit (Hoffman-La Roche Ltd., Basel, Switzerland) following the manufacturer’s instructions. Briefly, SH-SY5Y cells were cultured in 6-well plates (1.5×10⁶ per well) to study the apoptosis in adherent cells. Cells were treated with GO (25 μg/mL), GO-AgNPs (5 μg/mL), or DOX (1 μg/mL) for 24 h. After the incubation period, the culture medium was aspirated off, and the cell layers were trypsinized. The trypsinized cells were reattached on 0.01% polylysine-coated slides, fixed with 4% methanol-free formaldehyde solution, and stained according to the manufacturer’s instructions for the TUNEL protocol. The stained cells were observed with a Carl Zeiss (Axiovert) epifluorescence microscope using a triple bandpass filter.
Transmission electron microscopy (TEM) analysis of intracellular organelles
TEM analysis was performed to determine the structural integrity of cellular organelles in SH-SY5Y cell lines. The cells were treated with GO (25 μg/mL), GO-AgNPs (5 μg/mL), or DOX (1 μg/mL) for 24 h, harvested, fixed with a mixture of 2% paraformaldehyde and 2.5% glutaraldehyde in 0.2 M PBS for 8 h at pH 7.2, washed six times in PBS, and then post-fixed in 1.33% osmium tetroxide in the same buffer for 1 h at room temperature. After fixation, the cells were incubated with 1% osmium tetroxide in PBS for 2 h. The fixed cells were dehydrated in ascending concentrations of ethanol (70%, 80%, 90%, 95%, and 100%) and embedded in EMbed 812 resins (EMS, Hatfield, PA, USA) via propylene oxide. Ultrathin sections were obtained using an ultramicrotome (Leica Microsystems, Wetzlar, Germany) and were double stained with uranyl acetate and lead citrate. The stained sections on the grids were then examined with an H7000 TEM (Hitachi Ltd., Tokyo, Japan) at 80 kV.
Statistical analyses
All assays were conducted in triplicate, and each experiment was repeated at least three times. The results are presented as mean ± standard deviation. All the experimental data were compared using the Student’s t-test. A P-value <0.05 was considered statistically significant.
Results and discussion
Synthesis and characterization of GO-AgNPs nanocomposite
The large surface area of GO and the direct growth of AgNPs on the GO surface allow synergistic action of the two molecules in a single platform, which is extremely important for antibacterial and anticancer activity. Therefore, we synthesized a GO-AgNPs nanocomposite in the presence of quercetin as a reducing and stabilizing agent. The synthesized GO-AgNPs nanocomposite was characterized by UV-visible spectroscopy. The UV-vis absorption spectrum of the GO sample showed a characteristic band at 230 nm, which corresponds to the electronic π–π* transitions of C–C aromatic bonds and a shoulder at 300 nm, which can be assigned to the n–π* transitions of C=O bonds.37,50 GO-AgNPs nanocomposites exhibited a plasmon absorption band at 230 nm and 420 nm, indicating the presence of AgNPs in the GO dispersion (Figure 1A). As a positive control, we used pure AgNPs, which show emblematic characteristic absorption band at 420 nm. The presence of a band at 420 nm in the GO-AgNPs dispersion is attributed to the surface plasmon resonance of silver nanoparticles in the composite.22,37 The new absorbance peak for AgNPs was near 420 nm and appeared after decoration with AgNPs on the surface of GO, which suggested that the change in the curve at 420 nm for the GO and AgNPs mixture was indicative of successful silver nitrate reduction to AgNPs and their decoration on the surface of GO nanosheets.39,41 This is the characteristic feature of AgNPs due to the plasmon absorption of GO-AgNPs.21 In the case of GO-AgNPs nanocomposites, both types of absorption signals were observed for AgNPs and GO (Figure 1A), and the presence of AgNP and GO peaks within the composite clearly indicated the successful synthesis of GO-AgNPs nanocomposites. Furthermore, UV-vis analysis was performed to demonstrate the spectrum of quercetin, and the spectra of quercetin showed presence of a bathochromic shift of the absorption peaks of the aromatic region of quercetin from 280 nm to 380 nm (Figure 1A).
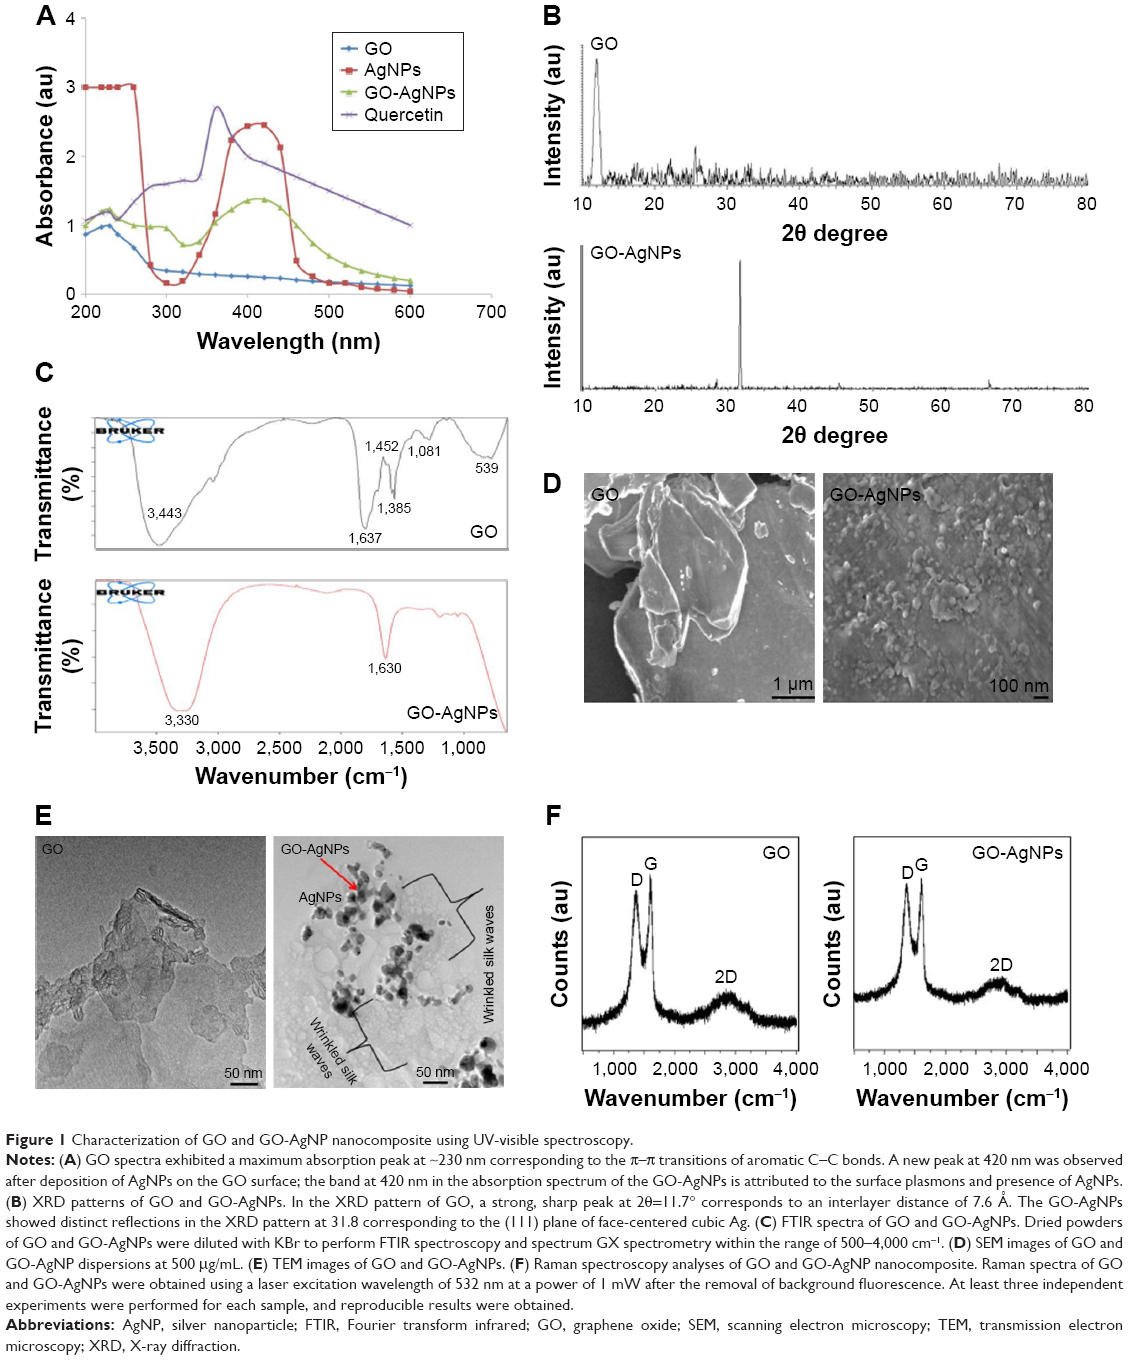 | Figure 1 Characterization of GO and GO-AgNP nanocomposite using UV-visible spectroscopy. |
The decoration of AgNPs on the surface of GO was confirmed by X-ray diffraction (XRD) analysis. As shown in Figure 1B, the XRD patterns confirmed the presence of AgNPs on the surface of GO. The broad XRD reflection peak at 11.7° corresponds to an interlayer distance of 7.6 Å (d002) and could be attributed to the diffraction of amorphous GO structures and related to the exfoliation of graphite.51,52 The composite containing AgNPs showed diffraction peaks at 31.8°, which could be indexed to the (111) diffractions of metallic silver, suggesting the formation of metallic silver particles.20 The data obtained from the quercetin-mediated synthesis of GO-AgNPs were consistent with that of pepsin-assisted synthesis of GO-AgNPs.37 Altogether, the results from the XRD data confirmed the presence of AgNPs on the surface of GO sheets. The results are consistent with those of GO-AgNPs produced by other methods, including reduction of AgNO3 with the chemiluminescent reagent luminol in the presence of GO,53 microwave-assisted green synthesis of Ag/reduced GO nanocomposite,54 the solvo-thermal method,55 and pepsin-assisted synthesis of GO-AgNPs.37
Fourier transform infrared (FTIR) spectroscopy was used to analyze the involvement of biomolecules in the synthesis of the GO-AgNPs composite. As shown in Figure 1C, the presence of an absorption band at ~1,637 cm−1 corresponded to the C=C bonding of the aromatic rings of the GO carbon skeleton structure.37 The presence of other oxygenated functional groups was also detected, including OH at ~3,443 cm−1 and 1,385 cm−1 and C–O at 1,081 cm−1. In contrast, there was a significant decrease in the intensity of the absorption bands of the oxygenated functional groups at ~3,330 cm−1 and 1,081 cm−1 for the GO-AgNPs sample. This is probably due to the existence of AgNPs on the surface of GO. These data suggested that the synthesized GO-AgNPs composite is stabilized by a number of quercetin residues through their amine functional groups. Variation of the peak between GO and GO-AgNPs demonstrated the interaction between silver ions and carboxylate groups on the edge of the GO sheets through the formation of a coordination bond or through simple electrostatic attraction.56 Further, we observed that some of the bands were slightly shifted because of the change in the hydrophobic nature of the deoxygenated sample compared with those of the initial GO. Further analysis showed that although the functional group GO was observed in the GO-AgNPs nanocomposite, the peak positions of the functional groups were significantly reduced; particularly, the intensity of C=O carbonyl stretching (1,637 cm−1) and hydroxy-OH (3,443 cm−1) was decreased, and this change proves that there was an interaction between AgNPs and GO.
The surface morphology of GO and the deposition of AgNPs on its surface was confirmed by scanning electron microscopy (SEM) analysis. GO sheets showed a well-packed, folded (with a silky wave-like) morphology formed by the stacking of exfoliated nanosheets.27 The surface morphology resembled a strongly folded curtain, and GO flakes overlapped rather than aggregated. A significant morphological difference was observed between GO and GO-AgNPs (Figure 1D). Distinct, spherical AgNPs were uniformly spread on the surface of the composite nanosheets. The distribution of AgNPs on the GO sheets suggested a homogeneous distribution of AgNPs on the GO sheets. The results obtained from this study indicated significant exfoliation of graphite during the oxidation process and efficient reduction of GO and AgNO3 to GO-AgNPs by quercetin (Figure 1D). Our results are consistent with structural arrangements of GO/silver nanoparticle composites formed by the reduction of AgNO3 and GO in the presence of luminol53 and pepsin.37
TEM analysis was performed to confirm the surface and structural morphology of the successfully prepared GO-AgNPs composites and measure the uniform distribution of AgNPs on the GO sheets.21,37 GO-AgNPs images clearly showed transparent, single-layer sheets containing flake-like wrinkles (Figure 1E), whereas images of AgNPs-decorated GO surfaces showed AgNPs deposited evenly on the GO sheets with an average size of 15±3.0 nm. The presence of wrinkled silk waves on the GO sheets was also observed, which can be attributed to the deposition of AgNPs on the surface of the GO sheets.52 The TEM images of GO-AgNPs showed that the interaction between the AgNPs and GO was significant because most of the AgNPs were distributed uniformly within the GO sheets with an average size of 15 nm.53 Moreover, the GO-AgNPs composite exhibited a flat, smooth surface due to the presence of metallic nanoparticles, and the structure of GO-AgNPs had a thin and smooth surface (Figure 1E). Our findings are consistent with previously reported studies on green synthesis of GO-AgNPs nanocomposites using various molecules, including luminol and tryptophan.53,57 Altogether, our results suggest that biomolecules serve as suitable reducing agents for the synthesis of GO-AgNPs nanocomposites with high solubility and no aggregation. The TEM image of the GO-AgNPs nanocomposite suggested strong interactions between the AgNPs and GO.58 It was clearly demonstrated that AgNPs were anchored around the surface of the GO, and it was concluded that the presence of quercetin catalyzed the reduction of AgNO3 to AgNPs on the GO surface.
Finally, we confirmed the structural property of GO-AgNP nanocomposites by Raman spectroscopy, which is a valuable technique to characterize the structural and electronic properties of GO nanosheets and has previously been used to characterize the disorder, crystal structure, defects, and doping levels of graphite, GO, and graphene-based materials and nanocomposites.59,60 Figure 1F shows that the Raman spectra of GO before and after AgNPs were adsorbed on its surface. Two characteristic D and G bands around 1,374 cm−1 and 1,596 cm−1 were observed, and after the reduction by quercetin, the D and G bands were observed around 1,370 cm−1 and 1,593 cm−1. The D band provides information on the breathing mode of the κ-point, and the G band relates to the tangential stretching mode of the E2g phonon of the sp2 carbon atom.59,60 Interestingly, the ID/IG ratio between GO and GO-AgNPs increased from 1.4 to 1.7 after the decoration of AgNPs on the surface of GO. This indicated that the reduction of GO and AgNO3 in the presence of quercetin was successful. The relative intensity of the two main Raman peaks, D and G, indicated the efficient reduction of GO by quercetin.
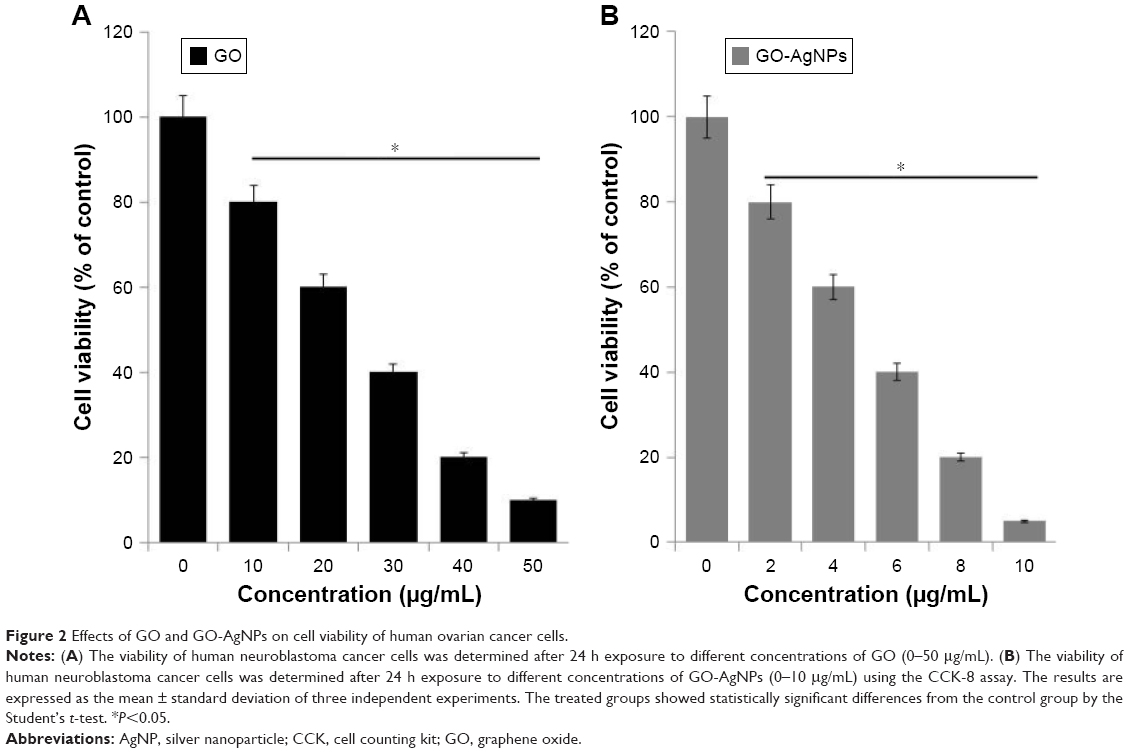
Effect of GO-AgNPs on SH-SY5Y cell viability
In order to evaluate the effect of GO-AgNPs on SH-SY5Y cell viability, cells were treated with various concentrations of GO (10–50 μg/mL) or GO-AgNPs (2–10 μg/mL) for 24 h, and the percentage of cell viability is presented in Figure 2A and B, respectively. The results showed that both GO and GO-AgNPs reduced the percentage of cell viability in human SH-SY5Y neuroblastoma cells at 24 h in a dose-dependent manner. On the other hand, at a higher IC50 concentration, the GO (25 μg/mL) showed relatively less cytotoxic effects compared to that of GO-AgNPs (5 μg/mL) at 24 h, suggesting that GO requires at least a fivefold higher concentration to cause a reduced percentage of viability similar to that of GO-AgNPs (5 μg/mL). Therefore, the results from our investigation suggested that neuroblastoma cancer cells are more sensitive to GO-AgNPs than GO and that both GO and GO-AgNPs decrease the cell viability in a dose-dependent manner and significantly decrease the number of viable cells with an IC50 of 25 μg/mL and 5 μg/mL, respectively. Similarly, plant extract-assisted synthesized graphene–silver nanocomposites performed significantly better than GO in human ovarian cancer cells,28 and the GO-AgNP nanocomposite was more toxic than pristine GO and pristine AgNPs to both tumoral line macrophages (J774) and peritoneal macrophages.40 Previously, several studies suggested that GO and AgNPs independently and effectively inhibit the cell viability in various types of cancer cells, including human breast cancer cells20 and human ovarian cancer cells.28 Akhavan et al61 reported the size-dependent toxicity of reduced graphene oxide nanoplatelets (rGONPs) in MSCs. They concluded that the significant loss of cell viability was observed by exposure to 1.0 μg/mL rGONPs with average lateral dimensions (ALDs) of 11±4 nm, while the rGO sheets with ALDs of 3.8±0.4 μm could exhibit a significant cytotoxic effect only at a high concentration of 100 μg/mL after a 1-h exposure time. The loss of cell viability by exposure to graphene materials depends on the size, surface chemistry, charge, and physicochemical properties of the materials. The results from our studies suggested that the stronger cytotoxic effect of GO-AgNPs is due to the synergistic action of both GO and AgNPs in a single platform.
 | Figure 2 Effects of GO and GO-AgNPs on cell viability of human ovarian cancer cells. |
GO-AgNPs influence the proliferation of SH-SY5Y cells
To corroborate the results obtained from the cell viability assay, we performed a trypan blue assay to assess the effect of GO-AgNPs on cell proliferation. The SH-SY5Y cells were treated with increasing doses of GO (25 μg/mL) and GO-AgNPs (5 μg/mL) for 24 h. A concentration-dependent response from GO and GO-AgNPs was observed in the SH-SY5Y cells. As shown in Figure 3A and B, GO-AgNPs inhibited 50% cell growth even at a low dose of 5 μg/mL. The cell proliferation was significantly reduced to 50% at 25 μg/mL by GO. It was concluded that although both GO and GO-AgNPs inhibited cell growth in a dose-dependent manner, the greatest potential toxicity was observed with GO-AgNPs. Moreover, the trypan blue assay confirmed that GO-AgNPs markedly inhibited cell proliferation in SH-SY5Y cells. Similarly, GO nanoribbons significantly reduced the cell number in the presence of GO (2 μg/mL) after 72 h of incubation.30 In contrast, one study has shown that low concentrations of GO could support embryonic stem cell (ESC) growth, while graphene inhibited the differentiation of ESCs to endoderm, GO promoted their differentiation to endoderm.62 In addition, GO induced neuronal differentiation of neuroblastoma SH-SY5Y cells.29 Our findings suggest that GO-AgNPs composites were able to inhibit proliferation and would not promote proliferation. Therefore, the mechanism of GO on cell proliferation merely depends on the concentration and type of cells, as well as the size, surface charge, surface chemistry, oxidation time, and several other factors. Since the IC50 of GO and GO-AgNPs significantly reduced neuroblastoma viability and growth in cell viability and proliferation assays, this particular concentration of 25 μg/mL and 5 μg/mL was selected to perform further experiments to elucidate the mechanism of toxicity.
 | Figure 3 Effect of GO-AgNPs on proliferation of human neuroblastoma cancer cells. |
Cytotoxic effect of GO-AgNPs on SH-SY5Y cells
Cytotoxicity is caused by the adverse actions of nanomaterials on cells. LDH and dead-cell protease activity were used to assess cytotoxicity through comparison of cellular function and/or integrity in control cells and those exposed to GO and GO-AgNPs. We also used a well-known anticancer drug for neuroblastoma cancer, DOX, as a positive control in the following experiments. In order to determine the effect of GO-AgNPs on SH-SY5Y human neuroblastoma cytotoxicity, cells were treated with GO (25 μg/mL), GO-AgNPs (5 μg/mL), and DOX (1 μg/mL) for 24 h. The percentage of LDH released to the culture medium (% LDH released) was measured as indices of cellular death. Cells treated with GO-AgNPs showed an increased percentage of LDH compared with that of untreated cells. Although GO induced LDH leakage, it was not at the level of GO-AgNPs-induced LDH leakage. Similarly, DOX induced an increase in the percentage of LDH released compared with that of control cells. GO-AgNPs treatment caused a loss of cell viability, determined as % LDH released, ranging from 40% to ~50% 24 h after treatment with GO-AgNPs (5 μg/mL) (Figure 4A). Similarly, single-walled carbon nanotubes and GOs induced LDH leakage in a concentration-dependent manner in murine peritoneal macrophages.63
 | Figure 4 Effect of GO and GO-AgNPs on cytotoxicity in human neuroblastoma cancer cells. |
Next, to support the results of the LDH assay, we measured cytotoxicity by dead-cell protease activity. To determine dead-cell protease activity in GO-AgNPs-treated SH-SY5Y cells, the cytotoxicity was represented as a cell viability ratio. The results from this assay showed that the viability of SH-SY5Y treated with GO (25 μg/mL), GO-AgNPs (5 μg/mL), and DOX (1 μg/mL) significantly declined to 45%, 60%, and 50%, respectively (Figure 4B). The result from this cytotoxicity assay confirmed that GO-AgNPs could induce significant toxic effects more effectively than GO in SH-SY5Y cells.
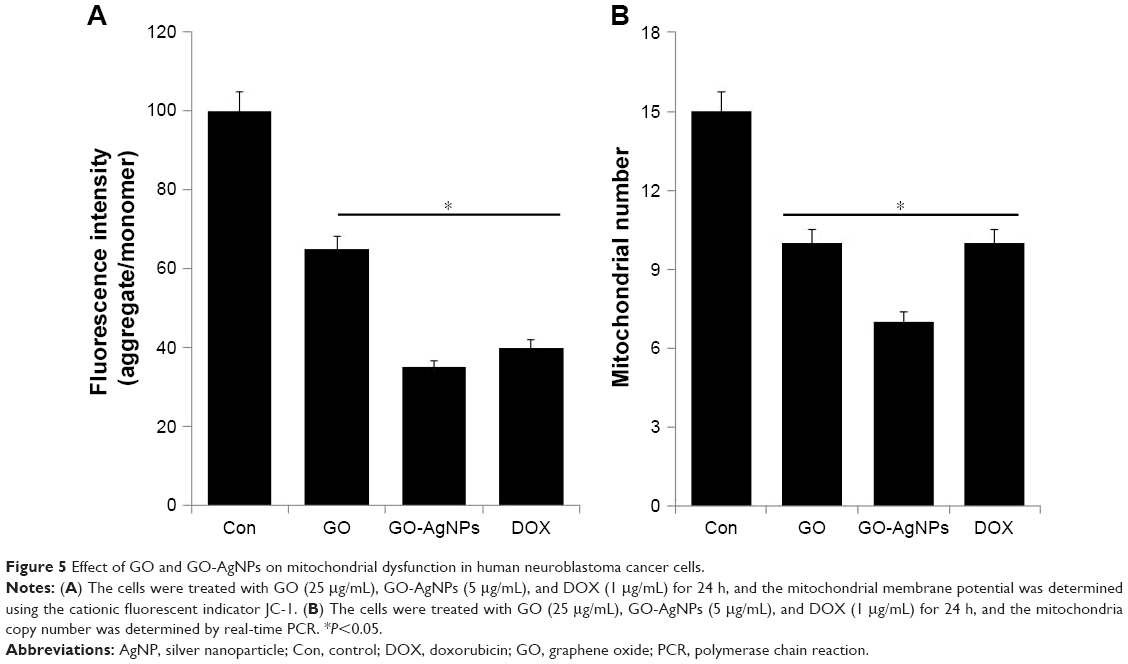
Effect of GO-AgNPs on mitochondrial dysfunction
Mitochondria are essential to maintain physiology, cellular energy balance, synthesis of ATP, and modulation of calcium signaling. Hence, the mitochondria play crucial roles in the induction of cell death.64 Recently, Zhou et al65 found that graphene and graphene-related nanomaterials can interact with the mitochondria, modulating their morphology and function. Therefore, we examined the effect of GO-AgNPs on mitochondrial dysfunction. Among several parameters, determination of MMP is one of the vital factors. Mitochondrial alterations after GO, GO-AgNPs, or DOX treatment were assessed by measuring changes in MMP (Δψm) in the SH-SY5Y cells using the fluorescence probe JC-1. Upon incubation with GO, GO-AgNPs, or DOX, a profound decrease in membrane potential, which was reflected by a decrease in the JC-1 aggregate level and increase in the JC-1 monomer level, was observed in all reagents tested compared with that of the control. We found that the membrane potential reduction caused by GO-AgNPs was comparable with that of DOX. After 24 h of incubation, Δψm was collapsed with GO (35%), GO-AgNPs (65%), and DOX (60%) (Figure 5A). The data showed that both GO-AgNPs and GO treatment caused a remarkable decrease of the aggregate ratio compared with that of the control, which suggested a reduction in MMP. Previously, several studies have reported that AgNPs have a potential impact on various types of cancer cells, including human lung cancer cells17,66 and male germ cells.67 Other studies showed that exposing cells to GO results in the perturbation of the mitochondrial structure and function, as characterized by a decrease in the MMP and the dysregulation of mitochondrial Ca2+ homeostasis.68,69 Similarly, nano-sized GO, pristine graphene, and graphene quantum dots caused time- and concentration-dependent decreases in the MMP.70,71 Altogether, the data from our findings clearly indicate that GO-AgNPs could cause mitochondrial dysfunction through loss of MMP.
 | Figure 5 Effect of GO and GO-AgNPs on mitochondrial dysfunction in human neuroblastoma cancer cells. |
Further, we examined whether GO-AgNPs could influence the number of mitochondria, which could influence the physiology of cells. In order to determine the abnormality and function of mitochondria, the cells were treated with GO (25 μg/mL), GO-AgNPs (5 μg/mL), and DOX (1 μg/mL) for 24 h, and then the mitochondrial abnormality and mtDNA copy number were assessed. Surprisingly, we found that GO-AgNPs-treated cells had lower mtDNA copy numbers compared with that of GO-treated and untreated cells (Figure 5B). The positive control cells that were treated with DOX also showed decreased numbers of mitochondria comparable to that of GO cells. The decreased mtDNA copy number in GO-, GO-AgNPs-, and DOX-treated cells suggested that ROS could be a major player.72 The intracellular ROS could partly regulate mitochondrial network dynamics, which is critical for mitochondrial distribution, density, activity, and size.73 Therefore, we investigated the role of GO-AgNPs on ROS generation.
GO-AgNPs enhance the generation of ROS in SH-SY5Y cells
To determine the correlation between mitochondrial dysfunction and ROS generation in the presence of GO-AgNPs, we measured the level of ROS in GO-AgNPs-treated SH-SY5Y cells. ROS generation has been demonstrated to be responsible for AgNPs- and GO-induced ROS generation.20,28 To determine whether ROS is the mediator of GO-AgNPs-induced apoptosis in SH-SY5Y cells, the cells were treated with GO (25 μg/mL), GO-AgNPs (5 μg/mL), and DOX (1 μg/mL) for 24 h, and ROS levels were measured by DCFH2-DA as described previously.28 As shown in Figure 6A, treatment of cells with GO-AgNPs or DOX stimulated a significant increase of ROS. As we reported earlier, AgNPs are likely to induce ROS generation in various types of cancer cells, including human breast cancer cells, lung cancer cells, ovarian cancer cells, germ cells, and spermatogonial stem cells.17,27,28,67,74 A similar phenomenon was also observed in GO-AgNPs-, and DOX-treated SH-SY5Y cells. Lin et al75 reported that DOX extensively promoted ROS generation in SH-SY5Y cells. Several studies supported that the mechanism of ROS generation is due to the loss of mitochondrial function by graphene toxicity. Li et al76 reported that pristine graphene caused a decrease in the MMP and, consequently, increased levels of intracellular ROS, which activate the mitochondria-dependent apoptotic pathway. On the other hand, GO-AgNPs could target the impairment of ATP production and the overproduction of ROS by decreasing the membrane potential of mitochondria. The evidence from previous studies suggested that GO might act as an electron donor, which increases the supply of electrons to complexes I and II of the electron transport chain (ETC) and accelerates the generation of ROS as a byproduct of mitochondrial respiration.65,77 For instance, mitochondrial depolarization is associated with mitochondrial dysfunction and the overproduction of ROS.68,78 Recently, Mari et al30 reported that GO nanoribbons induced toxicity in human neuroblastoma cancer cell lines such as SK-N-BE(2) and SH-SY5Y. Altogether, the combination of GO and AgNPs in a single platform such as GO-AgNPs could modulate the regulation of mitochondria and increase the generation of ROS.
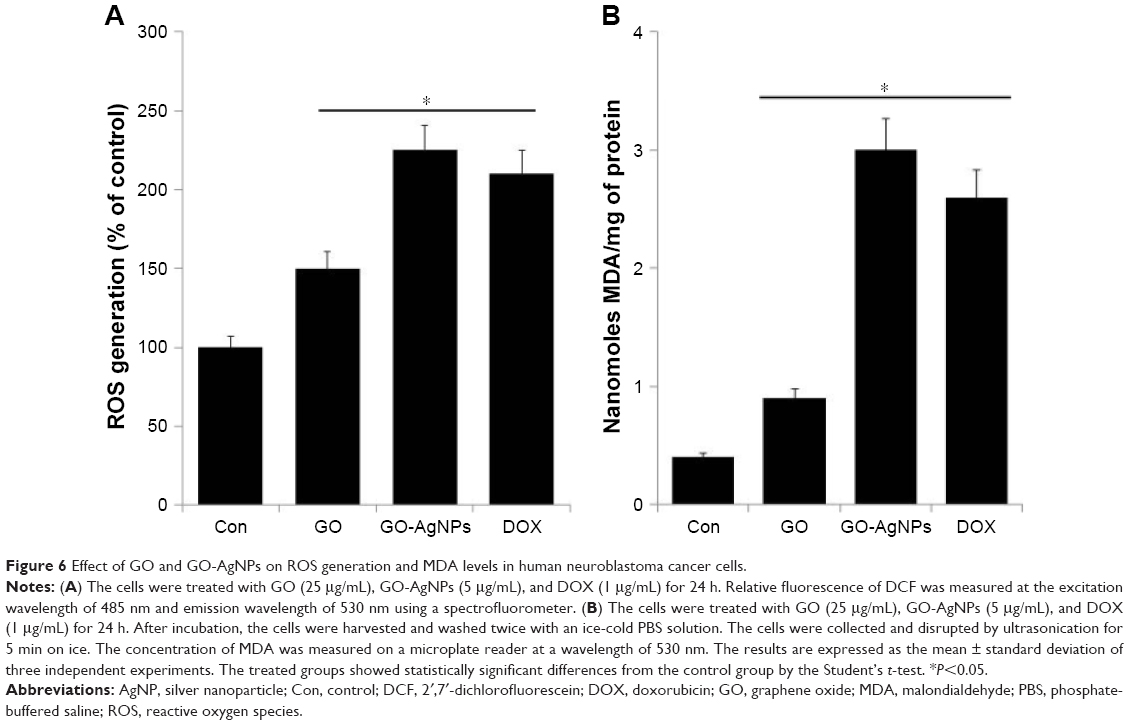 | Figure 6 Effect of GO and GO-AgNPs on ROS generation and MDA levels in human neuroblastoma cancer cells. |
ROS is thought to be a major player in the alteration of macromolecules such as lipids through reactive intermediates that are produced by oxidative stress and can alter the membrane bilayers and cause the lipid peroxidation of polyunsaturated fatty acids (PUFAs).79 The lipid peroxidation and the breakage of lipids with the formation of reactive compounds can lead to changes in the permeability and fluidity of the membrane lipid bilayer and can dramatically alter cell integrity.79,80 The measurement of MDA was used as an important indicator of lipid peroxidation, and it is known as a gauge of carbonyl stress in a variety of cells. To determine the level of MDA, the cells were treated with GO (25 μg/mL), GO-AgNPs (5 μg/mL), and DOX (1 μg/mL) for 24 h, and MDA levels were measured.28 As we expected, the levels of MDA were significantly higher in cells treated with GO-AgNPs than in untreated cells as well as GO-treated cells. The GO-AgNPs nanocomposite increased the level of MDA from 0.5 nmol/mg protein to 3.0 nmol/mg protein, whereas GO and DOX increased the level from 0.4 to 0.9 and 0.4 to 2.6 nmol/mg protein, respectively (Figure 6B). These results suggested that the GO-AgNPs nanocomposite significantly increases the intracellular production of MDA. Wang et al81 reported that MDA in human RPMI 8226 cells increased from 1.6 to 3.1 nmol/mg protein with exposure to 10–200 mg/L GO. Similarly, MCF-7 cells and human ovarian cells treated with AgNPs showed significantly increased levels of MDA.49,82 The combination of GO and AgNPs strongly induced the breakdown of lipids and subsequently increased the level of MDA in SH-SY5Y cells. Collectively, the increased level of MDA could induce carbonyl stress in the cells, which can influence the cell cycle and proliferation of SH-SY5Y cells.
Effect of GO-AgNPs on pro- and anti-apoptotic gene expression
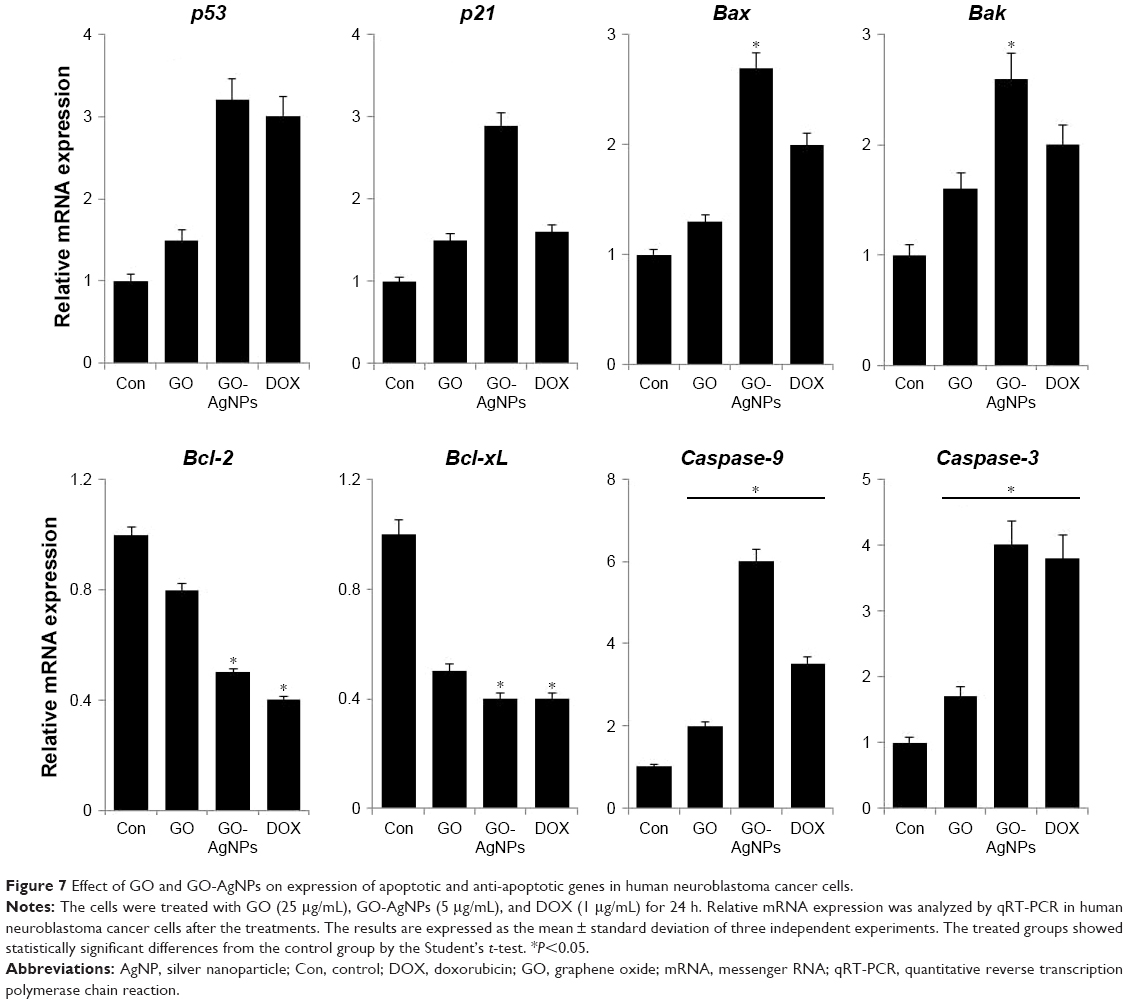
ROS is one of the key players for mitochondria-regulated intrinsic apoptosis. The protection of the integrity of the mitochondrial membrane is afforded by the complex of Bcl-2 proteins, the expression of which regulates the intrinsic apoptosis route.83 It is known that the Bcl-2 family has a key role in determining cell death through mitochondria by activation of Bcl-2 family members, including Bcl-2 and Bcl-xL, and pro-apoptotic proteins such as Bax and Bak. Alteration of membrane permeability is the major responsible factor for mitochondria-mediated apoptosis by activation of caspases, such as caspases-9, −8, and −3.83 Further, several studies strongly suggested that graphene and AgNPs induce apoptosis in p53 and p21 in a dose-dependent manner.49,84 Collectively, to measure the expression of various genes responsible for GO-AgNPs-induced apoptosis, the SH-SY5Y cells were treated with GO (25 μg/mL), GO-AgNPs (5 μg/mL), and DOX (1 μg/mL) for 24 h, and then we measured the expression using qRT-PCR.
The tumor suppressor p53 is known to play an important role in cell cycle arrest, apoptosis, or senescence and eventually induces DNA damage.85 One of the transcriptional targets of p53 is p21, which can act as a cell cycle inhibitor and functions independently in response to a variety of stresses, including DNA damage.86 Therefore, we chose to investigate the p53-mediated pro-apoptotic effect of GO-AgNPs. The p53 messenger RNA (mRNA) expression levels were significantly higher in GO-AgNPs-treated cells than in untreated cells and GO-treated cells (Figure 7). Similarly, GO-AgNPs induced the expression of p21 when compared with untreated and GO-treated cells. DOX was used as a positive control, and the results of DOX exposure also suggested that p53 plays an important role in DOX-induced apoptosis. However, the p21 expression level was not significantly higher in GO- and DOX-treated groups compared with that of GO-AgNP-treated groups. This indicates that GO-AgNPs strongly induced apoptosis in SH-SY5Y cells by the activation of both p53 and p21. Cytotoxic agents such as AgNPs, graphene–silver nanocomposites, and DOX could induce p53, and the activation of p53 can upregulate the pro-apoptotic proteins, such as Bax, Bak, or BH3 family members, with direct targeting of mitochondria and neutralization of anti-apoptotic members of the Bcl-2 family, such as Bcl-2 and Bcl-xL3.87
 | Figure 7 Effect of GO and GO-AgNPs on expression of apoptotic and anti-apoptotic genes in human neuroblastoma cancer cells. |
Bax and Bak genes are essential for mitochondrial dysfunction and apoptosis in response to multiple death signals.88 Next, we measured the expression of Bax and Bak. The results suggested that GO-AgNPs significantly upregulate both Bax and Bak (2.7- and 2.6-fold, respectively) compared with untreated cells (Figure 7). Altogether, these results suggested that Bax/Bak act as a central player in GO-AgNPs-induced apoptosis, which is supported by evidence that the higher Bax/Bak expression level successfully triggered apoptosis via an intrinsic route. Further, to assess the correlation between pro- and anti-apoptotic gene expression, we measured the expression of two candidate genes, Bcl-2 and Bcl-xL. The results suggest that Bcl-2 and Bcl-xL genes were expressed in significantly lower levels in GO- and GO-AgNPs-treated cells than in control cells (Figure 7). Finally, it was determined whether cell death is mediated by caspases because activation of caspases and apoptosis is tightly regulated in various cellular levels. The results from the expression analysis showed that caspase-9 and caspase-3 levels in the cells exposed to GO (25 μg/mL), GO-AgNPs (5 μg/mL), and DOX (1 μg/mL) were significantly higher than in the control. However, the expression levels of caspase-9/3 were remarkably higher in GO-AgNP-treated cells than in GO-treated cells (Figure 7). Similarly, graphene and AgNPs induce caspase-3 activity in various types of cancer cells, including human breast cancer cells and human ovarian cancer cells.28,89 Altogether, these results suggest that GO-AgNPs induced apoptosis via a mitochondria-dependent intrinsic pathway as does DOX.
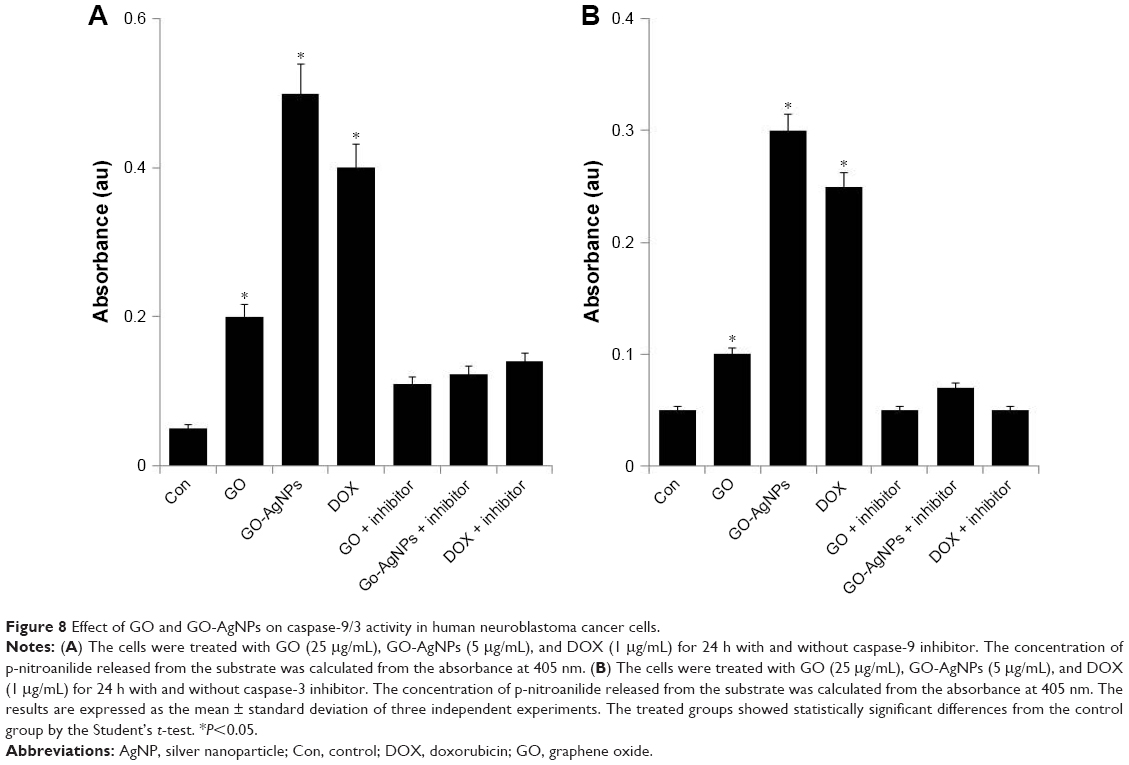
GO-AgNPs activate caspase-9/3
ROS can activate mitochondria- and caspase-dependent apoptotic cell death signaling pathways in both neuronal and non-neuronal cells.90 Several studies reported that caspases (cysteine aspartate-specific proteases) are the molecular initiators of apoptosis.91,92 Previous studies have shown that caspase-9 is activated in response to cytochrome c due to clustering of caspase-9 by Apaf-1 and that this results in activation of caspase-3,93,94 which is the main initiator of caspases. Caspase-3 is a representative cysteine protease that mediates both mitochondria-dependent and -independent apoptotic cell death in response to oxidative stress.95,96 It is generally known that the majority of cytotoxins, anticancer drugs, and nanoparticles induce apoptosis by an intrinsic pathway. Therefore, we examined activation of caspase-9/3 using protein extracts from the SH-SY5Y cells treated with GO (25 μg/mL), GO-AgNPs (5 μg/mL), and DOX (1 μg/mL) for 24 h. As shown in Figure 8A, exposure to GO-AgNPs for 24 h resulted in tenfold increases in caspase-9 enzyme activity compared with that of untreated cells. GO induced fourfold higher caspase-9 enzyme activity compared with that of untreated cells, whereas the caspase-3 activity of GO-AgNPs was sixfold higher than in untreated cells, and GO-induced caspase-3 activity was twofold higher than that of untreated cells (Figure 8B). However, the cells treated with caspase inhibitor completely blocked the activation of caspase-9/3 in the presence of GO, GO-AgNPs, and DOX. Collectively, the caspase-9/3 activity was relatively higher in GO-AgNP-treated cells than in untreated or GO-treated cells, and it induced apoptosis through a caspase-9/3-dependent manner. Similarly, caspase-9/3 activity in DOX-treated cells was significantly higher than in untreated cells and comparable with that of GO- or GO-AgNP-treated cells. Morishima et al97 reported that caspase-9 can also be activated by mechanisms involving neither cyt c release nor Apaf-1 activation, whereas the release of cytochrome c from mitochondria to the cytosol is essential for caspase-3 activation.98 Previously, we have shown that GO and graphene nanocomposites could induce caspase-3 activation in a variety of cancer cell lines, including human breast cancer cells49 and human ovarian cancer cells.28 Caspase-9 plays an important role in activating effector caspases in response to a variety of death stimuli and mitochondrial cytochrome c release. A previous study also demonstrated that caspase-9 is essential for the apoptotic function of p53 in SH-SY5Y neuroblastoma cells and that p53 mediates DNA-damaging drug-induced apoptosis in SH-SY5Y cells through the mitochondrion/caspase-9 pathway.99 It is well known that DOX induces caspase-3 activation through ROS-mediated regulation in SH-SY5Y cells.75 Collectively, these results suggested that GO-AgNPs could induce the caspase-9/3-dependent pathway in SH-SY5Y cells, which leads to a mitochondria-centered cell death that is mediated by mitochondrial outer membrane permeabilization (MOMP) and results in apoptosome formation, activation of caspase-9, and subsequent activation of effector caspases.100
 | Figure 8 Effect of GO and GO-AgNPs on caspase-9/3 activity in human neuroblastoma cancer cells. |
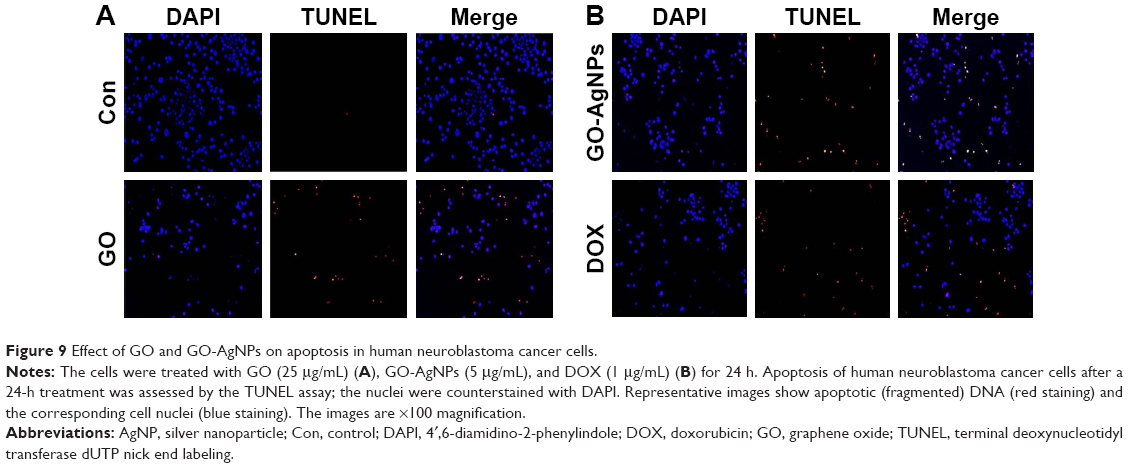
GO-AgNPs induce DNA fragmentation
A variety of stimuli induces apoptosis in multicellular organisms. The apoptotic process is regulated by upstream (initiator) caspases and downstream (effector) caspases. Effector caspases play an important role in initiating the hallmarks of the degradation phase of apoptosis, including DNA fragmentation, cell shrinkage, and membrane blebbing.101,102 The data from previous experiments suggested that ROS play a crucial role in mitochondrial dysfunction and caspase-9/3 activation, and we were interested in examining the role of GO-AgNPs in the final destination of cell death known as DNA fragmentation, which is a parameter to assess cell death. To that end, the SH-SY5Y cells were treated with GO (25 μg/mL), GO-AgNPs (5 μg/mL), and DOX (1 μg/mL) for 24 h. The results indicated that GO-treated cells showed a moderate level of TUNEL-positive cells (Figure 9A) when compared with that of GO-AgNPs and DOX-treated cells and significantly higher than control (Figure 9A). However, treatment with GO-AgNPs causes the appearance of a significant higher number of TUNEL-positive cells (Figure 9B) when compared to GO and untreated cells, and DOX-treated cells showed almost an equivalent level of TUNEL-positive cells such as GO-AgNPs (Figure 9B). However, it is well known that graphene could induce genotoxicity as reported by Akhavan et al;61 for instance, rGO with a diameter of 11±4 nm could enter the nucleus of the human mesenchymal stem cells (hMSCs) and cause chromosomal aberrations and DNA fragmentation at very low concentrations of 0.1 and 1.0 mg/mL in 1 h. However, rGO sheets with diameters of 3.8±0.4 nm exhibited no notable genotoxicity in hMSCs, even at a high dose of 100 mg/mL after 24 h. Subsequently, Akhavan et al103 observed that reduced GO nanoribbons caused DNA fragmentation and chromosomal aberrations in hMSCs. Previously, we have also shown that reduced GO–silver nanocomposites induced a remarkably higher level of DNA fragmentation compared with that of other nanomaterials tested, such as GO, reduced GO, and AgNPs, in human ovarian cancer cells.21 Collectively, these results suggested that a combination of GO and AgNPs effectively induces apoptosis in SH-SY5Y cells.
 | Figure 9 Effect of GO and GO-AgNPs on apoptosis in human neuroblastoma cancer cells. |
GO-AgNPs induces autophagy
The connection between autophagy and apoptosis is an interesting aspect of nanomaterial use in cancer therapy because both processes are essential to maintain the whole organism and cellular homeostasis, respectively. Therefore, we were interested to study how autophagy acts as an executioner of cell death by ROS production induced by GO-AgNPs. ROS seems to be one of the important factors for induction of autophagy.104,105 Autophagy is an evolutionarily conserved catabolic process involving the formation of APs that engulf cellular macromolecules and organelles, leading to their breakdown following fusion with lysosomes.106–109 The characteristic features of autophagy-mediated cell death, which involves multilayer or double-layer intracellular membrane structures enclosing a bulk of cytoplasmic materials or subcellular organelles, were investigated in the GO-AgNPs-treated cells. The SH-SY5Y cells were treated with GO (25 μg/mL), GO-AgNPs (5 μg/mL), and DOX (1 μg/mL) for 24 h and observed under electron microscopy. The control cells showed nuclei with a regular shape, clear nuclear membranes, and normal, intact mitochondria with significant numbers (Figure 10A). Treatment with GO produced intensive vacuolization of cytoplasm along with significant numbers of mitochondria (Figure 10B), whereas GO-AgNPs-treated cells showed autophagic vacuoles and intensive vacuolization of cytoplasm along with APs, which contain partially digested cytoplasmic material and reduced numbers of mitochondria that were consistent with quantitative determination of mitochondrial number by RT-PCR. In addition, when compared with the unexposed control cells, the GO-AgNPs-treated cells showed many multi-vesicular and membrane-rich APs and significant accumulation of autophagic vacuoles compared with that of GO (Figure 10C). The results of the DOX-treated cells indicated that DOX could induce accumulation of lysosomes at the ultrastructural level (Figure 10D). Similarly, treatment with DOX also produced intensive vacuolization of cytoplasm along with autophagic vacuoles.110 Previously, we have shown that AgNPs were internalized and produced significant cellular morphological changes in human lung cancer cells through generation of ROS.111 Furthermore, another study on the combination of AgNPs and salinomycin also resulted in extensive ROS generation in human ovarian cancer cells, and eventually, the combination induced accumulation of APs and autolysosomes/autophagic vacuoles.81 Consistent with our results, previous studies also reported that GO can enter the cells by interacting with the plasma membrane and probably temporarily disrupting the phospholipid bilayer or causing plasma membrane invagination in HepG2 cells and neuroblastoma cell lines, including SK-N-BE(2) and SH-SY5Y.30,112 Mari et al30 further demonstrated that GO nanoribbons at low concentrations and within 72 h of exposure induced autophagy in neuroblastoma cell lines. Evidence from the presence of cytoplasmic vacuoles, especially in treated SK-N-BE(2) cells, and the induction of the lysosomal proteins LC3 and beclin, which are markers of autophagy, also confirmed that the autophagy is mainly due to ROS induced by GO.63 As described previously, GO could induce dysfunction of autophagy by the accumulation of damaged organelles, such as mitochondria, that can then induce oxidative stress, inflammation, and DNA damage.63,113 Altogether, the data from previous studies and our studies showed that in neuroblastoma SH-SY5Y cells, GO-AgNPs potentially induce initial oxidative stress and mitochondrial damage to which cells respond by activating the autophagy process in order to remove damaged proteins and mitochondria.30 Collectively, our studies suggested that GO-AgNPs cause stronger toxicity than that of GO, which is due to different physical and chemical properties of GO-AgNPs and the synergistic effect of GO and AgNPs in a single platform. Our studies clearly suggested that the accumulation of APs and autophagic or enlarged vacuoles may be due to the oxidative stress induced by GO-AgNPs. These preliminary data also suggested that GO-AgNPs may interrupt the autophagic pathway and may have important effects in biomedical applications. Although these studies have indicated that GO-AgNPs could induce autophagy and impair the normal functions of cells, further studies are warranted to detail the mechanism of oxidative stress-mediated autophagy in SH-SY5Y cells.
 | Figure 10 GO- and GO-AgNP-induced accumulation of APs and autophagic vacuoles. |
Conclusion
In this study, we developed a simple, dependable, facile, and green approach for the synthesis of a GO–silver nanocomposite using quercetin to provide efficient toxicity against human neuroblastoma cancer cells. The cytotoxic potential of the successfully prepared GO-AgNPs nanocomposite was evaluated in neuroblastoma cancer cells (SH-SY5Y) using various biochemical assays, including cell viability, proliferation, LDH leakage, and dead-cell protease activity. Furthermore, the mechanism of cytotoxicity was confirmed by measurements of MMP, ROS generation, and expression of pro- and anti-apoptotic genes. The results suggested that the GO-AgNPs induce remarkable cytotoxicity with high apoptotic performance by loss of cell viability and proliferation, enhanced ROS generation, increased expression of pro-apoptotic genes, and decreased levels of anti-apoptotic genes at lower concentrations compared with that of GO, which could be attributed to the synergistic effect of combining GO and AgNPs in a single platform. Interestingly, the results showed that the decoration of AgNPs on GO nurtures a synergistic effect and enhances cytotoxicity with dramatically reduced concentrations required to inhibit cell viability and enhance cytotoxicity. The combined nanomaterials yielded an efficient synergistic effect, which was higher than the sum of the efficacies of the individual nanomaterials. This novel formulation may aid the development of better anticancer therapeutics and could provide an alternative treatment approach for neuroblastoma that does not require chemotherapy, which causes undesired side effects. Moreover, the synthesis method for this composite is simple and can be extended for large-scale synthesis. Furthermore, this graphene-based composite offers unique advantages as an efficient anticancer agent.
Acknowledgments
This work was supported by the KU-Research Professor Program of Konkuk University. Dr Sangiliyandi Gurunathan was supported by a Konkuk University KU-full-time professorship. This project was funded by the Priority Academic Program Development of Jiangsu Higher Education Institutions (PAPD) and China Postdoctoral Science Foundation (2015M571827/1402001C).
Disclosure
The authors report no conflicts of interest in this work.
References
Welch C, Chen Y, Stallings RL. MicroRNA-34a functions as a potential tumor suppressor by inducing apoptosis in neuroblastoma cells. Oncogene. 2007;26(34):5017–5022. | ||
Schor NF. Neuroblastoma as a neurobiological disease. J Neurooncol. 1999;41(2):159–166. | ||
Wagner LM, Danks MK. New therapeutic targets for the treatment of high-risk neuroblastoma. J Cell Biochem. 2009;107(1):46–57. | ||
Ambros PF, Ambros IM, Brodeur GM, et al. International consensus for neuroblastoma molecular diagnostics: report from the International Neuroblastoma Risk Group (INRG) Biology Committee. Br J Cancer. 2009;100(9):1471–1482. | ||
Heck JE, Ritz B, Hung RJ, Hashibe M, Boffetta P. The epidemiology of neuroblastoma: a review. Paediatr Perinat Epidemiol. 2009;23(2):125–143. | ||
Posadas I, Santos P, Cena V. Acetaminophen induces human neuroblastoma cell death through NFKB activation. PLoS One. 2012;7(11):e50160. | ||
Dayem AA, Kim B, Gurunathan S, et al. Biologically synthesized silver nanoparticles induce neuronal differentiation of SH-SY5Y cells via modulation of reactive oxygen species, phosphatases, and kinase signaling pathways. Biotechnol J. 2014;9(7):934–943. | ||
Park JH, Gurunathan S, Choi Y-J, Han JW, Song H, Kim J-H. Silver nanoparticles suppresses brain-derived neurotrophic factor-induced cell survival in the human neuroblastoma cell line SH-SY5Y. J Ind Eng Chem. 2017;47:62–73. | ||
Xie HR, Hu LS, Li GY. SH-SY5Y human neuroblastoma cell line: in vitro cell model of dopaminergic neurons in Parkinson’s disease. Chin Med J. 2010;123(8):1086–1092. | ||
Agholme L, Lindstrom T, Kagedal K, Marcusson J, Hallbeck M. An in vitro model for neuroscience: differentiation of SH-SY5Y cells into cells with morphological and biochemical characteristics of mature neurons. J Alzheimers Dis. 2010;20(4):1069–1082. | ||
Singh J, Kaur G. Transcriptional regulation of polysialylated neural cell adhesion molecule expression by NMDA receptor activation in retinoic acid-differentiated SH-SY5Y neuroblastoma cultures. Brain Res. 2007;1154:8–21. | ||
Lopes FM, Schroder R, da Frota ML Jr, et al. Comparison between proliferative and neuron-like SH-SY5Y cells as an in vitro model for Parkinson disease studies. Brain Res. 2010;1337:85–94. | ||
Alberio T, Lopiano L, Fasano M. Cellular models to investigate biochemical pathways in Parkinson’s disease. FEBS J. 2012;279(7):1146–1155. | ||
Bonilla MA, Cheung NK. Clinical progress in neuroblastoma. Cancer Invest. 1994;12(6):644–653. | ||
Gurunathan S, Kim JH. Synthesis, toxicity, biocompatibility, and biomedical applications of graphene and graphene-related materials. Int J Nanomedicine. 2016;11:1927–1945. | ||
Gurunathan S, Han JW, Kwon DN, Kim JH. Enhanced antibacterial and anti-biofilm activities of silver nanoparticles against Gram-negative and Gram-positive bacteria. Nanoscale Res Lett. 2014;9(1):373. | ||
Gurunathan S, Jeong JK, Han JW, Zhang XF, Park JH, Kim JH. Multidimensional effects of biologically synthesized silver nanoparticles in Helicobacter pylori, Helicobacter felis, and human lung (L132) and lung carcinoma A549 cells. Nanoscale Res Lett. 2015;10:35. | ||
Rai MK, Deshmukh SD, Ingle AP, Gade AK. Silver nanoparticles: the powerful nanoweapon against multidrug-resistant bacteria. J Appl Microbiol. 2012;112(5):841–852. | ||
Sriram MI, Kanth SB, Kalishwaralal K, Gurunathan S. Antitumor activity of silver nanoparticles in Dalton’s lymphoma ascites tumor model. Int J Nanomedicine. 2010;5:753–762. | ||
Gurunathan S, Han JW, Dayem AA, et al. Green synthesis of anisotropic silver nanoparticles and its potential cytotoxicity in human breast cancer cells (MCF-7). J Ind Eng Chem. 2013;19(5):1600–1605. | ||
Gurunathan S, Han JW, Park JH, et al. Reduced graphene oxide-silver nanoparticle nanocomposite: a potential anticancer nanotherapy. Int J Nanomedicine. 2015;10:6257–6276. | ||
Gurunathan S, Lee KJ, Kalishwaralal K, Sheikpranbabu S, Vaidyanathan R, Eom SH. Antiangiogenic properties of silver nanoparticles. Biomaterials. 2009;30(31):6341–6350. | ||
Kalishwaralal K, Banumathi E, Ram Kumar Pandian S, et al. Silver nanoparticles inhibit VEGF induced cell proliferation and migration in bovine retinal endothelial cells. Colloids Surf B Biointerfaces. 2009;73(1):51–57. | ||
Geim AK, Novoselov KS. The rise of graphene. Nat Mater. 2007;6(3):183–191. | ||
Mullick Chowdhury S, Lalwani G, Zhang K, Yang JY, Neville K, Sitharaman B. Cell specific cytotoxicity and uptake of graphene nanoribbons. Biomaterials. 2013;34(1):283–293. | ||
Gurunathan S, Han JW, Eppakayala V, Dayem AA, Kwon DN, Kim JH. Biocompatibility effects of biologically synthesized graphene in primary mouse embryonic fibroblast cells. Nanoscale Res Lett. 2013;8(1):393. | ||
Gurunathan S, Han JW, Eppakayala V, Kim JH. Green synthesis of graphene and its cytotoxic effects in human breast cancer cells. Int J Nanomedicine. 2013;8:1015–1027. | ||
Gurunathan S, Han JW, Kim ES, Park JH, Kim JH. Reduction of graphene oxide by resveratrol: a novel and simple biological method for the synthesis of an effective anticancer nanotherapeutic molecule. Int J Nanomedicine. 2015;10:2951–2969. | ||
Lv M, Zhang Y, Liang L, et al. Effect of graphene oxide on undifferentiated and retinoic acid-differentiated SH-SY5Y cells line. Nanoscale. 2012;4(13):3861–3866. | ||
Mari E, Mardente S, Morgante E, et al. Graphene oxide nanoribbons induce autophagic vacuoles in neuroblastoma cell lines. Int J Mol Sci. 2016;17(12):E1995. | ||
Gurunathan S, Han JW, Park JH, Eppakayala V, Kim JH. Ginkgo biloba: a natural reducing agent for the synthesis of cytocompatible graphene. Int J Nanomedicine. 2014;9:363–377. | ||
Liao KH, Lin YS, Macosko CW, Haynes CL. Cytotoxicity of graphene oxide and graphene in human erythrocytes and skin fibroblasts. ACS Appl Mater Interfaces. 2011;3(7):2607–2615. | ||
Park S, Mohanty N, Suk JW, et al. Biocompatible, robust free-standing paper composed of a TWEEN/graphene composite. Adv Mater. 2010;22(15):1736–1740. | ||
Kim YK, Kim MH, Min DH. Biocompatible reduced graphene oxide prepared by using dextran as a multifunctional reducing agent. Chem Commun (Camb). 2011;47(11):3195–3197. | ||
Lee WC, Lim CH, Shi H, et al. Origin of enhanced stem cell growth and differentiation on graphene and graphene oxide. ACS Nano. 2011;5(9):7334–7341. | ||
Gurunathan S, Woong Han J, Kim E, Kwon DN, Park JK, Kim JH. Enhanced green fluorescent protein-mediated synthesis of biocompatible graphene. J Nanobiotechnology. 2014;12:41. | ||
Sangiliyandi G, Jung Hyun P, Yun-Jung C, Jae Woong H, Jin-Hoi K. Synthesis of graphene oxide-silver nanoparticle nanocomposites: an efficient novel antibacterial agent. Curr Nanosci. 2016;12(6):762–773. | ||
Lok CN, Ho CM, Chen R, et al. Proteomic analysis of the mode of antibacterial action of silver nanoparticles. J Proteome Res. 2006;5(4):916–924. | ||
de Faria AF, Martinez DS, Meira SM, et al. Anti-adhesion and antibacterial activity of silver nanoparticles supported on graphene oxide sheets. Colloids Surf B Biointerfaces. 2014;113:115–124. | ||
de Luna LA, de Moraes AC, Consonni SR, et al. Comparative in vitro toxicity of a graphene oxide-silver nanocomposite and the pristine counterparts toward macrophages. J Nanobiotechnology. 2016;14:12. | ||
Li C, Wang X, Chen F, et al. The antifungal activity of graphene oxide-silver nanocomposites. Biomaterials. 2013;34(15):3882–3890. | ||
Xu J, Sahu S, Cao L, et al. Carbon nanoparticles as chromophores for photon harvesting and photoconversion. Chemphyschem. 2011;12(18):3604–3608. | ||
Nageshwaran S, Majumdar K, Russell S. Hypergammaglobulinemia, normal serum albumin and hypercalcaemia: a case of systemic sarcoidosis with initial diagnostic confusion. BMJ Case Rep. 2012;2012. pii: bcr0120125478. | ||
Rao VH, Kandel A, Lynch D, et al. A positive feedback loop between HER2 and ADAM12 in human head and neck cancer cells increases migration and invasion. Oncogene. 2012;31(23):2888–2898. | ||
Ediriwickrema A, Saltzman WM. Nanotherapy for cancer: targeting and multifunctionality in the future of cancer therapies. ACS Biomater Sci Eng. 2015;1(2):64–78. | ||
Choi YJ, Kim E, Han J, Kim JH, Gurunathan S. A novel biomolecule-mediated reduction of graphene oxide: a multifunctional anti-cancer agent. Molecules. 2016;21(3):375. | ||
Jo HJ, Yona Kim Y, Park HW, et al. The unreliability of MTT assay in the cytotoxic test of primary cultured glioblastoma cells. Exp Neurobiol. 2015;24(3):235–245. | ||
Chen H, Vermulst M, Wang YE, et al. Mitochondrial fusion is required for mtDNA stability in skeletal muscle and tolerance of mtDNA mutations. Cell. 2010;141(2):280–289. | ||
Gurunathan S, Park JH, Han JW, Kim JH. Comparative assessment of the apoptotic potential of silver nanoparticles synthesized by Bacillus tequilensis and Calocybe indica in MDA-MB-231 human breast cancer cells: targeting p53 for anticancer therapy. Int J Nanomedicine. 2015;10:4203–4222. | ||
McAllister MJ, Li J-L, Adamson DH, et al. Single sheet functionalized graphene by oxidation and thermal expansion of graphite. Chem Mater. 2007;19(18):4396–4404. | ||
Eda G, Lin YY, Mattevi C, et al. Blue photoluminescence from chemically derived graphene oxide. Adv Mater. 2010;22(4):505–509. | ||
Stankovich S, Dikin DA, Piner RD, et al. Synthesis of graphene-based nanosheets via chemical reduction of exfoliated graphite oxide. Carbon. 2007;45(7):1558–1565. | ||
He Y, Cui H. Synthesis of highly chemiluminescent graphene oxide/silver nanoparticle nano-composites and their analytical applications. J Mater Chem. 2012;22(18):9086–9091. | ||
Hsu KC, Chen DH. Microwave-assisted green synthesis of Ag/reduced graphene oxide nanocomposite as a surface-enhanced Raman scattering substrate with high uniformity. Nanoscale Res Lett. 2014;9(1):193. | ||
Huang LJ, Wang YX, Tang JG. Synthesis of graphene/metal nanocomposite film with good dispersibility via solvothermal method. Int J Electrochem Sci. 2012;7(11):11068–11075. | ||
Bao Q, Zhang D, Qi P. Synthesis and characterization of silver nanoparticle and graphene oxide nanosheet composites as a bactericidal agent for water disinfection. J Colloid Interface Sci. 2011;360(2):463–470. | ||
Yang B, Liu Z, Guo Z, et al. In situ green synthesis of silver–graphene oxide nanocomposites by using tryptophan as a reducing and stabilizing agent and their application in SERS. Appl Surf Sci. 2014;316:22–27. | ||
Hu C, Liu Y, Qin J, et al. Fabrication of reduced graphene oxide and sliver nanoparticle hybrids for Raman detection of absorbed folic acid: a potential cancer diagnostic probe. ACS Appl Mater Interfaces. 2013;5(11):4760–4768. | ||
Ferrari AC, Meyer JC, Scardaci V, et al. Raman spectrum of graphene and graphene layers. Phys Rev Lett. 2006;97(18):187401. | ||
Niyogi S, Bekyarova E, Itkis ME, et al. Spectroscopy of covalently functionalized graphene. Nano Lett. 2010;10(10):4061–4066. | ||
Akhavan O, Ghaderi E, Akhavan A. Size-dependent genotoxicity of graphene nanoplatelets in human stem cells. Biomaterials. 2012;33(32):8017–8025. | ||
Chen GY, Pang DW, Hwang SM, Tuan HY, Hu YC. A graphene-based platform for induced pluripotent stem cells culture and differentiation. Biomaterials. 2012;33(2):418–427. | ||
Wan B, Wang ZX, Lv QY, et al. Single-walled carbon nanotubes and graphene oxides induce autophagosome accumulation and lysosome impairment in primarily cultured murine peritoneal macrophages. Toxicol Lett. 2013;221(2):118–127. | ||
Zhang XF, Liu ZG, Shen W, Gurunathan S. Silver nanoparticles: synthesis, characterization, properties, applications, and therapeutic approaches. Int J Mol Sci. 2016;17(9):E1534. | ||
Zhou H, Zhang B, Zheng J, et al. The inhibition of migration and invasion of cancer cells by graphene via the impairment of mitochondrial respiration. Biomaterials. 2014;35(5):1597–1607. | ||
Jeong JK, Gurunathan S, Kang MH, et al. Hypoxia-mediated autophagic flux inhibits silver nanoparticle-triggered apoptosis in human lung cancer cells. Sci Rep. 2016;6:21688. | ||
Han JW, Jeong JK, Gurunathan S, et al. Male- and female-derived somatic and germ cell-specific toxicity of silver nanoparticles in mouse. Nanotoxicology. 2016;10(3):361–373. | ||
Lammel T, Boisseaux P, Fernandez-Cruz ML, Navas JM. Internalization and cytotoxicity of graphene oxide and carboxyl graphene nanoplatelets in the human hepatocellular carcinoma cell line Hep G2. Part Fibre Toxicol. 2013;10:27. | ||
Li Y, Wu Q, Zhao Y, et al. Response of microRNAs to in vitro treatment with graphene oxide. ACS Nano. 2014;8(3):2100–2110. | ||
Chatterjee N, Eom HJ, Choi J. A systems toxicology approach to the surface functionality control of graphene-cell interactions. Biomaterials. 2014;35(4):1109–1127. | ||
Qin Y, Zhou ZW, Pan ST, et al. Graphene quantum dots induce apoptosis, autophagy, and inflammatory response via p38 mitogen-activated protein kinase and nuclear factor-kappaB mediated signaling pathways in activated THP-1 macrophages. Toxicology. 2015;327:62–76. | ||
Salvioli S, Bonafe M, Capri M, Monti D, Franceschi C. Mitochondria, aging and longevity – a new perspective. FEBS Lett. 2001;492(1–2):9–13. | ||
Park J, Lee J, Choi C. Mitochondrial network determines intracellular ROS dynamics and sensitivity to oxidative stress through switching inter-mitochondrial messengers. PLoS One. 2011;6(8):e23211. | ||
Zhang XF, Choi YJ, Han JW, et al. Differential nanoreprotoxicity of silver nanoparticles in male somatic cells and spermatogonial stem cells. Int J Nanomedicine. 2015;10:1335–1357. | ||
Lin X, Li Q, Wang YJ, et al. Morphine inhibits doxorubicin-induced reactive oxygen species generation and nuclear factor kappaB transcriptional activation in neuroblastoma SH-SY5Y cells. Biochem J. 2007;406(2):215–221. | ||
Li Y, Liu Y, Fu Y, et al. The triggering of apoptosis in macrophages by pristine graphene through the MAPK and TGF-beta signaling pathways. Biomaterials. 2012;33(2):402–411. | ||
Duch MC, Budinger GR, Liang YT, et al. Minimizing oxidation and stable nanoscale dispersion improves the biocompatibility of graphene in the lung. Nano Lett. 2011;11(12):5201–5207. | ||
Hu F, Wei F, Wang Y, Wu B, Fang Y, Xiong B. EGCG synergizes the therapeutic effect of cisplatin and oxaliplatin through autophagic pathway in human colorectal cancer cells. J Pharmacol Sci. 2015;128(1):27–34. | ||
Barrera G. Oxidative stress and lipid peroxidation products in cancer progression and therapy. ISRN Oncol. 2012;2012:137289. | ||
Dix TA, Aikens J. Mechanisms and biological relevance of lipid peroxidation initiation. Chem Res Toxicol. 1993;6(1):2–18. | ||
Wang F, Liu S, Shen Y, et al. Protective effects of N-acetylcysteine on cisplatin-induced oxidative stress and DNA damage in HepG2 cells. Exp Ther Med. 2014;8(6):1939–1945. | ||
El-Sonbaty SM. Fungus-mediated synthesis of silver nanoparticles and evaluation of antitumor activity. Cancer Nanotechnol. 2013;4(4–5):73–79. | ||
Krishna S, Low IC, Pervaiz S. Regulation of mitochondrial metabolism: yet another facet in the biology of the oncoprotein Bcl-2. Biochem J. 2011;435(3):545–551. | ||
Zhang XF, Gurunathan S. Combination of salinomycin and silver nanoparticles enhances apoptosis and autophagy in human ovarian cancer cells: an effective anticancer therapy. Int J Nanomedicine. 2016;11:3655–3675. | ||
Vogelstein B, Lane D, Levine AJ. Surfing the p53 network. Nature. 2000;408(6810):307–310. | ||
Xia Y, Yang Q, Gong X, Ye F, Liou YC. Dose-dependent mutual regulation between Wip1 and p53 following UVC irradiation. Int J Biochem Cell Biol. 2011;43(4):535–544. | ||
Schuler M, Green DR. Transcription, apoptosis and p53: catch-22. Trends Genet. 2005;21(3):182–187. | ||
Wei MC, Zong WX, Cheng EH, et al. Proapoptotic BAX and BAK: a requisite gateway to mitochondrial dysfunction and death. Science. 2001;292(5517):727–730. | ||
Gurunathan S, Han JW, Eppakayala V, Jeyaraj M, Kim JH. Cytotoxicity of biologically synthesized silver nanoparticles in MDA-MB-231 human breast cancer cells. Biomed Res Int. 2013;2013:535796. | ||
Carvour M, Song C, Kaul S, Anantharam V, Kanthasamy A, Kanthasamy A. Chronic low-dose oxidative stress induces caspase-3-dependent PKCdelta proteolytic activation and apoptosis in a cell culture model of dopaminergic neurodegeneration. Ann N Y Acad Sci. 2008;1139:197–205. | ||
Slee EA, Harte MT, Kluck RM, et al. Ordering the cytochrome c-initiated caspase cascade: hierarchical activation of caspases-2, −3, −6, −7, −8, and −10 in a caspase-9-dependent manner. J Cell Biol. 1999;144(2):281–292. | ||
Yuan J, Shaham S, Ledoux S, Ellis HM, Horvitz HR. The C. elegans cell death gene ced-3 encodes a protein similar to mammalian interleukin-1 beta-converting enzyme. Cell. 1993;75(4):641–652. | ||
Li P, Nijhawan D, Budihardjo I, et al. Cytochrome c and dATP-dependent formation of Apaf-1/caspase-9 complex initiates an apoptotic protease cascade. Cell. 1997;91(4):479–489. | ||
Pan G, Humke EW, Dixit VM. Activation of caspases triggered by cytochrome c in vitro. FEBS Lett. 1998;426(1):151–154. | ||
Kanthasamy AG, Kitazawa M, Kanthasamy A, Anantharam V. Role of proteolytic activation of protein kinase Cdelta in oxidative stress-induced apoptosis. Antioxid Redox Signal. 2003;5(5):609–620. | ||
Ueda S, Masutani H, Nakamura H, Tanaka T, Ueno M, Yodoi J. Redox control of cell death. Antioxid Redox Signal. 2002;4(3):405–414. | ||
Morishima N, Nakanishi K, Takenouchi H, Shibata T, Yasuhiko Y. An endoplasmic reticulum stress-specific caspase cascade in apoptosis. Cytochrome c-independent activation of caspase-9 by caspase-12. J Biol Chem. 2002;277(37):34287–34294. | ||
Skulachev VP. Cytochrome c in the apoptotic and antioxidant cascades. FEBS Lett. 1998;423(3):275–280. | ||
Cui H, Schroering A, Ding HF. p53 mediates DNA damaging drug-induced apoptosis through a caspase-9-dependent pathway in SH-SY5Y neuroblastoma cells. Mol Cancer Ther. 2002;1(9):679–686. | ||
Brentnall M, Rodriguez-Menocal L, De Guevara RL, Cepero E, Boise LH. Caspase-9, caspase-3 and caspase-7 have distinct roles during intrinsic apoptosis. BMC Cell Biol. 2013;14:32. | ||
Shi ZO, Fischer MJ, De Sanctis GT, Schuyler MR, Tesfaigzi Y. IFN-gamma, but not Fas, mediates reduction of allergen-induced mucous cell metaplasia by inducing apoptosis. J Immunol. 2002;168(9):4764–4771. | ||
Woo M, Hakem R, Soengas MS, et al. Essential contribution of caspase 3/CPP32 to apoptosis and its associated nuclear changes. Genes Dev. 1998;12(6):806–819. | ||
Akhavan O, Ghaderi E, Emamy H, Akhavan F. Genotoxicity of graphene nanoribbons in human mesenchymal stem cells. Carbon N Y. 2013;54:419–431. | ||
Deng YN, Shi J, Liu J, Qu QM. Celastrol protects human neuroblastoma SH-SY5Y cells from rotenone-induced injury through induction of autophagy. Neurochem Int. 2013;63(1):1–9. | ||
Kiffin R, Bandyopadhyay U, Cuervo AM. Oxidative stress and autophagy. Antioxid Redox Signal. 2006;8(1–2):152–162. | ||
Gump JM, Thorburn A. Autophagy and apoptosis: what is the connection? Trends Cell Biol. 2011;21(7):387–392. | ||
Kundu M, Thompson CB. Autophagy: basic principles and relevance to disease. Annu Rev Pathol. 2008;3:427–455. | ||
Mizushima N. Autophagy: process and function. Genes Dev. 2007;21(22):2861–2873. | ||
Yang Z, Klionsky DJ. Mammalian autophagy: core molecular machinery and signaling regulation. Curr Opin Cell Biol. 2010;22(2):124–131. | ||
Manov I, Pollak Y, Broneshter R, Iancu TC. Inhibition of doxorubicin-induced autophagy in hepatocellular carcinoma Hep3B cells by sorafenib – the role of extracellular signal-regulated kinase counteraction. FEBS J. 2011;278(18):3494–3507. | ||
Han JW, Gurunathan S, Jeong JK, et al. Oxidative stress mediated cytotoxicity of biologically synthesized silver nanoparticles in human lung epithelial adenocarcinoma cell line. Nanoscale Res Lett. 2014;9(1):459. | ||
Yuan J, Gao H, Sui J, Duan H, Chen WN, Ching CB. Cytotoxicity evaluation of oxidized single-walled carbon nanotubes and graphene oxide on human hepatoma HepG2 cells: an iTRAQ-coupled 2D LC-MS/MS proteome analysis. Toxicol Sci. 2012;126(1):149–161. | ||
White E, DiPaola RS. The double-edged sword of autophagy modulation in cancer. Clin Cancer Res. 2009;15(17):5308–5316. |
 © 2017 The Author(s). This work is published and licensed by Dove Medical Press Limited. The
full terms of this license are available at https://www.dovepress.com/terms
and incorporate the Creative Commons Attribution
- Non Commercial (unported, 3.0) License.
By accessing the work you hereby accept the Terms. Non-commercial uses of the work are permitted
without any further permission from Dove Medical Press Limited, provided the work is properly
attributed. For permission for commercial use of this work, please see paragraphs 4.2 and 5 of our Terms.
© 2017 The Author(s). This work is published and licensed by Dove Medical Press Limited. The
full terms of this license are available at https://www.dovepress.com/terms
and incorporate the Creative Commons Attribution
- Non Commercial (unported, 3.0) License.
By accessing the work you hereby accept the Terms. Non-commercial uses of the work are permitted
without any further permission from Dove Medical Press Limited, provided the work is properly
attributed. For permission for commercial use of this work, please see paragraphs 4.2 and 5 of our Terms.