Back to Journals » Clinical and Experimental Gastroenterology » Volume 13
Quantitative Evaluation of D-Lactate Pathophysiology: New Insights into the Mechanisms Involved and the Many Areas in Need of Further Investigation
Received 30 April 2020
Accepted for publication 20 July 2020
Published 8 September 2020 Volume 2020:13 Pages 321—337
DOI https://doi.org/10.2147/CEG.S260600
Checked for plagiarism Yes
Review by Single anonymous peer review
Peer reviewer comments 2
Editor who approved publication: Professor Everson Artifon
Michael D Levitt,1 David G Levitt2
1Research Service, Veterans Affairs Medical Center, Minneapolis, MN 55417, USA; 2Department of Integrative Biology and Physiology, University of Minnesota, Minneapolis, MN 55455, USA
Correspondence: David G Levitt
Department of Integrative Biology and Physiology, University of Minnesota, Minneapolis, MN 55455, USA
Tel +1 612 594 0272
Fax +1 612 301 1543
Email [email protected]
Abstract: In contrast to L-lactate, D-lactate is produced in minimal quantities by human cells, and the plasma D-lactate concentration normally is maintained at a concentration of only about 0.01 mM. However, in short bowel syndrome, colonic bacterial production of D-lactate may lead to plasma concentrations > 3mM with accompanying acidosis and neurological symptoms – a syndrome known as D-lactic acidosis. Minor increases in plasma D-lactate have been observed in various gastrointestinal conditions such as ischemia, appendicitis and Crohn’s disease, a finding touted to have diagnostic utility. The novel aspect of this review paper is the application of numerical values to the processes involved in D-lactate homeostasis that previously have been described only in qualitative terms. This approach provides a number of new insights into normal and disordered production, catabolism and excretion of D-lactate, and identifies multiple gaps in our understanding of D-lactate physiology that should be amenable to relatively simple investigative study.
Keywords: acidosis, short bowel syndrome, delirium
Introduction
In 1965, Dunlop and Hammond1 described patients in whom a dietary indiscretion led to anion gap acidosis (seemingly not accounted for by lactate) and neurological symptoms of lethargy and ataxia. The authors of this landmark paper were veterinary scientists, and their patients were cattle that had gorged on readily fermentable carbohydrates such as grain or sugars. Dunlop and Hammond showed that these carbohydrates induced a lactate producing ruminal flora that released a form of lactate that was measured by their assay for total lactate but not by the standard clinical assay that measures only the levorotatory optical isomer of lactate (L-lactate). The authors assumed that the compound accounting for the difference between the two assays must be the dextro-rotary isomer, D-lactate, which was a virtually unknown compound in cattle and human physiology. It was shown that a roughly 7 mM difference between the two lactate assays existed in the blood. Without positively identifying D-lactate as the offending agent, the authors proposed that plasma D-lactate accounted for the anion gap acidosis and neurological symptoms and termed this syndrome “D-Lactic Acidosis”.
While it rapidly became apparent that this syndrome was common in farm animals,2 14 years elapsed before the first human example of D-lactic acidosis was reported by Oh et al3 – a patient with short bowel syndrome (SBS) who had recurrent episodes of delirium, gait disturbances and other neurological symptoms. The patient had anion gap acidosis with normal L-lactate and markedly elevated plasma D-lactate, now identified using an assay specific for D-lactate. The authors postulated that malabsorption of carbohydrate secondary to SBS provided substrate for colonic bacterial production of D-lactate, which was absorbed at a rate sufficient to increase normal plasma lactate levels (<0.25 mM) to as high as 20 mM. As of 2018, 98 subjects with the D-lactic acidosis syndrome – high anion gap acidosis, plasma D-lactate concentration >3mM and neurological symptoms – had been reported, almost all of whom had the underlying problem of SBS.4 With the availability of sensitive D-lactate assays, multiple investigators have observed low-grade elevations of plasma D-lactate (usually less than 1 mM) in a variety of conditions, and it has been proposed that identifying these minor elevations could have diagnostic value. Most recently there has been an attempt to implicate trivial D-lactate elevations in the pathogenesis of “brain fogginess” after meals.5
A number of excellent reviews of D-lactic acidosis have been published over the past 30 years.6–8 While these papers provide good summaries of the clinical aspects of the condition, discussions of pathophysiology have been largely qualitative. The novel aspect of the present paper is it focus on providing new, quantitative information on the pathophysiology of D-lactate.
Basics of Normal D-Lactate Biochemistry
This topic previously has been reviewed at length,6–8 and only selected aspects will be discussed in detail. Lactic acid is a three carbon acid with a pKa of 3.8, hence the compound exists almost entirely in the lactate form in most biological systems. The orientation of the hydroxyl group on the C-2 carbon allows for the existence of two stereoisomers of lactate –L-lactate and D-lactate based on the molecule’s ability to rotate polarized light. While the physical chemistry (solubility, etc.) of the isomers are similar, they are distinguished in biological systems, most notably, enzyme activity is stereo isomer specific. The importance of this specificity is illustrated in Figure 1, a simplified representation of the production and catabolism of lactate in humans and bacteria. Glycolysis, results in the production of two pyruvates, which, are oxidized by humans in the tricarboxylic acid cycle or converted to glucose in the Cori cycle. If pyruvate catabolism lags production, pyruvate accumulates in the cell and, in humans, is converted via a reversible L-LDH catalyzed reaction to lactate. This reaction favors lactate such that the usual ratio of L-lactate to pyruvate in the cell is roughly 10:1. An important feature of lactate biochemistry not stressed in previous reviews is that while L-LDH catalyzes a reversible interconversion between L-lactate and pyruvate, human D-LDH irreversibly catalyzes the conversion of D-lactate to pyruvate. Thus, D-lactate is not produced from pyruvate in human cells, and the normal plasma concentration of D-lactate is only about 1:100 that of L-lactate. The production of L-lactate is favored in all higher forms of life, and one has to descend to the octopus to find a species that favors the production of D-lactate.9
 |
Figure 1 Schematic representations of human and anaerobic bacterial metabolism of L- and D-lactate. Notes: 1, bacterial D-LDH catalyzes a reversible reaction between pyruvate and D-lactate (allowing for D-lactate production from pyruvate) while in humans this reaction irreversibly converts D-lactate to pyruvate; 2, the anaerobic bacteria cannot dispose of pyruvate via oxidative reactions, hence all pyruvate produced from glycolysis is converted to lactate or other organic acids such as acetate and butyrate. |
Lactate metabolism by the colonic bacteria (bottom of Figure 1) similarly originates via glycolysis but differs from that of mammals in two regards. First, both bacterial L-LDH and D-LDH reversibly catalyze the intra-conversion of pyruvate to L-lactate and D-lactate. Second, since most bacterial metabolism in the colon is anaerobic, pyruvate/lactate are only minimally eliminated via the oxidation of pyruvate. Rather, colonic bacteria convert pyruvate to other organic acids such as acetic, propionic, and butyric acids, which are absorbed and metabolized by host tissue. However, under certain conditions lactic acid is produced as the end product. If D-LDH is predominant, there is the potential for massive bacterial production of D-lactate.
Since only a minor fraction of intravenously administered D-lactate is excreted intact in the urine,10 the bulk of D-lactate elimination from the plasma requires oxidation to pyruvate. Following the description of D-lactic acidosis, biochemists searched for a D-lactate oxidizing enzyme with the characteristics of L-LDH (ie, cytoplasmic location, reversible reaction with pyruvate, NAD+ cofactor, etc.). When no such enzyme was identified, it was thought that humans lack D-LDH; rather D-lactate catabolism was attributed to a multipurpose mitochondrial enzyme termed D-alpha-carboxy acid dehydrogenase.11 Recently, however, it was demonstrated that humans have a gene that molecular biologists term D-LDH because of its ability to code for a protein that catalyzes the oxidation of D-lactate to pyruvate in fungi and prokaryotes.12,13 When humans with inactivating mutations of this gene were observed to have elevated plasma D-lactate concentrations, it was concluded that the human wild-type gene coded for a protein with D-lactate oxidizing ability. Thus, it appears that the mitochondrial D-LDH of the molecular biologist is the D-alpha carboxy acid dehydrogenase of the biochemist – the long-standing controversy of whether humans have D-LDH was a semantic problem. It is now generally accepted that humans have a D-LDH that is structurally and functionally an entirely different enzyme than is L-LDH. D-LDH, unlike L-LDH, is located on the inner mitochondrial membrane and catalyzes an irreversible reaction to pyruvate. The activity of this enzyme depends on transporters to deliver D-lactate to the inner surface of the mitochondrial membrane, and defects in these transporters could lead to reduced D-lactate oxidation to pyruvate.14 D-LDH activity is widely distributed in various tissues with the highest concentrations in the liver and kidney and the lowest concentrations in brain. Since the only means of elimination of D- and L-lactate is via conversion to pyruvate followed by oxidation of pyruvate, the elimination rates of the two optical isomers are dependent upon the relative activities of D-LDH and L-LDH. Older literature reported that elimination of D-lactate was much slower than that of L-lactate. However, multiple recent studies have uniformly demonstrated that the elimination rate of D-lactate in normal subjects is about 50% of that of L-lactate.
Elimination of Systemic D-Lactate
The rate of elimination of compounds from the body is a function of the serum concentration of the compound, a relationship expressed as “clearance”. Clearance is calculated from: steady state elimination rate of a compound (Q) divided by its serum concentration and has units of mL/minute and is described quantitatively by eq. 1:

As will be demonstrated, a useful application of clearance is for the calculation of the fractional absorption of an oral dose of a compound utilizing the plasma concentration curve of the compound. The total amount absorbed is equal to the total amount eliminated (D), which is described by:
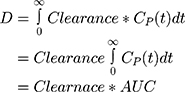
where CP(t) is the time dependent plasma concentration and AUC is the standard “area under the curve”. In the second equality, clearance has been assumed to be a constant, not dependent on concentration. This is not rigorously correct for D-lactate catabolism that saturates at high D-lactate concentrations.
While L-lactate elimination is almost entirely via catabolism, D-lactate is both catabolized and excreted intact in the urine. Lactate is freely filtered by the glomerulus, and since it is more than 99.9% in the anion form (at a pH of 7), tubular reabsorption requires a carrier mediated system. During an intravenous infusion of D-lactate, Oh et al10 quantitated the renal excretion of D- and L-lactate in normal control subjects as a function of the plasma D-lactate concentration. Tubular reabsorption of D-lactate starts to saturate at a plasma concentration of 1 mM, with near-complete saturation at a concentration of 5 mM. Thus, urinary D-lactate excretion is negligible at low concentration and increases to about 80% of the creatinine clearance at 6 mM. While urinary excretion has been assumed to play a major role in the elimination of D-lactate at the high plasma concentrations observed in D-lactic acidosis, this clearly was not the case in patients with D-lactic acidosis for whom D-lactate clearance can be estimated.8,15,16 As shown in Table 1, urinary D-lactate clearance when blood lactate was >6 mM was <7 mL/min, less than 10% of the 80 mL/min predicted for normal subjects. Thus, urinary excretion plays a negligible role in D-lactate elimination in patients with D-lactate acidosis.
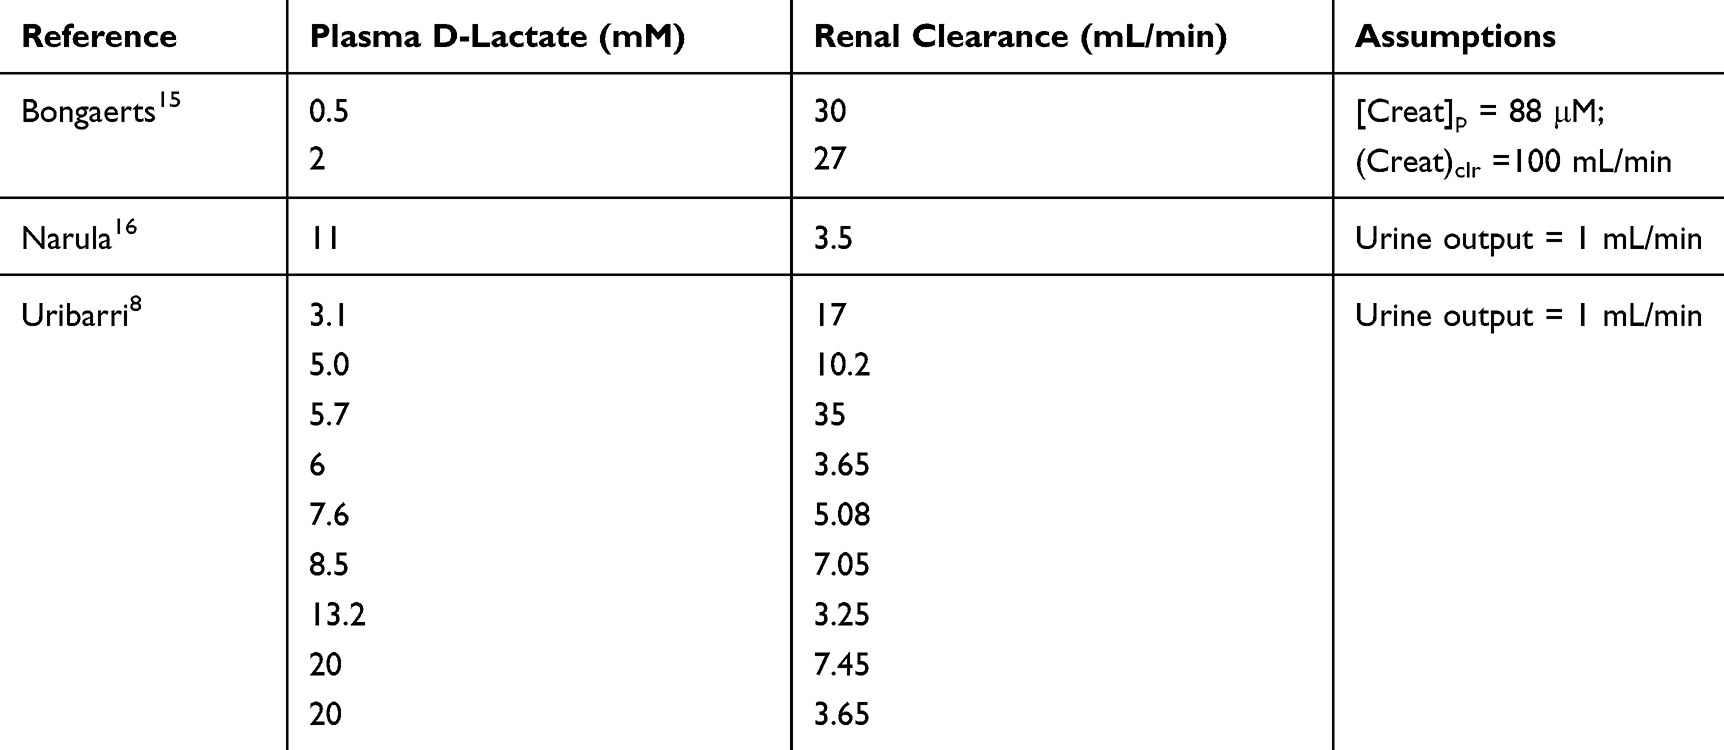 |
Table 1 D-Lactate Urinary Excretion (= Clearance) in D-Lactate Acidosis Patients. Renal Clearance Estimated Assuming Either a Urine Output of 1 ml/min or a Normal Plasma Creatinine (88 micromole/L) and Creatinine Clearance (100 ml/min) |
Since renal function was near normal in most of the subjects listed in Table 1, low urinary clearance cannot be attributed to renal failure. Rather, in these acidotic patients, a larger fraction of the tubular lactate will be in the unionized form in the acidic urine, allowing more rapid non-ionic diffusion from the tubules. At the urine pH of 5.0 observed in severe metabolic acidosis,3 6% of lactate will be unionized, compared to just 0.06% at pH 7.0. This hypothesis is supported by studies with salicylic acid. The cortical collecting duct permeability increased 6.5 fold for salicylic acid when urine pH decreased from 6.0 to 5.0,4 and proximal tubule permeability increased 5.6 fold when pH decreased from 7.0 to 6.0.5 Since the pKa of salicylic acid is 3.0, less than that of lactic acid (3.8), the predicted increase in lactic acid permeability should be greater than that of salicylic acid. This non-ionic diffusion would not have been observed in Oh’s study10 since lactate (not lactic acid) was infused, and the subjects would not have been acidotic.
Whole-body D-lactate clearance (catabolism plus renal excretion) has been directly assessed in four studies involving normal control subjects, summarized in Table 2. Two different techniques were used. Kuze et al17 and Oh et al,10 constantly infused D-lactate until a steady state was reached, at which point the rate of removal must equal the infusion rate, and clearance is determined from the steady-state concentration. Connor et al18 constantly infused D-lactate for 20 minutes and then determined clearance using a non-compartment pharmacokinetic analysis of the plasma concentration curve. The clearance of D-lactate in these studies was surprisingly fast, ranging from 430 to 710 mL/min/70 kg. The results in Table 1 suggest that the clearance decreases as the plasma concentration rises, decreasing from 710 mL/min at 0.115 to 430 mL/min at 5.24 mM. For simple Michaelis-Menten kinetics, this would correspond to a Km of about 6 mM, similar to that observed in vitro measurements of rat liver metabolism9.
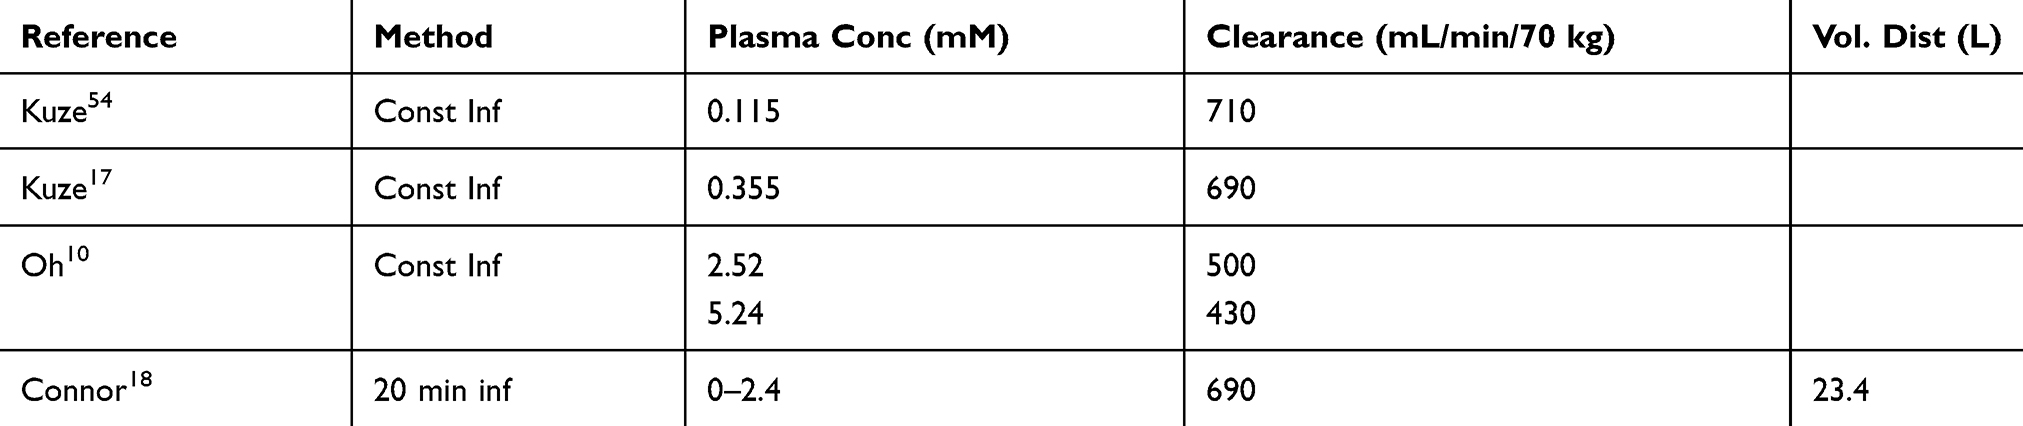 |
Table 2 Normal Human D-Lactate Clearance Measurements |
Extensive study of L-lactate clearance in healthy controls has yielded values ranging from 0.72 L/min/70 kg to 1.89 L/min/70 kg. Thus, D-lactate clearance is about 50% of that of L-lactate. Of interest, data from two studies2,19 in which D-lactate was infused into cattle allowed us to estimate the normal D-lactate clearance of these animals. Our calculated clearances were 40 and 31 mL/min/70 kg, only about 5 −7% of that of humans, which may explain the propensity of cattle to develop D-lactic acidosis.
Based on in vitro tissue assays, the kidney and liver are the main sites of D-lactate metabolism, with the kidney having about 3 times the activity per gm than does the liver.20 Fine21 infused D-lactate into the portal circulation of dogs and directly measured the hepatic extraction from the portal vein – hepatic vein concentration difference. They found a relatively small extraction of about 14%, which, when extrapolated to humans (hepatic blood flow of about 1.5 L/min), corresponds to a clearance of about 210 mL/min, about one-third of the total human D-lactate clearance. Presumably, the other two-thirds of the catabolism is via the kidney.
The rate of D-lactate absorption from the colon in D-lactic acidosis is not known. A perfect model of D-lactate pharmacokinetics (PK) would quantitatively predict the absorption rate necessary to reproduce the observed plasma values. The PK must account for the non-linearity that results from saturation of catabolism and hepatic first-pass metabolism. If sizable, first-pass hepatic metabolism of D-lactate would markedly reduce the plasma lactate concentration resulting from the delivery of equal quantities of D-lactate from the colon verses intravenous infusion (the source of all experimental clearance data). Thus, the standard linear one or two compartment model approach is not applicable; rather, it is necessary to use a complete physiologically based pharmacokinetic model (PBPK) in which the influence of multiple body organs and non-linear metabolism are modeled. We developed such a PBPK model using PKQuest.22,23 The model uses standard human organ flows and adjusts the cell/plasma D-lactate equilibrium partition to reproduce the D-lactate volume of distribution in normal subjects of 24.8 liters, similar to what was directly measured by Connor et al18 The total D-lactate clearance was adjusted to a normal value of 607 mL/min divided one-third liver, two-thirds kidney with a Km of 5 mM. The urinary D-lactate clearance was assumed to be negligible in the D-lactic acidosis patients. Figure 2 shows the good agreement between the plasma concentration curve predicted by the PBPK model (line) and the experimental data (solid circles) of Connor et al18 following a constant IV infusion of 105 mmol of D-lactate over a 20 minute period.
 |
Figure 2 Comparison of the plasma D-lactate experimental data (solid circles) of Connor et al following a 20 minute, 105 millimolar constant IV infusion versus the PBPK model prediction (line) assuming a whole body clearance of 607 mL/min and Km of 5 mM. |
We have assumed that the absorption rate (Abs(t)) of D-lactate from the gut can be approximately described by the following equation:
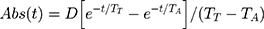
where D is the total amount absorbed, TT is the time constant describing the delay (eg, gastric emptying, small intestinal transport, conversion of carbohydrate to D-lactate) prior to lactate becoming available for absorption from the colon, and TA is the time constant characterizing the absorption rate from the colon.22 As an example of how this model can be used to predict plasma D-lactate concentrations, we used a total daily D-lactate absorption (D) of 1500 mmol, the amount that might be absorbed/day by the average SBS subject (discussed later), TT and TA of 30 and 40 minutes, respectively, and a normal D-lactate clearance of 607 mL/min. Figure 3 shows the predicted plasma concentration curves when the 1500 mM of D-lactate was absorbed as three, sequential 500 mmol inputs, 5 hours apart, simulating what might occur following the ingestion of three meals per day. The top panel corresponds to a rapid absorption rate (TT and TA of 30 and 40 minutes, respectively) and the bottom panel for a slower absorption rate (TT and TA of 30 and 120 minutes, respectively). At the high absorption rate, the predicted plasma concentration cycles rapidly with three, 6 mM peaks and no appreciable accumulation between meals. As would be expected the slower time constant of absorption yields lower, broader peaks.
 |
Figure 3 Plot of the PBPK model prediction of the plasma D-lactate concentration following 3 consecutive inputs of 500 millimoles of D-lactate with the time course described by eq. 3, each separated by 5 hours. It is assumed that the whole body clearance has the normal value of 607 mL/min. Top panel: input (see eq. 3): TT = 30 and TA = 40 minutes. Bottom panel: input TT = 30 and TA = 120 minutes. |
As illustrated in Figure 3, plasma D-lactate is predicted to be strongly correlated with meals. Unfortunately, there have been no serial measurements of D-lactate in D-lactic acidosis patients to determine if such meal-related fluctuations occur. However, Bongaerts et al15 found in one patient that the plasma peak concentration of about 0.94 mM at 6 PM fell to undetectable (less than 0.010 mM) at 6 AM. If plasma D-lactate fluctuates as illustrated in Figure 3, the timing of blood sampling obviously is important. This concept is illustrated by a patient in whom the diagnosis of D-lactic acidosis was initially missed due to the finding of a normal fasting plasma D-lactate concentration.24
Sources of D-Lactate in Humans
Potential sources of D-lactate in humans are: production by gut bacteria, the human mitochondrial methylglyoxal pathway, and ingestion of preformed D-lactate.
D-Lactate Production in the Colon
About 95% of all reported patients with the D-lactic acidosis syndrome have had a major fraction of their small bowel either: a) resected secondary to ischemic injury, Crohn’s disease, etc. or b) defunctionalized via bypass surgery for obesity.4 However, virtually all patients have retained at least a remnant of the colon. Thus, the colon seemingly provides the necessary incubation chamber for the massive bacterial production necessary to develop D-lactic acidosis.
In 1962, surgical bypass of about 90% of the small intestine was introduced as a treatment for obesity. While loss of >100 lb. of weight was routinely achieved, side effects including the expected diarrhea and the unexpected hepatic disease, renal stones, dehydration, arthritis, nutritional deficiencies, repeated hospitalizations, and death led to discontinuation of the procedure in 1975.25 Also reported were “puzzling” neurological manifestations, which in all likelihood were a manifestation of unrecognized D-lactic acidosis.
SBS secondary to surgical resection of diseased small bowel is a rare occurrence with a prevalence rate of about 3 subjects per 100,000 population.26 However, an extensive population of SBS subjects suddenly were created in the 1960’s in regions where surgical bypass of the small bowel became a popular means of treating obesity. For example, by far the most extensive epidemiological study of the frequency of the neurological syndrome in SBS patients was carried out by Thurn et al27 in Minneapolis where they had access to 258 subjects who had undergone small bowel bypass surgery for obesity. Interviews with these patients suggested that as many as 50% had neurological symptoms potentially compatible with D-lactic acidosis. Of importance, presently employed bariatric procedures, which limit food intake and bypass a relatively small fraction of small bowel, have not been associated with D-lactate problems.
Normally, lactate is found in very low concentration (<2 mM) in feces. The well-accepted scenario for over-production of D-lactate in the colon of SBS subjects is that massive delivery of readily fermentable carbohydrate to the colonic bacteria results in rapid organic acid production and a concomitant fall in luminal pH. The acidic pH inhibits acetate and butyrate forming bacteria and selects for lactic acid bacteria,6 and lactic acid accumulates in the feces. Mayeur et al28 showed that lactobacilli routinely were the predominant fecal organism in 16 SBS subjects; however, 8 of these subjects had normal (<2 mM) fecal lactate concentrations, ie, the activity of the non-lactate flora was sufficient to maintain normal fecal lactate concentrations. The other 8 subjects were lactate “accumulators”, with fecal concentrations ranging from 20 mM to 165 mM. Of importance, D-lactate comprised greater than 90% of the lactate in two subjects, each of whom had a past history compatible with D-lactic acidosis.
The quantity of carbohydrate that must be delivered to the colon to induce a predominantly lactic acid producing colonic flora was investigated by Hove and Mortenson29 who measured the fecal lactate concentrations of a small group of healthy subjects fed varying doses of lactulose, a totally non-absorbable disaccharide. At the maximal dosage of 160 g/day, total fecal lactate concentration rose to 43 mM, of which about one-third was D-lactate.
The quantity of lactate produced in and absorbed from the colon of SBS patients is not known. What is known is that 16 SBS subjects (without D-lactic acidosis) ingested an average of 277 g/day of carbohydrate and excreted about 17% of this carbohydrate in some form per rectum (measured as the difference between total fecal calories minus fat + protein calories).28 Thus, an average of 230 g/day of carbohydrate “disappeared” from the intestine via either monosaccharide absorption from the small bowel or organic acid absorption from the colon. Assuming that small bowel absorption of carbohydrate in SBS is similar to the 40% absorption measured for fat and protein, 60% of 230 g/day of carbohydrate or 138 g/day of carbohydrate was absorbed from the colon, presumably almost all in the form of organic acids. If D-lactate were the predominant fecal organic acid (as shown to be likely in Mayeur’s study), the absorption rate of D-lactate theoretically might approach 1550 mmol per day, the value used for the predictions shown in Figure 3.
Absorption of D-Lactate from Colon
Given the short residence time of fecal material in the colon of SBS subjects (3+ bowel movements per day), the majority of colonic D-lactate would be passed per rectum if not rapidly absorbed. The colon has a pore size that prevents the simple passive diffusion of lactate. Thus, absorption seemingly depends on the monocarboxylate transporter (MCT), a family of ubiquitously distributed proteins that facilitate the transport of monocarboxylate compounds, of which lactate is a prime example. The activity of this transporter is dependent upon the binding of a proton along with lactate, both of which are then co-transported across the membrane.30 Several aspects of this transporter are important to the understanding of the pathophysiology of D-lactic acidosis. Given the mechanism of action of MCT, the absorption rate of lactate should be a function of the hydrogen ion gradient across the epithelial membrane. Such was found to be the case in in vivo studies in the sheep intestine31 where the absorption rate of D-lactate increased by 6 fold, as the luminal pH was reduced from 6.3 to 4.3, a range of values observed in the feces of SBS subjects. Thus, the very acid luminal pH resulting from the rapid fermentation of malabsorbed sugars in SBS facilitates the absorption of D-lactate at a rate sufficient to produce the syndrome. As will be discussed, the movement of a proton with D-lactate during MCT facilitated transport is the likely cause of the acidosis of the D-lactic acidosis syndrome.
Methylglyoxal Pathway
Methylglyoxal, a highly toxic intermediate in the metabolism of a variety of compounds, may be catabolized to D-lactate.32 This pathway is thought to be the major, non-gut, endogenous source of D-lactate. Assuming this pathway to be the sole source of blood D-lactate in healthy people, the rate this pathway normally delivers D-lactate to the circulation can be calculated from D-lactate clearance and the plasma D-lactate concentration. Normal plasma lactate concentration has been reported to range from 0.006 mM (high performance liquid chromatography) to 0.25 mM. For illustrative purposes, a clearance of 600 mL/min/70 kg and a steady-state plasma D-lactate concentration of 0.010 mM yields a D-lactate elimination rate = input rate of about 0.006 mmol/min/70 kg, or about 8.6 mmol/day.
The output of D-lactate from the methylglyoxal pathway can increase in several pathological conditions. An association between diabetic ketoacidosis and plasma D-lactate elevations was initially observed in cats33 and more recently in humans,34 who had plasma D-lactate concentrations averaging 3.82 mM (15 and 8 times greater, respectively, than controls and non-ketotic diabetic subjects). The highly significant, positive correlation between the D-lactate concentration and anion gap suggested that D-lactic acidosis was contributing to the diabetic acidosis. The source of the D-lactate in ketoacidosis is thought to be via increased input of ketone bodies into the methylglyoxal pathway.
Propylene glycol is a widely used solvent that exists as a racemic mixture of the D- and L- enantiomer. The D-fraction is metabolized via the methylglyoxal pathway to D-lactate, and markedly increased plasma D-lactate concentrations have been observed in cats fed large doses of propylene glycol (> 1 g/kg).35 Similarly, a patient who mistakenly ingested a large quantity of propylene glycol was reported to have D-lactate concentrations as high as 110 mM/l (a seemingly impossible concentration given the anion gap of only 27 mM).36 The solubilizing/preservative/anti-caking properties of propylene glycol has led to its incorporation into a wide a variety of foods. The average 70 kg US subject ingests about 2.4 g (31 mmol) of propylene glycol per day.37 About 45% of this propylene glycol is excreted unchanged in urine, and about 50% of the remainder appears to be metabolized to D-lactate. Thus, about 8 mmol per day (25% of the normal ingestion) might be converted to D-lactate. Although probably coincidental, the daily normal intake of propylene glycol could roughly account for the small quantity of D-lactate, about 9 mmol, previously calculated to enter the plasma each day of healthy subjects.
Propylene glycol is present in very high concentrations (up to 80% by volume) in some intravenous medications including lorazepam, phenobarbital, phenytoin and nitroglycerine. Prolonged infusions of these drugs have been well documented to produce lactic acidosis although the exact roles played by D- and L-lactate have not been well defined.38
Exogenous D-Lactate
The ingestion of D-lactate containing foods or infusion of D-lactate intravenous fluids provide a source of D-lactate. Lactic acid bacteria play a role in virtually all food fermentation processes, and a variable fraction of the resulting lactate is D-lactate. Yoghurt and sauerkraut have received the most study. Two bacteria, Lactobacillus bulgaricus and Streptococcus thermophilus, are commonly added to milk to bring about fermentation to yoghurt. The relative proportions of each lactate isomer varies with the bacteria employed. In one study of different yoghurts, D-lactate concentrations ranged from 29 to 122 mmol/l.39 DeVrese and Barth40 measured plasma D-lactate concentrations after ingestion of 74 mmol/70 kg of D-lactate (800–1600 g of yoghurt). The plasma concentration peaked at only 0.20 mM at one hour (Figure 4). Calculation of the fractional absorption of D-lactate utilizing the PBPK modeling procedure indicated that 38.2 mmol (52% of the ingested D-lactate) reached the peripheral circulation (Figure 4), with absorption rate constants of TT = 21.6 and TA = 120 minutes, similar to the slow absorption rate assumed in Figures 3, 6 and 7.
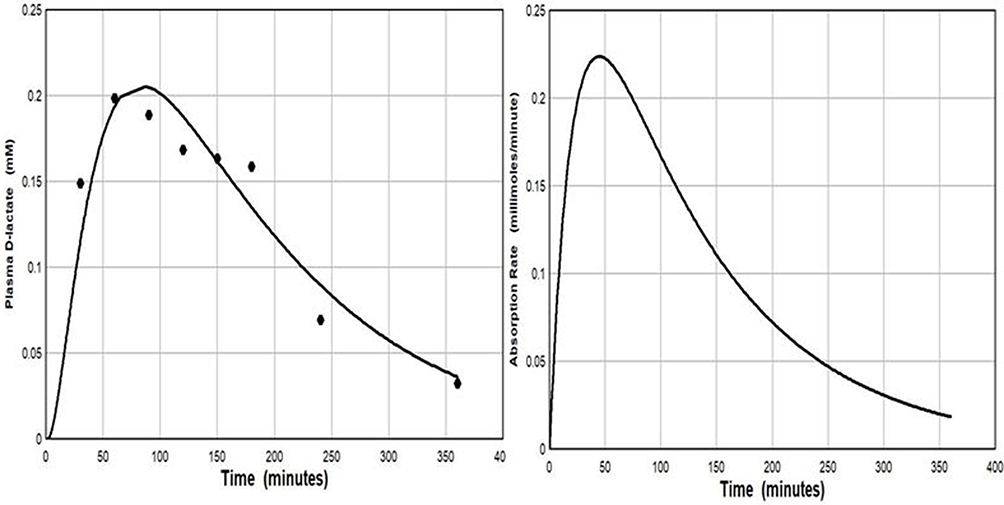 |
Figure 4 Left panel: De Vrese and Barth40 experimental plasma D-lactate concentration following ingestion of 74 mmole of D-lactate as yoghurt (solid circles) versus the PBPK model prediction (solid line) for the normal whole body clearance of 607 mL/min. Right panel: The intestinal absorption rate used to generate the PBPK model plasma concentration (total absorption of 38.2 millimoles D-lactate, with absorption rate described by eq. 3: TT= 21.6 and TA = 116 minutes). |
In contrast to yoghurt, sauerkraut is fermented by lactobacilli naturally attached to the cabbage. Measurements made on the sauerkraut supernatant showed that D-LDH activity far exceeded that of L-LDH and that D-lactate was the predominant form of lactate (concentrations of roughly 80 mmol/l).41 As discussed with yoghurt, ingestion of sauerkraut, even at doses of 1 liter, would result in a trivial increase in blood lactate.
Another source of exogenous D-lactate is lactate containing intravenous solutions that usually contain 28 meq/l of racemic lactate, ie, 14 meq/l of each isomer. Our modeling studies indicate that infusion of this quantity of D-lactate should result in only minor increases in plasma D-lactate, and Kuze et al17 found that subjects infused with D-lactate at a rate of 14 mmol/hour (equivalent to 1 liter of Ringers-lactate/hour) for 3.5 hour rapidly developed a steady-state plasma lactate concentration of only about 0.3 mM. Similarly, the use of a lactate containing solution for peritoneal dialysis showed peak plasma D-lactate concentrations of only about 0.25 mM that returned to normal before the next instillation of dialysate.42
Clinical Measurements of Plasma and Urine D-Lactate
Measurement of D-lactate concentration is not a routine clinical assay, and there is limited information on the frequency with which elevated levels might be unexpectedly found in various disease states. In addition, D-lactic acidosis patients have not been followed with repeated measurements that would allow for such simple insights as to the precise relationship of plasma D-lactate to food ingestion or the rate of decline of elevated levels to normal, which would provide data on clearance.
The normal range for plasma D-lactate concentration cited by a large reference laboratory utilizing a D-LDH-based assay is undetectable to 0.025 mM.43 Normal values of <0.010 have been reported using liquid-chromatography-mass spec techniques,40 and we have utilized a normal value of 0.010 mmol/l for various calculations in this paper. Since the plasma D-lactate concentration is >3.0 (100 x normal) in D-lactic acidosis, the sensitivity of the assay is not crucial to the diagnosis of this condition. However, the sensitivity and accuracy of the assay are important to the validity of reports claiming that relatively trivial rises in plasma D-lactate can serve as markers of various diseases states.
Urinary measurements, either D-lactate concentration or the D-lactate:creatinine concentration ratio, have been used for the diagnosis of D-lactic acidosis. As discussed, urinary D-lactate clearance is markedly and variably reduced in the urine in D-lactic acidosis. In addition, the urine D-lactate concentration is a function of the volume of the urine as well as D-lactate excretion rate. As a result, urine measurements provide a very poor estimate of the plasma concentration, the biologically important value. Thus, there seems to be no clinical utility for urine measurements despite the claim by a large reference laboratory that “urine is the preferred specimen for D-lactate determinations.”43
Pathogenesis of the Elevated Plasma D-Lactate in SBS Patients
The vast majority of all patients with D-lactic acidosis have underlying SBS, and, and as discussed previously, the generally accepted pathogenesis of the >3 mM plasma concentrations are that malabsorption of dietary carbohydrate lead to massive colonic overproduction and absorption of D-lactate. Unfortunately, there are virtually no quantitative measurements of the “nuts and bolts” processes (depicted in Figure 5) that drive the above pathogenetic scheme. Quantitative data are available for just one of these processes depicted in Figure 5 – the urinary excretion of D-lactate, which, as discussed, is negligible. As a result, one can only speculate as to the abnormalities responsible for the very high plasma D-lactate of the occasional SBS patients who develops D-lactic acidosis and why the condition is episodic in these patients.
 |
Figure 5 Schematic representation of the various processes that could influence the plasma D-lactate concentration. The direction of the solid arrows indicates whether an increase in the process potentially increases (up arrow) or decreases (down arrow) plasma D-lactate. For example, an increase in carbohydrate (CHO) ingestion would provide an increased substrate for intestinal bacteria and increase D-lactate production; while an increased CHO intestinal absorption rate would decrease the substrate for the intestinal bacteria and therefore, potentially, decrease plasma D-lactate. |
Clearly SBS subjects with D-lactic acidosis must have a greater imbalance between the rate that D-lactate is absorbed versus elimination from the circulation than does the usual SBS subject. Since neither of these rates has been measured in SBS, determining their relative contributions is speculative. Uribarri et al8 indirectly assessed the normality of D-lactate elimination in D-lactic acidosis via a calculation designed to determine if the rate of absorption of D-lactate from the colon of SBS subjects could be sufficiently rapid to produce the requisite plasma D-lactate elevations if the elimination of this compound were to occur at the normal rate. Their conclusion was that “impaired metabolism is a prerequisite for the production of D-lactic acidosis.” We re-analyzed this question using our model of D-lactate elimination and the 1500 mmol/day of D-lactate that we previously calculated to be absorbed by the average SBS patient. Our initial simulation (Figure 3) assumed that the subjects had normal D-lactate clearance of 605 mL/min/70 kg and the daily 1500 mM D-lactate load was absorbed as three 500 mmol “aliquots”, 5 hours apart. It was assumed that TT was 30 minutes, and two different values were used for the absorption rate from colon (Ta) – 40 minutes and 120 minutes. The top panel in Figure 3 shows the predicted data for the short time constant (Ta = 40 minutes). Plasma D-lactate concentrations peak at about 6 mM after each meal and then fall rapidly to trough concentration of about 0.5 mM between meals. No accumulation was predicted to occur during the day. With the slower absorption time constant of 120 minutes (Figure 3, bottom panel), the peaks were lower (4 mM) and broader. Both simulations demonstrated that, with normal D-lactate catabolism, plasma D-lactate would transiently rise to D-lactic acidosis levels (>3 mM) after meals containing the carbohydrate load ingested by the average SBS subject. Whether these transient elevations of D-lactate are sufficient to produce clinical symptoms of D-lactic acidosis is not known. However, it is only the occasional SBS subject who develops D-lactic acidosis, and such subjects might ingest much greater quantities of carbohydrate than does the average SBS subject. For example, two of Mayeur’s subject routinely ingested an average of 441 and 488 g of carbohydrate/day, almost twice that of the average subject. Using the previously employed assumptions, this carbohydrate load would result in the absorption of about 3,000 mmol of D-lactate per day. Figure 6 shows that despite normal catabolism, relatively enormous plasma D-lactate concentrations would develop with peak concentrations of 15 mM using the short time constant for absorption and for the longer time constant, peak values increased from 7.5 mM to about 9.8 mM during the course of the day. Thus, contrary to conventional dogma, these data suggest that it is not necessary to postulate a reduction in D-lactate catabolism to account for the plasma D-lactate concentrations observed in D-lactic acidosis. The major assumptions in the above modeling were the estimation of the quantity of carbohydrate delivered to the colon and the fraction of this carbohydrate converted to D-lactate. Even if overestimated by 50%, subjects ingesting very large quantities of carbohydrate would generate toxic plasma D-lactate concentrations (>3 mM), despite normal D-lactate clearance.
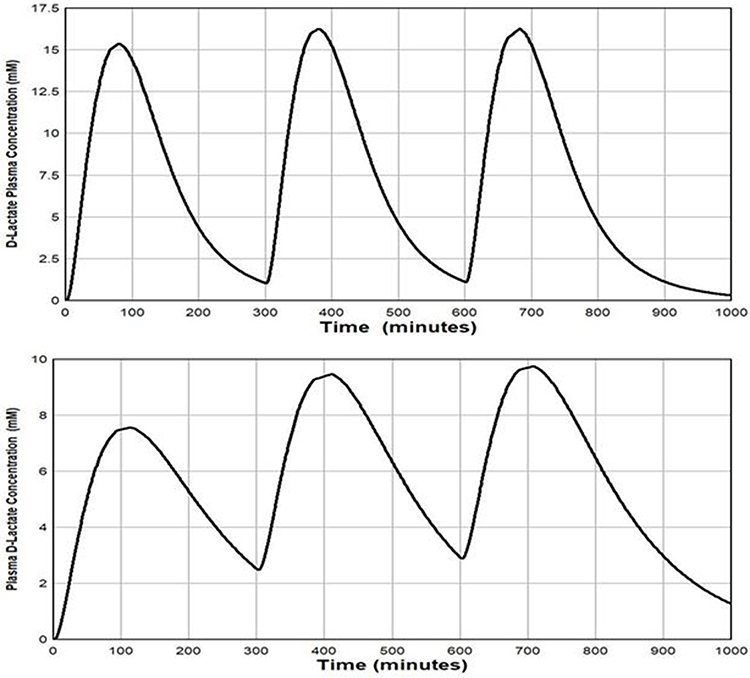 |
Figure 6 Plot of the PBPK model prediction of the plasma D-lactate concentration following 3 consecutive inputs of 1000 millimoles of D-lactate with the time course described by eq. 3, each separated by 5 hours. It is assumed that the whole body clearance has the normal value of 607 mL/min. Top panel: input (see eq. 3): TT = 30 and TA = 40 minutes. Bottom panel: input TT = 30 and TA = 120 minutes. |
Data for a subject who developed D-lactic acidosis after a feeding tube was inadvertently inserted into the colon provide a unique opportunity to assess D-lactate clearance.44 After two days of a constant intra-colonic infusion of 330 g of carbohydrate/day, the patient developed anion gap acidosis, neurological symptoms and a plasma D-lactate concentration of 5.7 mM. Assuming the entire load of carbohydrate was converted to lactate and absorbed, a clearance of 440 mL/day would be required to yield steady-state plasma D-lactate concentration of 5.7 mM. This 440 mL/day clearance is marginally less than our estimate of 500 mL/min/70 kg catabolic clearance rate for healthy subjects at a plasma concentration of 5.7 mM.
Based on the above, we conclude that in the SBS subject, input of D-lactate into the circulation seemingly is the main driver in D-lactic acidosis, and, at most, only minor reductions in D-lactate catabolism might be required to yield the plasma D-lactate concentrations observed in D-lactic acidosis. The influence of a 50% reduction in clearance on the predicted plasma D-lactate concentration of an SBS subject with an input of 1500 mM of D-lactate per day is shown in Figure 7. With the short time constant Figure 7, (top panel), the plasma D-lactate peaks increased in height from 11 mM to 14 mM due to the accumulation of D-lactate between “meals”, and the troughs remain near 3 mM, concentrations clearly compatible with D-lactic acidosis.
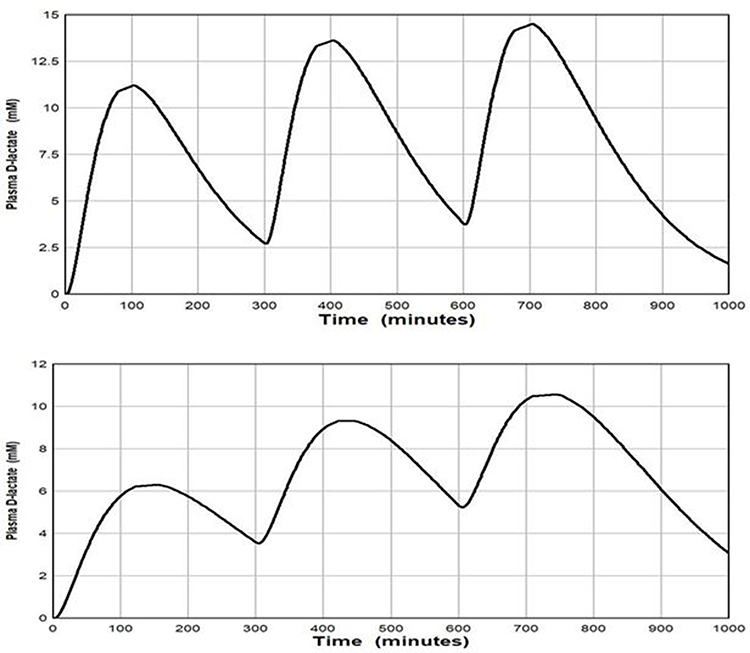 |
Figure 7 Plot of the PBPK model prediction of the plasma D-lactate concentration following 3 consecutive inputs of 500 millimoles of D-lactate with the time course shown in Figure 3, each separated by 5 hours. It is assumed that the whole body clearance is 309 mL/min, half the normal value. Top panel: input (see eq. 3): TT = 30 and TA = 40 minutes. Bottom panel: input TT = 30 and TA = 120 minutes. |
An unusual feature of D-lactic acidosis in SBS is that the first clinical attack virtually always occurs many years after resection of the small intestine, and, subsequently, if not treated, the patient is susceptible to multiple recurrent attacks. Thus, some factor involved in D-lactate homeostasis “deteriorates” over time, and it seems necessary to postulate that it takes years to develop a colonic flora that yields the massive quantities of D-lactate and high colonic permeability required to deliver roughly 1500 mmol per day of D-lactate to the circulation.
The belief that defective D-lactate catabolism plays a major role in the pathogenesis of D-lactic acidosis has led to a good deal of speculation as to factors that might reduce D-LDH activity of SBS subjects. Defective D-lactate elimination could reflect a baseline loss of D-LDH activity due to renal or hepatic tissue injury. Alternatively, there could be inhibitors of D-LDH activity that function at baseline or are operative only during an episode of D-lactic acidosis. An example of the former is oxalate, a potent in vitro inhibitor of D-lactate oxidation;eg, an oxalate concentration of 15 µM halved the rate of catabolism of 3 mM D-lactate.45 Normal plasma oxalate concentrations are <2 uM, and there appear to be no measurements of plasma oxalate concentration in SBS subjects. However, hyperoxaluria, calcium oxalate stones, and oxalate nephropathy, complications of SBS, are indicative of elevated plasma oxalate concentration. Patients with end-stage renal disease have plasma oxalate concentrations of >50 uM,46 and thus would be expected to have very slow D-lactate clearance if oxalate were an in vivo inhibitor of D-LDH. While patients with renal failure being treated with chronic peritoneal dialysis had baseline plasma D-lactate concentrations of about 0.07 mM (seven times normal), intraperitoneally infused D-lactate was metabolized at a normal rate, a result that does not support a role for oxalate in the pathogenesis of D-lactic acidosis.42
It also has been proposed that acidosis associated with elevated plasma D-lactate concentrations inhibit D-LDH. This concept derives from an in vitro study of Tubbs and Greville11 showing that D-lactate oxidation has a broad pH optimum around 8.0, and that this activity falls off rapidly at pH 7.4. The pH optimum of 8.0 makes “sense” given the location of D-LDH in the mitochondrial matrix which maintains a very alkaline pH.47 It seems unlikely that the plasma pH decrement observed in D-lactic acidosis would have an appreciable effect on D-LDH activity via an alteration of intra-mitochondrial pH. The effect of acidosis on human D-lactate catabolism has not been investigated – all measurements of lactate catabolism have utilized an IV infusion of D-lactate, which has an alkalizing effect. However, there are two D-lactate infusion studies in calves, one that used acidified D-lactate such that the plasma pH fell to 7.242 and a second study using D-lactate in a neutral solution where no reduction in pH occurred.21 Our calculated D-lactate clearance for the study with acidosis was 40 mL/min/70 kg and with no acidosis, 31 mL/min/70 kg, a result that does not support the concept that acidosis inhibits D-lactate catabolism.
Role of D-Lactate in the Pathogenesis of the Acidosis and Neurological Malfunction
Acidosis
Metabolic acidosis with a high anion gap not accounted for by L-lactate is a hallmark of D-lactic acidosis. Since the severity of the acidosis roughly correlates with the plasma D-lactate concentration, the explanation for the acidosis seemingly should be linked to the rate that D-lactate is entering the circulation. Given the 3.8 pKa of lactic acid, the vast majority of colonic D-lactate is in the anion form and its charge is balanced by Na+ and K+. The addition of sodium lactate to a beaker of saline or the circulation does not result in acidification since no hydrogen ion was added. Similarly, absorption of the massive quantities of colonic D-lactate would not produce acidosis unless the D-lactate was accompanied by a proton. The simplest explanation for how this might occur is provided by the previously discussed physiology of the colonic MCT transporter that co-transports a proton with a lactate. We estimated that at least 1500 mmol of lactate/day is absorbed by the SBS subject with D-lactic acidosis, which, of necessity, would be accompanied by 1500 meq of hydrogen ion. This quantity of acid would produce lethal acidosis if not for the release of a bicarbonate with the catabolism of each molecule of lactate.48 The plasma D-lactate concentration at any moment should reflect the H+ ion (absorbed with the D-lactate), that has yet to be neutralized via the catabolism of D-lactate. This line of reasoning indicates that it is fortuitous that D-lactate excretion in the urine is negligible in D-lactic lactic acidosis since urinary excretion of D-lactate would reduce the ability of the body to generate bicarbonate.
Neurological Symptoms
A wide array of neurological alterations have been observed in D-lactic acidosis including altered mental status (the most common), dysarthria, ataxia, gait disturbance, disorientation, nystagmus, and paranoid or hostile behavior.6,8 Controversy exists concerning the pathogenetic role of D-lactate in these neurological symptoms. The concept that D-lactate is not the toxic factor primarily rests on two observations: 1) there is a relatively poor correlation between the plasma concentration of D-lactate and neurological symptoms in humans; and 2) healthy subjects did not develop symptoms when their plasma D-lactate concentration was elevated to about 5 mM via a constant infusion of D-lactate for 2.5 hours. The concept that D-lactate is not the pathological agent requires that some yet to be identified, neurotoxic compound is absorbed from the colon roughly in concert with D-lactate. These arguments are countered by the observations of Abeysekara et al19 who carried out by far the most detailed experimental study of the relation between neurological symptoms and the concentrations of D-lactate in plasma and cerebrospinal fluid (CSF). Calves with a catheter chronically implanted in the cisterna magna for CSF sampling were infused over a six hour period with four different solutions: racemic acidified mixture of D- and L-lactate, L-lactate; HCl (pH 1.2) and saline. It was concluded that increases in L-lactate and reduction in pH played little role in the development of neurological symptoms, which were present to a marked degree only in the animals that received D-lactate. The plasma concentration of D-lactate continually increased over the 6 hour infusion with a peak concentration of about 35 mM. The concentration of D-lactate in CSF fluid lagged behind the plasma concentration. For example, at two hours the CSF concentration was only about 30% that of the plasma concentration of 17 mM. Of interest, four hours after cessation of the infusion, plasma D-lactate had fallen by 50% to 18 mM, while the CSF concentration remained almost constant – as a result, the CSF concentration exceeds that of plasma. Neurological abnormalities correlated much better with the concentration of D-lactate in CSF versus the plasma concentration. This finding provides an explanation for the poor correlation between symptoms and plasma D-lactate concentrations in clinical reports. Given the cycling of plasma D-lactate predicted by our simulations, plasma D-lactate concentrations would be expected to very poorly reflect the CSF D-lactate concentration (the biologically relevant value). The finding that animals did not demonstrate symptoms during the first two hours of the infusion when the plasma and CSF D-lactate concentrations were about 16 mM and 5 mM, respectively, provides an explanation for why no neurological symptoms were observed in the most challenging human study10 in which the maximal plasma concentration obtained at 2.5 hours averaged 5.2 mM. Based on the foregoing, there appears to be no convincing evidence that some factor other than D-lactate must be invoked to account for the neurological symptoms in D-lactic acidosis. The brain metabolizes D-lactate at a much slower rate than do most other tissues,49 which may explain why the symptoms induced by high plasma D-lactate are primarily neurological.
Disease Conditions with Minor D-Lactate Elevations
D-lactate concentrations have been measured in a variety of conditions based on the rationale that an elevated level might provide useful diagnostic information. Given the physiological focus of this paper, our discussion will concentrate on the possible mechanisms via which these conditions could produce elevated D-lactate concentrations rather than on the validity of the diagnostic claims.
Cai et al50 found that the plasma lactate concentration of patients with active Crohn’s disease (mean: 0.17 mM) was significantly greater than observed in patients with inactive disease (0.12 mM) or healthy controls (0.11 mM). Assuming normal clearance, maintenance of the approximately 0.05 mM increase in plasma concentration in active disease would require the absorption of D-lactate at a rate of about 0.03 mmol/min or 43 mmol/day. Modest increases in fecal D-lactate concentration have been observed in the feces of subjects with inflammatory disease, and it seems plausible that this elevated concentration in concert with increased colonic permeability in active disease could result in a D-lactate absorption rate of 0.03 mmol per minute.
Less readily explained are the increased plasma D-lactate concentrations observed in gut ischemia. For example, Murray et al51 found mean plasma D-lactate concentrations of about 0.053, 0.11, 0.11, and 0.35 mM, in controls and patients with acute abdomen, small bowel obstruction, and nine patients with mesenteric ischemia, respectively. While trivial by D-lactic acidosis standards, the 0.3 mM increase in plasma D-lactate in ischemic gut patients translates (assuming normal clearance) into a very sizable steady-state blood delivery rate of 0.18 mmol per min or 259 mmol/day (23.5 g/day) of D-lactate. Six of the patients with ischemia had involvement of only the small bowel. Since the small bowel flora is unlikely to generate high concentrations of D-lactate and the lack of blood supply would limit uptake from the ischemic segment, it is difficult to visualize how such large quantities of D-lactate could enter the circulation from the ischemic small bowel.
The diagnostic value of plasma D-lactate in acute appendicitis has been investigated in a number of studies, with the majority finding significantly elevated levels. An example of the surprising results of these studies is the data of Caglayan et al,51 who reported average plasma D-lactate concentrations for edematous, phlegmonous and perforated appendicitis of 0.72 mM, 0.72 mM and 0.42 mM, respectively, compared to 0.0033 mM for normal controls. Assuming that D-lactate clearance is normal, the 0.72 mM plasma concentration requires a steady-state rate of delivery of D-lactate to the plasma of 0.43 mM/minute or 619 mmol/day or 56 g/day, ie, the appendiceal bacteria would be utilizing about 25% of the 250 g daily carbohydrate ingestion for D-lactate production. This carbohydrate would have to be delivered to the obstructed appendix via the blood rather than the obstructed appendiceal lumen. We found no measurements of blood flow to the appendix, but a seemingly maximal estimate of 5% of the 500 mL/min superior mesenteric flow yields a flow rate of 25 mL/min. At a blood glucose concentration of 100 mg/dl, the rate of delivery of glucose to the appendix would be 25 mg/min, or 36 g/day, less than the requisite 56 g/day required to produce D-lactate. Given that the appendiceal bacteria are likely to produce more L-lactate than D-lactate, there clearly would be insufficient substrate to account for the lactate production, much less the other metabolic demands of the tissue. Filiz et al52 found that plasma D-lactate concentrations were normal in patients with a variety of acute abdominal problems, but consistently elevated in appendicitis. The plasma concentrations in appendicitis were about 50% of the magnitude reported by Caglayan, values that also would be unsustainable from the standpoint of substrate availability. Lacking sufficient D-lactate production, it is necessary postulate the seemingly far-fetched concept that localized appendiceal infection severely inhibits the body’s catabolism of D-lactate, whereas more extensive infection with ruptured appendix or other abdominal infections has no such effect.
Several studies have shown that measurement of the D-lactate concentration in various body fluid collections provides evidence of a bacterial infection. The largest study by Marcos et al53 correlated D-lactate concentrations with bacterial growth in 336 fluid collections (peritoneal, pleural, joint and CNS) and found that D-lactate generally was <0.02 mM in uninfected fluid and >0.05 mM in infected fluids. A >0.05 cut-off had a sensitivity of 0.96 and specificity of 0.88 for bacterial infection. A vast array of bacteria was cultured from the various fluids. The finding of an elevated D-lactate in 96% of these samples indicates that virtually any organism capable of infecting a body cavity can produce small quantities of D-lactate.
D-lactate received an unusual amount of attention in both the medical and lay press following a publication by Rao et al5 purporting to show that D-lactic acidosis plays a pathogenetic role in meal-induced “brain fogginess”. The authors measured urinary D-lactate concentration before and at 1 and 3 hours after ingestion of 75 g of glucose in water (which induced fogginess in 60% of patients and none of the controls). An increase over baseline in urinary D-lactate concentration was observed in each of the 38 subjects, although the mean peak values were very unimpressive: 0.20 mM and 0.27 mM in the controls and “foggy” subjects, respectively (upper limit of normal was 0.25 mM). Unfortunately, no plasma D-lactate measurements were obtained. As mentioned previously, relating urinary D-lactate concentrations to plasma concentrations is problematic. First, this measurement is a function of the concentration of the urine as well as the rate of excretion of D-lactate. Second, the relation of the urinary D-lactate measurement to the serum concentration (particularly at low plasma concentrations) is extremely sensitive to minor changes in the renal tubular reabsorption of D-lactate. Nevertheless, the authors construed their findings to suggest that meal induced “D-lactic acidosis” plays a role in brain fogginess. This article drew a good deal of criticism – not because of the unsupported claims concerning D-lactate, but because Rao et al attributed much of the brain fogginess to the ingestion of probiotics, a sacred cow of the irritable bowel syndrome aficionados.
Summary: What is Known and What Requires Additional Study
What is known about D-lactic acidosis is that in the occasional SBS subject malabsorption of carbohydrate results in the development of a D-lactic acid producing colonic flora, which, under appropriate conditions, result in an absorption rate of D-lactate sufficient to raise the plasma D-lactate to >3 mM. Some of the many unknowns include why it takes years after the short bowel is established to develop D-lactic acidosis, why only the occasional SBS patient is susceptible to episodes of acidosis, and in the susceptible patient, what induces the acute attack. Needed clinical data comparing SBS patients with and without acidosis episodes includes: 1) carefully recorded food diaries with regard to quantity and type of carbohydrate ingested (in vitro, sugars are more efficiently fermented to D-lactate than is complex carbohydrate). Anecdotally, a few patients have reported carbohydrate gorging immediately preceding an acute attack – more quantitative information would be useful; 2) volume/frequency of feces to determine if fecal output diminishes before an attack along with measurements of fecal D-lactate concentration and pH to determine if some combination of these variables leads to the excessive D-lactate absorption required to produce D-lactic acidosis. A variety of simple measurements would enhance our understanding of D-lactic acid physiology, particularly sequential plasma measurements throughout the day to determine the relationship of these values to food ingestion and defecation.
A crucial piece of missing data is whether patients with D-lactic acidosis catabolize plasma D-lactate at the normal rate. Measurement under baseline conditions (low, constant plasma D-lactate) would be relatively easy either by determining the steady-state plasma concentration during a constant infusion of D-lactate or the plasma concentration curve after a bolus infusion, which requires a simple pharmacokinetic model to determine catabolism. If diminished metabolism is observed, catabolism should be measured at intervals after the short bowel is established to determine if a gradual decrement in this catabolism accounts for the long duration between surgical resection D-lactic acidosis and measurements of D-lactate clearance during an acute attack also are needed. Studies utilizing an infusion of 14C-L-lactate have been used to study the kinetics of L-lactate in L-lactic acidosis and studies with labelled D-lactate could be utilized in D-lactic acidosis. More indirectly, catabolic rate could be estimated from the rate of decline of plasma D-lactate concentration if ongoing input from the gut were eliminated via rapid purging with colonoscopy preparative solution, a manipulation likely to be useful therapeutically as well as experimentally.
Conclusion
Relative to the thousands of physiological studies of L-lactate, D-lactate clearly is the orphan enantiomer. Only a handful of studies have been devoted to the study of the physiology of D-lactate. As a result, present knowledge has only marginally advanced since Dunlop and Hammond1 published their seminal paper over 50 years ago. In the present paper, we have reviewed the available physiological data and attempted to quantify the various factors that influence D-lactate homeostasis. We believe that this application of numerical values to existing qualitative concepts provides new insights into D-lactate physiology, and, more importantly illustrates the many areas that require additional study.
Disclosure
The authors report no conflicts of interest in this work.
References
1. Dunlop RH, Hammond PB. D-lactic acidosis of ruminants. Ann N Y Acad Sci. 1965;119(3):1109–1132. doi:10.1111/j.1749-6632.1965.tb47466.x
2. Lorenz I, Gentile A, Klee W. Investigations of D-lactate metabolism and the clinical signs of D-lactataemia in calves. Vet Rec. 2005;156(13):412–415. doi:10.1136/vr.156.13.412
3. Oh MS, Phelps KR, Traube M, Barbosa-Saldivar JL, Boxhill C, Carroll HJ. D-lactic acidosis in a man with the short-bowel syndrome. N Engl J Med. 1979;301(5):249–252. doi:10.1056/NEJM197908023010505
4. Bianchetti D, Amelio GS, Lava SAG, et al. D-lactic acidosis in humans: systematic literature review. Pediatr Nephrol. 2018;33(4):673–681. doi:10.1007/s00467-017-3844-8
5. Rao SSC, Yu S, Tetangco EP, and Yan Y. Probiotics can cause D-lactic acidosis and brain fogginess: reply to Quigley et al. Clin Transl Gastroenterol. 2018;9:1–2. doi:10.1038/s41424-018-0077-5
6. Ewaschuk JB, Naylor JM, Zello GA. D-lactate in human and ruminant metabolism. J Nutr. 2005;135(7):1619–1625. doi:10.1093/jn/135.7.1619
7. Petersen C. D-lactic acidosis. Nutr Clin Pract. 2005;20(6):634–645. doi:10.1177/0115426505020006634
8. Uribarri J, Oh MS, Carroll HJ. D-lactic acidosis: a review of clinical presentation, biochemical features, and pathophysiologic mechanisms. Medicine. 1998;77(2):73–82. doi:10.1097/00005792-199803000-00001
9. Ohmori S, Ohsaki Y, Akagi S, Kondoh C, Kawase M, Nagai T. D-Lactate is present in much larger amount than L-Lactate in Cephalopods and Gastropods. Zoolog Sci. 1997;14(3):429–434. doi:10.2108/zsj.14.429
10. Oh MS, Uribarri J, Alveranga D, Lazar I, Bazilinski N, Carroll HJ. Metabolic utilization and renal handling of D-lactate in men. Metabolism. 1985;34(7):621–625. doi:10.1016/0026-0495(85)90088-5
11. Tubbs PK, Greville GD. The oxidation of d-α-hydroxy acids in animal tissues. Biochem J. 1961;81:104–114. doi:10.1042/bj0810104
12. Drabkin M, Yogev Y, Zeller L, et al. Hyperuricemia and gout caused by missense mutation in d-lactate dehydrogenase. J Clin Invest. 2019;129(12):5163–5168. doi:10.1172/JCI129057
13. Monroe GR, van Eerde AM, Tessadori F, et al. Identification of human D lactate dehydrogenase deficiency. Nat Commun. 2019;10(1):1477. doi:10.1038/s41467-019-09458-6
14. de Bari L, Atlante A, Guaragnella N, Principato G, Passarella S. D-Lactate transport and metabolism in rat liver mitochondria. Biochem J. 2002;365(Pt 2):391–403. doi:10.1042/bj20020139
15. Bongaerts G, Tolboom J, Naber T, Bakkeren J, Severijnen R, Willems H. D-lactic acidemia and aciduria in pediatric and adult patients with short bowel syndrome. Clin Chem. 1995;41(1):107–110. doi:10.1093/clinchem/41.1.107
16. Narula RK, El Shafei A, Ramaiah D, Schmitz PG. D-lactic acidosis 23 years after jejuno-ileal bypass. Am J Kidney Dis. 2000;36(2):E9. doi:10.1053/ajkd.2000.9005
17. Kuze S, Naruse T, Yamazaki M, Hirota K, Ito Y, Miyahara T. Effects of sodium L-lactate and sodium racemic lactate on intraoperative acid-base status. Anesth Analg. 1992;75(5):702–707. doi:10.1213/00000539-199211000-00008
18. Connor H, Woods HF, Ledingham JG. Comparison of the kinetics and utilisation of D(-)-and L(+)-sodium lactate in normal man. Ann Nutr Metab. 1983;27(6):481–487. doi:10.1159/000176723
19. Abeysekara S, Naylor JM, Wassef AW, Isak U, Zello GA. D-Lactic acid-induced neurotoxicity in a calf model. Am J Physiol Endocrinol Metab. 2007;293(2):E558–565. doi:10.1152/ajpendo.00063.2007
20. Brandt RB, Waters MG, Rispler MJ, Kline ES. D- and L-lactate catabolism to CO2 in rat tissues. Proc Soc Exp Biol Med. 1984;175(3):328–335. doi:10.3181/00379727-175-41803
21. Fine A. Metabolism of D-lactate in the dog and in man. Perit Dial Int. 1989;9(2):99–101. doi:10.1177/089686088900900204
22. Levitt DG. Quantitation of small intestinal permeability during normal human drug absorption. BMC Pharmacol Toxicol. 2013;14:34. doi:10.1186/2050-6511-14-34
23. Levitt DG. PKQuest_Java: free, interactive physiologically based pharmacokinetic software package and tutorial. BMC Res Notes. 2009;2:158. doi:10.1186/1756-0500-2-158
24. Weemaes M, Hiele M, Vermeersch P. High anion gap metabolic acidosis caused by D-lactate: mind the time of blood collection. Biochem Med. 2020;30(1):011001. doi:10.11613/BM.2020.011001
25. Ravitch MM, Brolin RE. The price of weight loss by jejunoileal shunt. Ann Surg. 1979;190(3):382–391. doi:10.1097/00000658-197909000-00014
26. O’Keefe SJ, Buchman AL, Fishbein TM, Jeejeebhoy KN, Jeppesen PB, Shaffer J. Short bowel syndrome and intestinal failure: consensus definitions and overview. Clin Gastroenterol Hepatol. 2006;4(1):6–10. doi:10.1016/j.cgh.2005.10.002
27. Thurn JR, Pierpont GL, Ludvigsen CW, Eckfeldt JH. D-lactate encephalopathy. Am J Med. 1985;79(6):717–721. doi:10.1016/0002-9343(85)90522-4
28. Mayeur C, Gratadoux JJ, Bridonneau C, et al. Faecal D/L lactate ratio is a metabolic signature of microbiota imbalance in patients with short bowel syndrome. PLoS One. 2013;8(1):e54335. doi:10.1371/journal.pone.0054335
29. Hove H, Mortensen PB. Colonic lactate metabolism and D-lactic acidosis. Dig Dis Sci. 1995;40(2):320–330. doi:10.1007/BF02065417
30. Halestrap AP, Price NT. The proton-linked monocarboxylate transporter (MCT) family: structure, function and regulation. Biochem J. 1999;343(Pt 2):281–299. doi:10.1042/bj3430281
31. Ding Z, Xu Y. Lactic acid is absorbed from the small intestine of sheep. J Exp Zool a Comp Exp Biol. 2003;295(1):29–36. doi:10.1002/jez.a.10212
32. de Bari L, Atlante A, Armeni T, Kalapos MP. Synthesis and metabolism of methylglyoxal, S-D-lactoylglutathione and D-lactate in cancer and Alzheimer’s disease. Exploring the crossroad of eternal youth and premature aging. Ageing Res Rev. 2019;53:100915. doi:10.1016/j.arr.2019.100915
33. Christopher MM, Broussard JD, Fallin CW, Drost NJ, Peterson ME. Increased serum D-lactate associated with diabetic ketoacidosis. Metabolism. 1995;44(3):287–290. doi:10.1016/0026-0495(95)90156-6
34. Lu J, Zello GA, Randell E, Adeli K, Krahn J, Meng QH. Closing the anion gap: contribution of D-lactate to diabetic ketoacidosis. Clin Chim Acta. 2011;412(3–4):286–291. doi:10.1016/j.cca.2010.10.020
35. Christopher MM, Eckfeldt JH, Eaton JW. Propylene glycol ingestion causes D-lactic acidosis. Lab Invest. 1990;62(1):114–118.
36. Jorens PG, Demey HE, Schepens PJ, et al. Unusual D-lactic acid acidosis from propylene glycol metabolism in overdose. J Toxicol Clin Toxicol. 2004;42(2):163–169. doi:10.1081/CLT-120030942
37. Fowles JR, Banton MI, Pottenger LH. A toxicological review of the propylene glycols. Crit Rev Toxicol. 2013;43(4):363–390. doi:10.3109/10408444.2013.792328
38. Kelner MJ, Bailey DN. Propylene glycol as a cause of lactic acidosis. J Anal Toxicol. 1985;9(1):40–42. doi:10.1093/jat/9.1.40
39. Shapiro F, Silanikove N. Rapid and accurate determination of D- and L-lactate, lactose and galactose by enzymatic reactions coupled to formation of a fluorochromophore. Food Chem. 2010;119:
40. de Vrese M, Barth CA. Postprandial plasma D-lactate concentrations after yogurt ingestion. Z Ernahrungswiss. 1991;30(2):131–137. doi:10.1007/BF01610068
41. Jin Q, Li L, Moon JS, et al. Reduction of D-lactate content in sauerkraut using starter cultures of recombinant Leuconostoc mesenteroides expressing the ldhL gene. J Biosci Bioeng. 2016;121(5):479–483. doi:10.1016/j.jbiosc.2015.09.007
42. Yasuda T, Ozawa S, Shiba C, et al. D-lactate metabolism in patients with chronic renal failure undergoing CAPD. Nephron. 1993;63(4):416–422. doi:10.1159/000187245
43. Mayo clinic laboratories.
44. Nghiem CH, Bui HD, Chaney RH. An unusual cause of D-lactic acidosis. West J Med. 1988;148(3):332–334.
45. Tubbs PK. Effects of inhibitors on mitochondrial d-α-hydroxy acid dehydrogenase. Biochem J. 1962;82:36–42. doi:10.1042/bj0820036
46. Costello J, Landwehr DM. Determination of oxalate concentration in blood. Clin Chem. 1988;34(8):1540–1544. doi:10.1093/clinchem/34.8.1540
47. Porcelli AM, Ghelli A, Zanna C, Pinton P, Rizzuto R, Rugolo M. pH difference across the outer mitochondrial membrane measured with a green fluorescent protein mutant. Biochem Biophys Res Commun. 2005;326(4):799–804. doi:10.1016/j.bbrc.2004.11.105
48. White SA, Goldhill DR. Is Hartmann’s the solution? Anaesthesia. 1997;52(5):422–427. doi:10.1111/j.1365-2044.1997.090-az0082.x
49. Ling B, Peng F, Alcorn J, Lohmann K, Bandy B, Zello GA. D-Lactate altered mitochondrial energy production in rat brain and heart but not liver. Nutr Metab. 2012;9(1):6. doi:10.1186/1743-7075-9-6
50. Cai J, Chen H, Weng M, Jiang S, Gao J. Diagnostic and clinical significance of serum levels of D-lactate and diamine oxidase in patients with Crohn’s disease. Gastroenterol Res Pract. 2019;2019:8536952. doi:10.1155/2019/8536952
51. Caglayan F, Cakmak M, Caglayan O, Cavusoglu T. Plasma D-lactate levels in diagnosis of appendicitis. J Invest Surg. 2003;16(4):233–237. doi:10.1080/08941930390215033
52. Filiz AI, Aladag H, Akin ML, et al. The role of d-lactate in differential diagnosis of acute appendicitis. J Invest Surg. 2010;23(4):218–223. doi:10.3109/08941931003596877
53. Marcos MA, Vila J, Gratacos J, Brancos MA, Jimenez de Anta MT. Determination of D-lactate concentration for rapid diagnosis of bacterial infections of body fluids. Eur J Clin Microbiol Infect Dis. 1991;10(11):966–969. doi:10.1007/BF02005455
54. Kuze S, Naruse T, Ito Y, Nakamaru K. Comparative study of intravenous administration of Ringer’s lactate, Ringer’s acetate and 5% glucose containing these Ringer’s solutions in human being. J Anesth. 1990;4(2):155–161. doi:10.1007/s0054000040155
 © 2020 The Author(s). This work is published and licensed by Dove Medical Press Limited. The
full terms of this license are available at https://www.dovepress.com/terms
and incorporate the Creative Commons Attribution
- Non Commercial (unported, 3.0) License.
By accessing the work you hereby accept the Terms. Non-commercial uses of the work are permitted
without any further permission from Dove Medical Press Limited, provided the work is properly
attributed. For permission for commercial use of this work, please see paragraphs 4.2 and 5 of our Terms.
© 2020 The Author(s). This work is published and licensed by Dove Medical Press Limited. The
full terms of this license are available at https://www.dovepress.com/terms
and incorporate the Creative Commons Attribution
- Non Commercial (unported, 3.0) License.
By accessing the work you hereby accept the Terms. Non-commercial uses of the work are permitted
without any further permission from Dove Medical Press Limited, provided the work is properly
attributed. For permission for commercial use of this work, please see paragraphs 4.2 and 5 of our Terms.