Back to Journals » Clinical Ophthalmology » Volume 13
Quantitative Comparison Of Microvascular Metrics On Three Optical Coherence Tomography Angiography Devices In Chorioretinal Disease
Authors Lu Y, Wang JC, Zeng R, Katz R ![]() , Vavvas DG, Miller JW, Miller JB
, Vavvas DG, Miller JW, Miller JB ![]()
Received 12 May 2019
Accepted for publication 3 September 2019
Published 22 October 2019 Volume 2019:13 Pages 2063—2069
DOI https://doi.org/10.2147/OPTH.S215322
Checked for plagiarism Yes
Review by Single anonymous peer review
Peer reviewer comments 2
Editor who approved publication: Dr Scott Fraser
Video abstract presented by Yifan Lu.
Views: 254
Yifan Lu,1,2,* Jay C Wang,1–3,* Rebecca Zeng,2 Raviv Katz,2 Demetrios G Vavvas,2,3 Joan W Miller,2,3 John B Miller1–3
1Department of Ophthalmology, Harvard Medical School, Boston, Ma, USA; 2Harvard Retinal Imaging Laboratory, Massachusetts Eye and Ear, Boston, Ma, USA; 3Retina Service, Massachusetts Eye and Ear, Department of Ophthalmology, Harvard Medical School, Boston, MA, USA
*These authors contributed equally to this work
Correspondence: John B Miller
Retina Service, Massachusetts Eye and Ear, Department of Ophthalmology, Harvard Medical School, 243 Charles St, Boston, MA 02114, USA
Tel +1 617 573 3750
Fax +1 617 573 3698
Email [email protected]
Purpose: Optical coherence tomography angiography (OCT-A) has emerged as a novel tool for the non-invasive imaging and evaluation of the retinal microvasculature. There is little existing literature that compares OCT-A microvasculature metrics across different OCT-A devices in chorioretinal diseases. Herein, we examined these metrics on three available OCT-A platforms.
Patients and methods: All subjects were scanned on each of three OCT-A devices: Optovue Avanti Angiovue, Topcon DRI-OCT Triton Swept-Source OCT, and Zeiss Cirrus 5000-HD-OCT Angioplex. Two investigators independently measured foveal avascular zone (FAZ) area. Superficial capillary plexus (SCP) and deep capillary plexus (DCP) vessel densities (VD) were calculated from binarized images with ImageJ software. Image quality across devices was qualitatively compared. Interclass correlation coefficient (ICC), Bland-Altman analysis, repeated measures ANOVA, and post-hoc tests were performed for statistical analysis.
Results: Thirteen eyes of seven patients with chorioretinal diagnoses were reviewed. ICC for FAZ measurement was 0.95. There was no significant difference in FAZ area across the three devices (p= 0.792). There was a significant difference in the SCP VD between the OCT-A devices (Triton 0.344 ± 0.013, Angiovue 0.323 ± 0.013, Angioplex 0.367 ± 0.014, p < 0.05). Significantly greater DCP VD was observed with Angioplex (0.385 ± 0.010) in comparison to both Triton (0.331 ± 0.009) and Angiovue (0.341 ± 0.020). A comparison of image quality revealed that Angiovue gives the highest quality, followed by Angioplex and Triton.
Conclusion: Core macular microvasculature metrics are now readily accessible on a variety of available OCT-A devices. While the FAZ can be reliably measured across all three devices in this study, there were significant differences for the vessel density in both the SCP and DCP. As a result, clinicians should be careful when comparing microvasculature metrics across different devices when using patient data in multicenter research investigations and clinical trials.
Keywords: OCTA, Angiovue, Angioplex, Triton, Zeiss, Optovue
Introduction
Optical coherence tomography angiography (OCT-A) has recently emerged as a novel tool for imaging and evaluating the retinal microvasculature. The mechanism behind OCT-A involves performing multiple rapid B-scans and analyzing the variations in intensity and reflectivity of the signal caused by red blood cell movement to create flow maps of the microvasculature.1,2 OCT-A is considered to be an adjunct to traditional imaging modalities, such as fluorescein angiography (FA), given its non-invasive nature and ability to produce high-resolution images of the vessels’ individual layers, including the superficial, deep and choroidal capillary plexuses.3 Currently, the most common clinical applications of OCT-A involve the evaluation of chorioretinal vascular diseases, such as diabetic retinopathy (DR), age-related macular degeneration (AMD), retinal vein occlusion (RVO), macular telangiectasia (MacTel) and other causes of choroidal neovascularization.4–7 OCT-A has also been increasingly utilized in the diagnosis of optic neuropathies and glaucoma.8–10
Currently, several OCT-A devices are commercially available that employ unique analytic techniques. Though previous research has shown the clinical applications of OCT-A in detecting various chorioretinal diseases,1,5 these studies primarily focus on one OCT-A device and thus lack a comparison across multiple devices. Additionally, although few publications exist that compare OCT-A devices, a lack of standardization in study designs, data analysis, and artifacts precludes reaching a consensus.11 Relationships of vascular metrics across different devices will likely be important for large clinical trials occurring at multiple centers with a variety of OCT-A platforms.
Previous comparison studies have established that differences in foveal avascular zone (FAZ) area and vessel density (VD) are parameters of particular clinical significance, as they are abnormal in retinal vascular disease.3,11,12 Thus, the aim of this study was to quantitatively compare FAZ and VD metrics across the following three OCT-A platforms at a single center.
Methods
Patient Selection
This study was a retrospective review of images from three OCT-A devices that was approved and carried out in accordance with the Institutional Review Board (IRB) guidelines set forth by the Massachusetts Eye and Ear Human Studies Committee. This study adhered to the tenets of the Declaration of Helsinki. A written informed consent was obtained from each study subject. All patients were imaged on the following three devices: Optovue RTVue-XR (Optovue Inc, Fremont, California, USA), Topcon DRI-OCT Triton Swept-Source OCT (Topcon, Japan), and Zeiss Cirrus 5000-HD-OCT Angioplex (Zeiss Meditec. Inc, Germany) (Table 1).
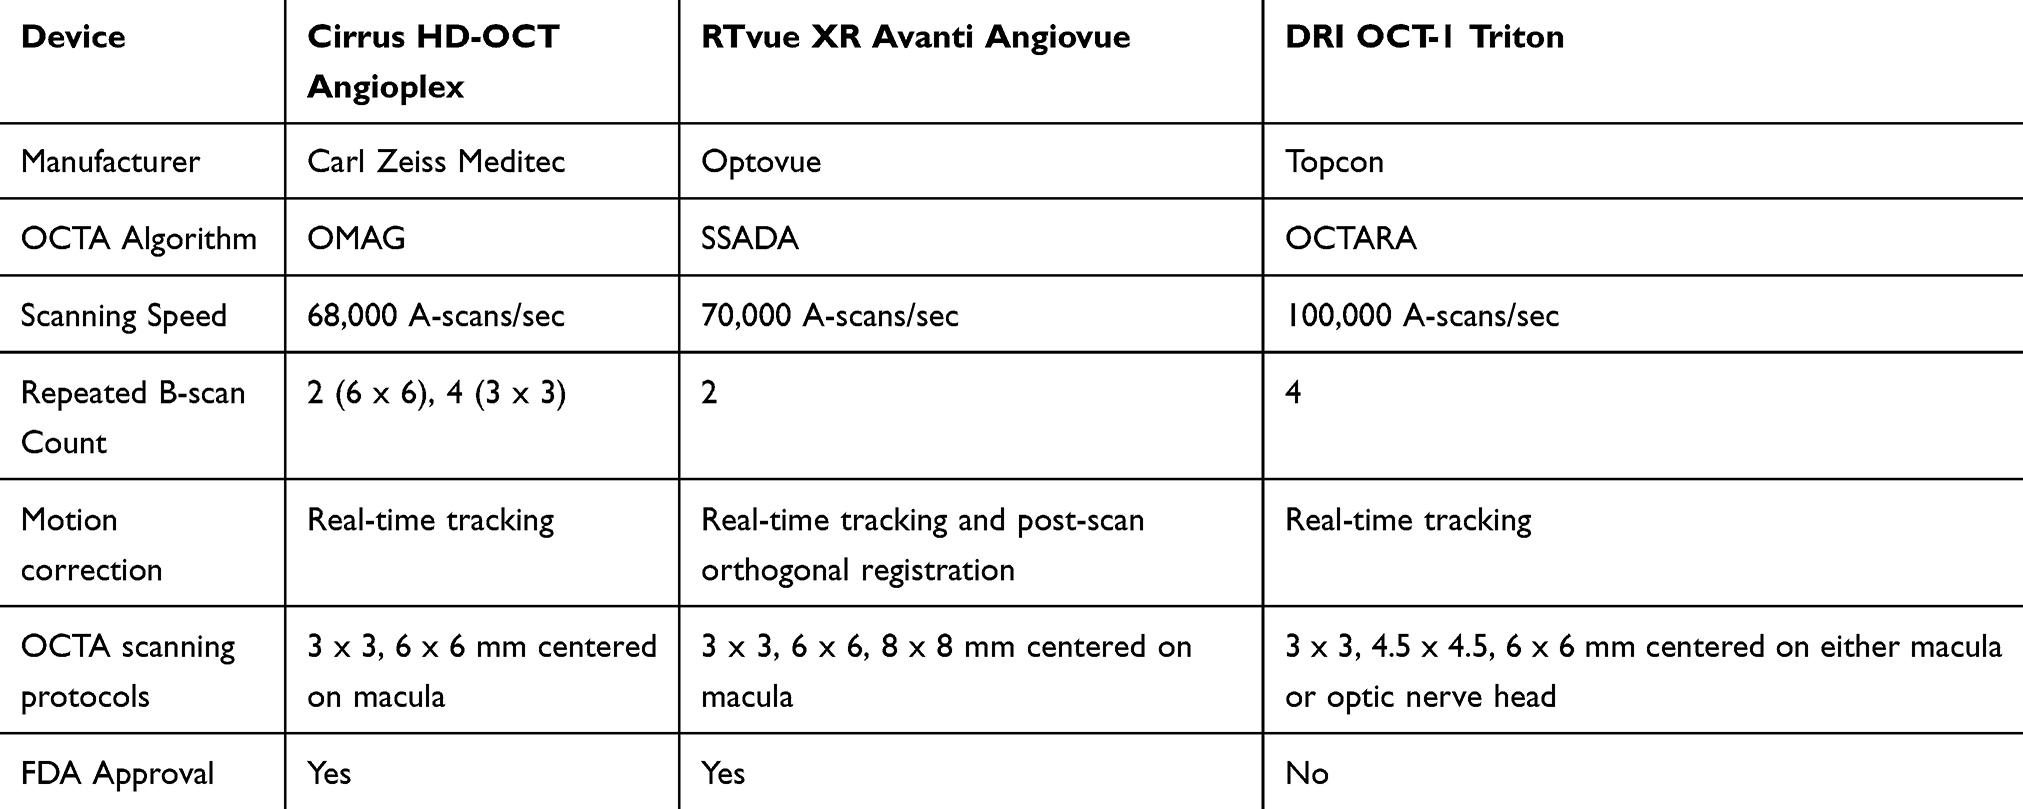 |
Table 1 Comparison Of 3 OCT-A Devices |
Thirteen eyes from seven patients at the Massachusetts Eye and Ear (MEE) Retina Service were included in the study. The subjects had a diagnosis of either age-related macular degeneration (AMD), aneurismal type 1 neovascularization (Aneurismal Type 1 NV), central serous retinopathy (CSR), MacTel, or choroidal neovascular membranes (CNVM) (Table 2).13–16 The exclusion criteria included patients with any history of diabetes mellitus or chronic kidney disease.
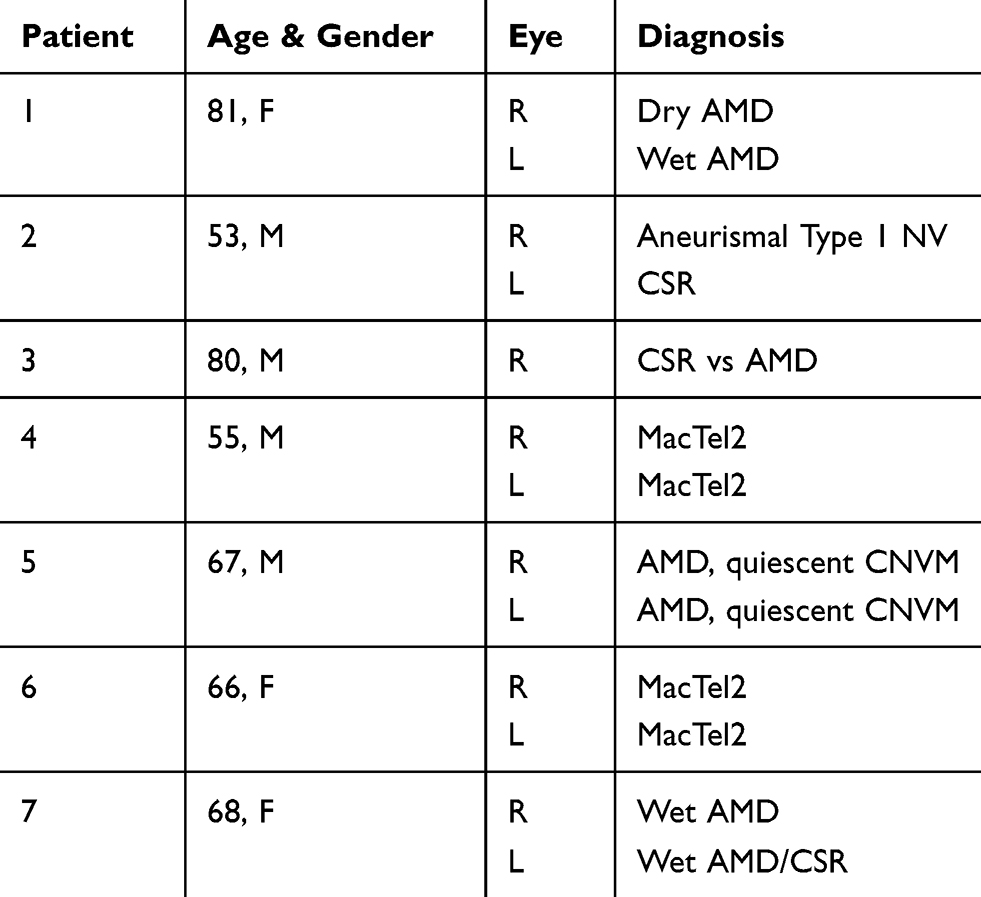 |
Table 2 Patient Demographic Information And Chorioretinal Disease Diagnosis |
Imaging
Subjects were scanned on each of the following three OCT-A devices: Optovue Avanti Angiovue, Topcon DRI-OCT Triton Swept-Source OCT, and Zeiss Cirrus 5000-HD-OCT Angioplex. For each patient, pupillary dilation was completed and the OCT-A imaging on each device was performed using a 3x3mm2 or a 6x6mm2 volume scan pattern centered on the fovea. Furthermore, an image of the superficial capillary plexus (SCP) and deep capillary plexus (DCP) was generated for each eye using automated layer segmentation, corrected by manual readjustments of the segmentation lines (Figure 1).
Imaging processing was performed using ImageJ software (National Institutes of Health, Maryland, USA). Two investigators (YL, JCW) separately and independently measured FAZ area at the SCP. The FAZ border was manually outlined. The surface area was measured in square pixels and was converted to square millimeters using the formula: FAZ area (mm2) = FAZ area (pixel2)/total surface area (pixel2) * total surface area (mm2). In addition, SCP and DCP images were binarized using the Niblack automated local thresholding method (Figure 2). VD is defined as the percentage of total area that is occupied by blood vessels.17 For each SCP and DCP image, the total surface area occupied by blood vessels was measured by the ImageJ software, while VD was the percentage calculated by dividing the total surface area of the image.
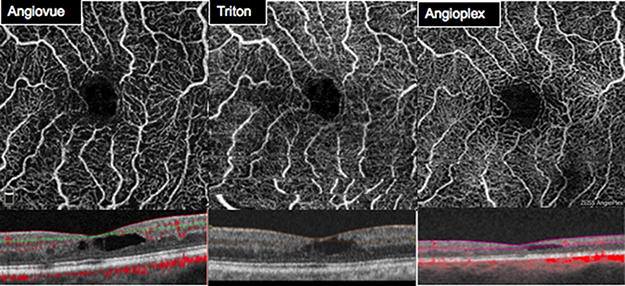 |
Figure 1 SCP images and segmentation using Optovue RTVue-XR, Topcon DRI-OCT Triton Swept-Source OCT, and Zeiss Cirrus 5000-HD-OCT Angioplex. |
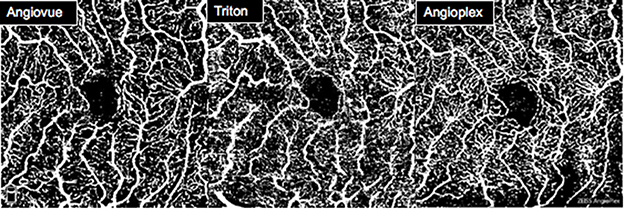 |
Figure 2 SCP images after binarization using the Niblack automated local thresholding method. |
Statistical Analysis
The JASP software (University of Amsterdam, Amsterdam, Noord-Holland) was utilized for statistical analysis. To analyze for differences among the individual devices, a repeated measures ANOVA and a post-hoc test were performed. In addition, interclass correlation coefficient (ICC) and Bland-Altman plots were employed to measure the repeatability of the data. P-values were Bonferroni corrected and a value of less than 0.05 was considered to be significant.
Results
Thirteen eyes from seven patients with a history of either AMD, CSR, MacTel, Aneurismal Type 1 NV, or CNVM were included in the study (Table 2). The mean age was 67 ± 11 years old, while the gender distribution was three females and four males. The ethnicity of all included individuals was Caucasian.
The mean SCP FAZ area for the Triton device was 0.161 ± 0.103 mm2, Angiovue device was 0.161 ± 0.106 mm2, and for the Angioplex device was 0.164 ± 0.100 mm2 The ICC for the FAZ area measurements was found to be 0.95 (Table 3). Comparison of SCP FAZ area measurements revealed no significant differences across the devices (p = 0.792). Bland-Altman plots showed agreement between the two investigators and three devices measuring the FAZ area (Figure 3).
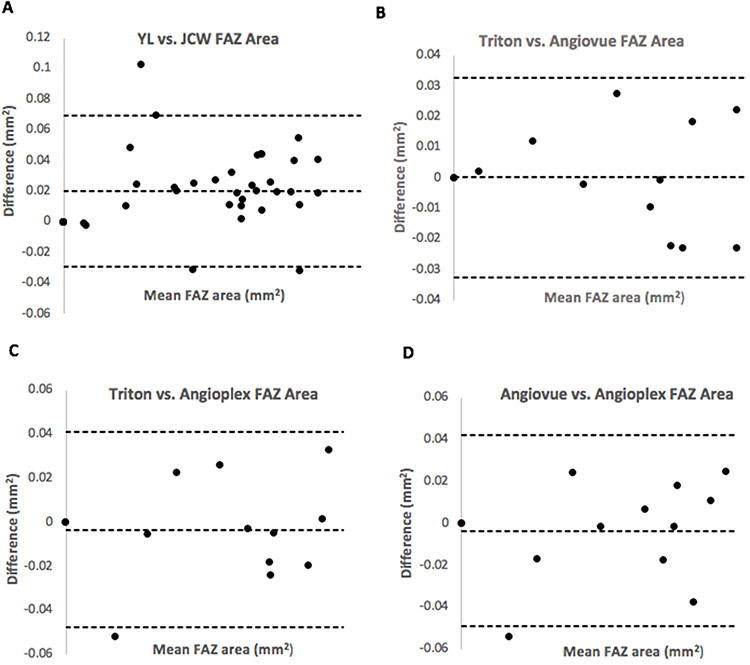 |
Figure 3 (A) Bland-Altman plot showed agreement between the two investigators for the SCP FAZ area measurements. (B–D) Bland-Altman plot showing the level of agreement between FAZ area measurements for devices. (B) Triton vs Angiovue. (C) Triton vs Angioplex. (D) Angiovue vs Angioplex. |
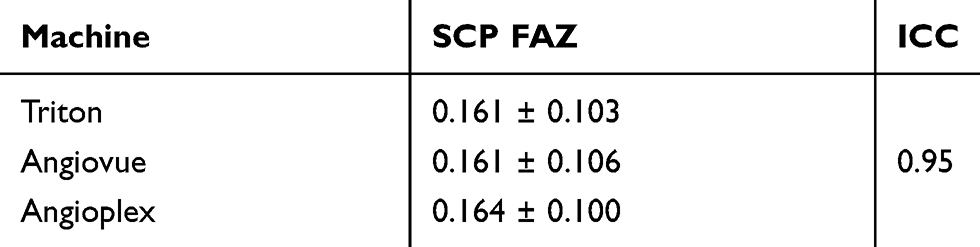 |
Table 3 SCP FAZ Measurements And ICC |
The mean VD for the Angiovue device was 0.307 ± 0.013 at the SCP and 0.332 ± 0.025 at the DCP, for the Triton device was 0.340 ± 0.014 at the SCP and 0.334 ± 0.009 at the DCP, and for the Angioplex device was 0.352 ± 0.014 at the SCP and 0.364 ± 0.012 at the DCP (Table 4). Repeated measures ANOVA comparing the three devices revealed that a significant difference existed. Paired comparisons via post-hoc tests indicated a significant difference in the SCP VD between all of the devices: Triton 0.340 ± 0.014, Angiovue 0.307 ± 0.013, Angioplex 0.352 ± 0.014, p < 0.05. For the DCP, a significantly greater VD was observed with Angioplex (0.364 ± 0.012, p < 0.05) in comparison to both Triton (0.334 ± 0.009) and Angiovue (0.332 ± 0.025) (Table 5).
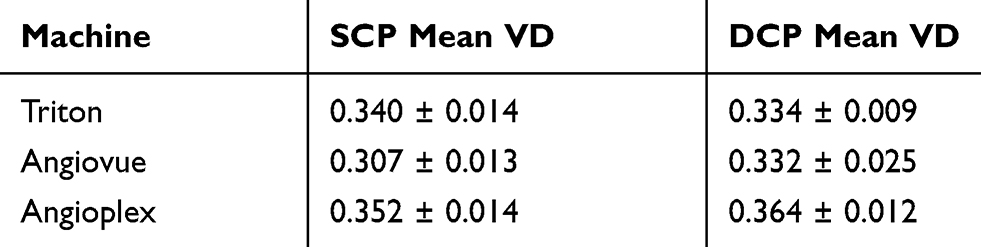 |
Table 4 SCP And DCP VD Measurements With Respect To Individual Devices From Binarized Images Using The Niblack Automated Local Thresholding Method |
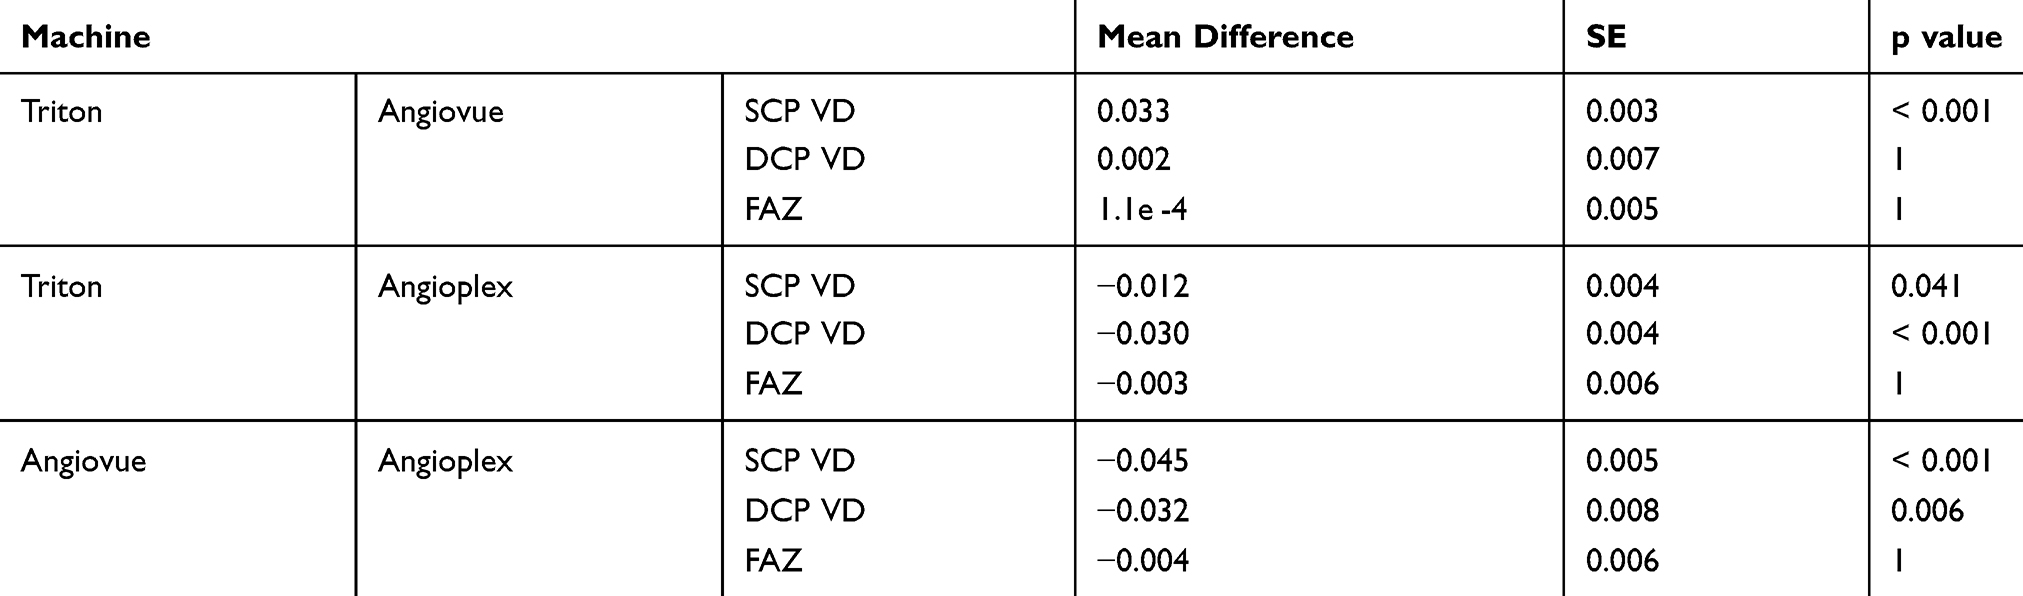 |
Table 5 Post Hoc Comparisons Of SCP VD, DCP VD, And FAZ |
Discussion
OCT-A is a nascent non-invasive technology that has been increasingly incorporated into clinical ophthalmology. In particular, this imaging modality offers a novel field of study given the utility of OCT-A devices in detecting various retinal and choroidal diseases.18 There are several core macular microvasculature metrics now readily accessible on a variety of available OCT-A devices. Though previous investigators have compared the use of different combinations of OCT-A metrics, we found no existing publications that compare these three included OCT-A devices in chorioretinal diseases.3,11,18,19
As FAZ and VD have been shown to be abnormal in retinal vascular disease, this study focuses on comparing these two metrics in retinopathies across three OCT-A devices (Angiovue, Triton, and Angioplex).12 The results of this study indicate that while FAZ area could be reliably measured across all three devices, statistically significant differences were found in the VD metric for both the SCP and DCP layers, especially for the Angioplex device. Our findings regarding FAZ area is consistent with Chung et al who found no significant difference in FAZ area measurements between Angiovue and Angioplex.20 Other comparison studies involving devices not included in this study did not demonstrate consistency in FAZ area measurements across devices. While Al-Sheikh et al revealed good repeatability for FAZ area between machines, Mihailovic et al and Corvi et al found significantly different FAZ areas across devices.11,18,19 In their study evaluating twenty eyes with diabetic retinopathy, Chung et al suggested that there was no significant difference in the VD between Angioplex and Angiovue.20 However, a study conducted by Munk et al, which imaged nineteen healthy subjects on four OCT-A machines (Angiovue, Triton, Angioplex, and Spectralis), revealed that Angioplex offers the best preservation of vessel continuity in both SCP and DCP.3 In particular, this finding may explain the significantly greater VD observed with Angioplex when compared to Angiovue or Triton. Discrepancies in VD between devices may also be related to differences in automated segmentation of the superficial and deep capillary layers. In addition, due to the lack of standardization in image processing methods and binarization algorithms, VD between studies unfortunately cannot be compared.
The presented study does have limitations that should be considered. One limitation is that all study subjects had chorioretinal diseases which could have affected the image quality of the retinal vasculature. This limitation would not be present if only healthy eyes were included, but the study results would be less applicable to OCT-A use in everyday retina practice or a clinical trial investigating retinal diseases. Secondly, the current study had a small sample size of thirteen eyes and not all scans were captured on the same day. As a result, a larger prospective study is needed to validate the conclusions of this pilot study.
In conclusion, the quantitative comparisons of the Angiovue, Triton and Angioplex OCT-A devices showed strong consistency for FAZ area measurements. However, significant differences were found in the VD measurements across devices. Clinicians should exercise caution when comparing SCP and DCP VD metrics among devices.
Acknowledgment
Parts of this manuscript were presented at the 3rd Annual Swept Source OCT and OCT Angiography Conference, 2019 in Sanibel Harbor, Florida.
Disclosure
Dr Joan W Miller reports personal fees from Amgen, Inc., KalVista Pharmaceuticals, Ltd., Alcon Research Institute, Genentech/Roche, Bausch + Lomb, Sunovion, Valeant Pharmaceuticals/Massachusetts Eye and Ear, ONL Therapeutics, LLC, and grants from Lowy Medical Research Institute, Ltd., outside the submitted work. In addition, Dr Miller has patents US 5,798,349, US 6,225,303, US 6,610,679, CA 2,185,644, and CA 2,536,069 with royalties paid to Valeant Pharmaceuticals, a patent US 7,811,832 with royalties paid to ONL Therapeutics, a patent for Metabolomics for Biomarkers of AMD pending. Dr John B Miller reports personal fees from Heidelberg, Zeiss, Allergan, and Alcon, outside the submitted work. The authors report no other conflicts of interest in this work.
References
1. Matsunaga DR, Yi JJ, De Koo LO, et al. Optical coherence tomography angiography of diabetic retinopathy in human subjects. Ophthalmic Surg Lasers Imaging Retina. 2015;46(8):796–805. doi:10.3928/23258160-20150909-03
2. Spaide RF, Klancnik JM
3. Munk MR, Giannakaki-Zimmermann H, Berger L, et al. OCT-angiography: A qualitative and quantitative comparison of 4 OCT-A devices. PLoS One. 2017;12(5):1–14. doi:10.1371/journal.pone.0177059
4. Waheed NK, Moult EM, Fujimoto JG, et al. Optical coherence tomography angiography of dry age-related macular degeneration. Dev Ophthalmol. 2016;56:91–100. doi:10.1159/000442784
5. Kashani AH, Lee SY, Moshfeghi A, et al. Optical coherence tomography angiography of retinal venous occlusion. Retina. 2015;35(11):2323–2331. doi:10.1097/IAE.0000000000000811
6. Spaide RF, Klancnik JM
7. Wang JC, McKay KM, Sood AB, et al. Comparison of choroidal neovascularization secondary to white dot syndromes and age-related macular degeneration by using optical coherence tomography angiography. Clin Ophthalmol. 2018;13:95–105. doi:10.2147/OPTH.S185468
8. Gaier ED, Gilbert AL, Cestari DM, Miller JB. Optical coherence tomographic angiography identifies peripapillary microvascular dilation and focal non-perfusion in giant cell arteriris. Br J Ophthalmol. 2018;102(8):1141–1146. doi:10.1136/bjophthalmol-2017-310718
9. Gaier ED, Wang M, Gilbert AL, et al. Quantitative analysis of optical coherence tomographic angiography (OCT-A) in patients with non-arteritic anterior ischemic optic neuropathy (NAION) corresponds to visual function. PLoS One. 2018;13(6):e0199793. doi:10.1371/journal.pone.0199793
10. Schwartz SG, Flynn HW
11. Al-Sheikh M, Falavarjani KG, Tepelus TC, et al. Quantitative comparison of swept-source and spectral-domain OCT angiography in healthy eyes. Ophthalmic Surg Lasers Imaging Retina. 2017;48(5):385–391. doi:10.3928/23258160-20170428-04
12. Falavarjani KG, Shenazandi H, Naseri D, et al. Foveal avascular zone and vessel density in healthy subjects: an optical coherence tomography angiography study. J Ophthalmic Vis Res. 2018;13(3):260–265. doi:10.4103/jovr.jovr_173_17
13. Yannuzzi LA, Sorenson J, Spaide RF, Lipson B. Do we need a new classification for choroidal neovascularization in age-related macular degeneration? Retina. 2010;30:1333–1349. doi:10.1097/IAE.0b013e3181e7976b
14. Nakashizuka H, Mitsumata M, Okisaka S, et al. Idiopathic polypoidal choroidal vasculopathy (IPCV). Retina. 1990;10:1–8.
15. Freund KB, Zweifel SA, Engelbert M. Clinicopathologic findings in polypoidal choroidal vasculopathy. Invest Ophthalmol Vis Sci. 2008;49:4729–4737. doi:10.1167/iovs.08-2134
16. Dansingani KK, Gal-Or O, Sadda SR, Yannuzzi LA, Freund KB. Understanding aneurysmal type 1 neovascularization (polypoidal choroidal vasculopathy): a lesson in the taxonomy of ‘expanded spectra’ – a review. Exp Clin Ophthalmol. 2018;46(2):189–200. doi:10.1111/ceo.13114
17. Yarmohammadi A, Zangwill LM, Diniz-Filho A, et al. Relationship between optical coherence tomography angiography vessel density and severity of visual field loss in glaucoma. Ophthalmology. 2016;123(12):2498–2508. doi:10.1016/j.ophtha.2016.08.041
18. Mihailovic N, Brand C, Lahme L, et al. Repeatability, reproducibility and agreement of foveal avascular zone measurements using three different optical coherence tomography angiography devices. PLoS One. 2018;13(10):1–10. doi:10.1371/journal.pone.0206045
19. Corvi F, Pellegrini M, Erba S, et al. Reproducibility of vessel density, fractal dimension, and foveal avascular zone using 7 different optical coherence tomography angiography devices. Am J Ophthalmol. 2018;186:25–31. doi:10.1016/j.ajo.2017.11.011
20. Chung CS, Nesper PL, Park JJ, et al. Comparison of zeiss cirrus and optovue RTVue OCT angiography systems: a quantitative and qualitative approach examining the three capillary networks in diabetic retinopathy. Ophthalmic Surg Lasers Imaging Retina. 2018;49(11):e198–e205. doi:10.3928/23258160-20181101-18
 © 2019 The Author(s). This work is published and licensed by Dove Medical Press Limited. The
full terms of this license are available at https://www.dovepress.com/terms
and incorporate the Creative Commons Attribution
- Non Commercial (unported, 3.0) License.
By accessing the work you hereby accept the Terms. Non-commercial uses of the work are permitted
without any further permission from Dove Medical Press Limited, provided the work is properly
attributed. For permission for commercial use of this work, please see paragraphs 4.2 and 5 of our Terms.
© 2019 The Author(s). This work is published and licensed by Dove Medical Press Limited. The
full terms of this license are available at https://www.dovepress.com/terms
and incorporate the Creative Commons Attribution
- Non Commercial (unported, 3.0) License.
By accessing the work you hereby accept the Terms. Non-commercial uses of the work are permitted
without any further permission from Dove Medical Press Limited, provided the work is properly
attributed. For permission for commercial use of this work, please see paragraphs 4.2 and 5 of our Terms.