Back to Journals » Clinical Ophthalmology » Volume 14
Quantification of Macular Microvascular Changes in Retinitis Pigmentosa Using Optical Coherence Tomography Angiography
Authors AttaAllah HR ![]() , Mohamed AAM, Hamid MA
, Mohamed AAM, Hamid MA ![]()
Received 31 March 2020
Accepted for publication 2 June 2020
Published 22 June 2020 Volume 2020:14 Pages 1705—1713
DOI https://doi.org/10.2147/OPTH.S254909
Checked for plagiarism Yes
Review by Single anonymous peer review
Peer reviewer comments 3
Editor who approved publication: Dr Scott Fraser
Heba Radi AttaAllah, Asmaa Anwar Mohamed Mohamed, Mohamed A Hamid
Department of Ophthalmology, Faculty of Medicine, Minia University, Minia, Egypt
Correspondence: Mohamed A Hamid
Department of Ophthalmology,Faculty of Medicine, Minia University Hospital, Minia 61111, Egypt
Email [email protected]
Purpose: To investigate macular structural and microvascular changes in retinitis pigmentosa (RP) eyes compared to age-matched controls using spectral domain optical coherence tomography (SD-OCT) and OCT angiography (OCTA).
Methods: This was a cross-sectional study. The foveal and parafoveal thickness and extent of ellipsoid zone (EZ) disruption were measured on OCT. The foveal avascular zone (FAZ) area and retinal vessel density (VD) were automatically calculated for superficial (SCP) and deep capillary plexuses (DCP) and choriocapillaris using OCTA-integrated software. VD was assessed for the whole 6 × 6 mm image, foveal and parafoveal regions. Quantitative measures were compared between healthy and diseased eyes.
Results: The study included 30 eyes of 30 RP patients and 24 eyes of 24 controls. Mean age was 26.9± 6.4 years for RP patients and 27.4± 4.9 years for controls (p=0.76). Mean LogMAR visual acuity (VA) was 0.9± 0.5 for RP patients and 0.05± 0.05 for controls (p < 0.001). Foveal and parafoveal thicknesses were significantly lower in RP cases as compared to the control group. EZ disruption was observed in RP cases only (869± 211 μm). Mean FAZ area was significantly larger in RP eyes in both SCP and DCP. VD was significantly reduced in RP eyes at the level of SCP, DCP and choriocapillaris. VA, deep parafoveal VD, foveal, parafoveal and whole image choriocapillaris VD were negatively correlated with the extent of EZ disruption.
Conclusion: We report OCTA findings in a relatively young cohort of RP patients. We demonstrated a reduction of retinal microvascular density in all studied layers on OCTA. We believe studying retinal vasculature in these patients is important, as a healthy blood supply is a prerequisite for the success of new cell-based therapies under trial for RP.
Keywords: retinitis pigmentosa, OCT angiography, macular microvasculature
Introduction
Retinitis pigmentosa (RP) is a broad entity that comprises a heterogeneous group of inherited photoreceptor dystrophies with an estimated prevalence of 1 in 3000–5000 individuals.1 The primary defect involves rod photoreceptors with later secondary degeneration of the cones. The onset of nyctalopia is usually during adolescence. Subsequently, the peripheral visual field (VF) progressively constricts, with the ultimate loss of central vision later in life. Typical fundoscopic findings include mid-peripheral, bone spicule-like, pigment deposits, waxy pallor of the optic nerve head and vascular attenuation.2
Retinal hemodynamics have been well characterized in RP patients using a multitude of imaging modalities. Evidence from previous publications points to an impaired retinal blood flow as well as decreased retinal vascular oxygen saturation in RP eyes, the mechanism of which remains to be a matter of speculation.3–9 Some studies demonstrated a correlation between macular blood flow and different parameters of visual function in these patients.10,11
Recent advances in imaging have offered new insights into the pathogenesis of many retinal diseases. In particular, spectral-domain optical coherence tomography (SD-OCT) has been used to study structural alterations in RP and evaluate biomarkers for disease severity and progression.12 OCT angiography (OCTA) is a new modality that allows for noninvasive depth-resolved imaging of retinal and choroidal microvasculature without the need for dye injection.13 The purpose of this study is to compare macular OCT and OCTA parameters between RP patients and healthy controls, as well as to correlate these parameters to each other and to best-corrected visual acuity (BCVA).
Patients and Methods
Study Design and Participants
This was a prospective cross-sectional study that included 30 eyes of 30 RP patients and 24 eyes of 24 age-matched controls. All study participants were recruited and evaluated at the outpatient clinic of the Department of Ophthalmology, Minia University, Minia, Egypt during the period from December 1st, 2019 to February 29th, 2020. The study protocol was approved by the local Research Ethics Committee of Minia University. The study adhered to the tenets of the Helsinki Declaration and a signed written consent was obtained from all participants.
A diagnosis of RP was made based on typical clinical findings and electrophysiological testing results. Full-field ERG (ffERG) was done using the RetiPort System (Roland Consult, Brandenburg, Germany), to document the rod-cone dystrophy characteristic of RP. The test was performed according to the standards of the International Society of Clinical Electrophysiology of Vision (ISCEV).14 Eyes were excluded if they had any other cause, ocular or systemic, of pigmentary retinopathy, coexisting macular or optic nerve pathology, history of previous intraocular surgery or trauma. Eyes with poor quality OCTA images due to low signal strength index (<50), blink artifacts, poor fixation leading to motion or doubling artifacts, media opacity or segmentation errors due to the presence of cystoid macular edema or other macular pathology were also excluded.
Control subjects were defined as having a completely normal ophthalmologic examination with a spherical equivalent within ±2 D and no history of previous ocular trauma, intraocular surgery or systemic diseases. Only one eye was selected for each participant in both RP and control groups, to avoid any false-positive results if both eyes were enrolled, as there are similar structural and retinal vasculature characteristics in each individual. The eye with the better OCT and OCTA image quality was selected for inclusion, and if both eyes had similar quality the right eye was always selected.
Ophthalmologic Evaluation
All subjects underwent a comprehensive ophthalmologic examination including detailed history taking, best-corrected visual acuity (BCVA) measurement using a Snellen chart, Goldmann applanation tonometry (GAT), slit-lamp examination of anterior segment, fundus biomicroscopy using a 78 D lens, binocular indirect ophthalmoscopy (BIO) and automated refraction. Colored fundus photos (CFP) and fundus autofluorescence (FAF) images were captured using TOPCON TRC-XXX fundus camera (Topcon Corporation, IMAGE net 200, Tokyo, Japan). SD-OCT and OCTA imaging were performed using Avanti RTVue-XR platform (Optovue, Fremont, CA, USA).
Ellipsoid zone (EZ) disruption was defined as areas of loss of the outer hyperreflective band outer to the external limiting membrane (ELM) and inner to the retinal pigment epithelium (RPE)-Bruch’s membrane complex as visualized on SD-OCT. The length of EZ disruption was measured manually by one investigator (H.R.) within 2000 µm from the fovea on all horizontal and vertical B-scans passing through the fovea; 1000 µm on each side of the fovea. The average of all measurements was taken for each eye and used for statistical analysis.
Optical Coherence Tomography Angiography (OCTA) Image Acquisition
OCTA imaging was done using the Avanti RTVue-XR system (Optovue) which utilizes a split-spectrum amplitude-decorrelation angiography (SSADA) algorithm to extract OCT angiography information. The machine has a light source centered on 840 nm with a bandwidth of 50 nm. It is capable of an A-scan acquisition rate of 70,000 scans/second allowing for an axial resolution of 5 µm and a horizontal resolution of 20 µm. Each OCTA volume contains 304 x 304 A-scans. Two consecutive B-scans are obtained at each fixed location before proceeding to the next position. In order to minimize motion artifacts, 2 orthogonal OCTA volumes are acquired to perform motion correction. The Angio Retina protocol was used for OCTA image acquisition, with a scan area of 6 x 6 mm2. We relied on the automated segmentation function to define the different vascular plexuses. All images were carefully reviewed by 2 experienced examiners and images with segmentation errors were excluded from the analysis. The default machine settings define the boundaries of the superficial capillary plexus (SCP) from 3 μm below the internal limiting membrane (ILM) to 15 μm below the inner plexiform layer (IPL), the deep capillary plexus (DCP) from 15 to 70 μm below the IPL, the outer retina from 70 μm below the IPL to 30 μm below the RPE reference, and the choriocapillaris from 30 to 60 μm below the RPE reference.
Vessel Area Density (VD) and Foveal Avascular Zone (FAZ) Measurement
Both measurements of the FAZ area and calculation of the vessel area density (VD) were done using the commercially available AngioAnalytics software (RTVue-XR version: 2017.1.0.151, Optovue). Using the non-flow function, the FAZ area was automatically calculated in squared millimeters (mm2) when the examiner clicked on the center of the FAZ at the level of each of the superficial and deep capillary plexuses. The vessel area density (VD) was calculated using the Vessel Density Map as the percentage area occupied by vessels relative to the total scan area at the level of the superficial and deep capillary plexuses, as well as the choriocapillaris. The software calculates VD in a circle region of interest (ROI) of a 2.5 mm diameter, centered on the center of the FAZ. The ROI is divided into a central 1-mm2 circle [foveal area (F)] and a surrounding parafoveal area (PF). The whole image VD is calculated as the vascular density of the entire 6 x 6 mm2 scan area.
Statistical Analysis
All statistical analyses were done using IBM SPSS Statistics for Windows, Version 25.0 (IBM Corp., Armonk, NY, USA). Snellen visual acuity measurements were converted into LogMAR for statistical analyses. Mean±standard deviation (range) were used to describe parametric quantitative data, while number (percentage) was used to describe categorical data. Parametric quantitative data were compared between the two groups using the Independent Samples t-test, while qualitative data were compared using the Chi-square test. Correlation between different variables was done using Pearson’s correlation coefficient. Statistical significance was accepted at p < 0.05.
Results
Study Population
Overall, 54 eyes were recruited for the study: 30 eyes with RP, and 24 eyes of normal controls. Visual acuity was significantly worse in RP eyes, as LogMAR VA was (0.9± 0.5) in RP group, while it was (0.05±0.05) in the control group (p<0.001). Characteristics of the study population are summarized in Table 1.
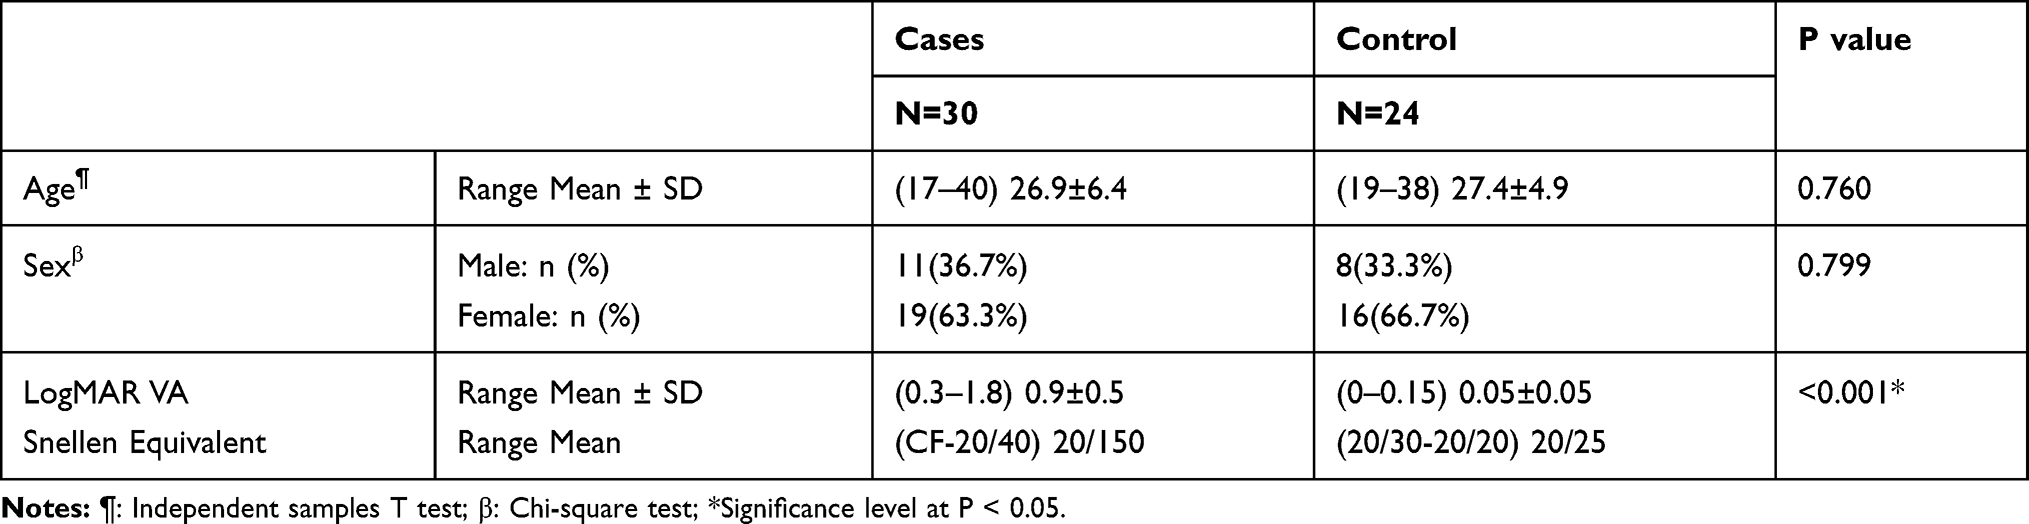 |
Table 1 Characteristics of the Study Population |
Comparison Between Patients and Controls
Foveal and parafoveal thicknesses were significantly lower in RP cases compared to controls (p<0.001). EZ disruption was observed in RP cases only (869±211µm) but not in controls. The mean FAZ area was significantly larger in RP patients considering both the SCP and DCP (p<0.001). Superficial VD (whole image and foveal) was significantly lower in eyes with RP compared to the control group (p=0.001, Figure 1). Deep VD values in the whole image, foveal and parafoveal areas were significantly lower in RP cases than the control group (p<0.001, 0.002, <0.001, respectively, Figure 2). Eyes with RP had significantly lower whole image and parafoveal choriocapillaris VD values than the control group (p<0.001 and p=0.001, respectively, Figure 3). Table 2 summarizes the comparison between quantitative OCT and OCTA parameters of both groups.
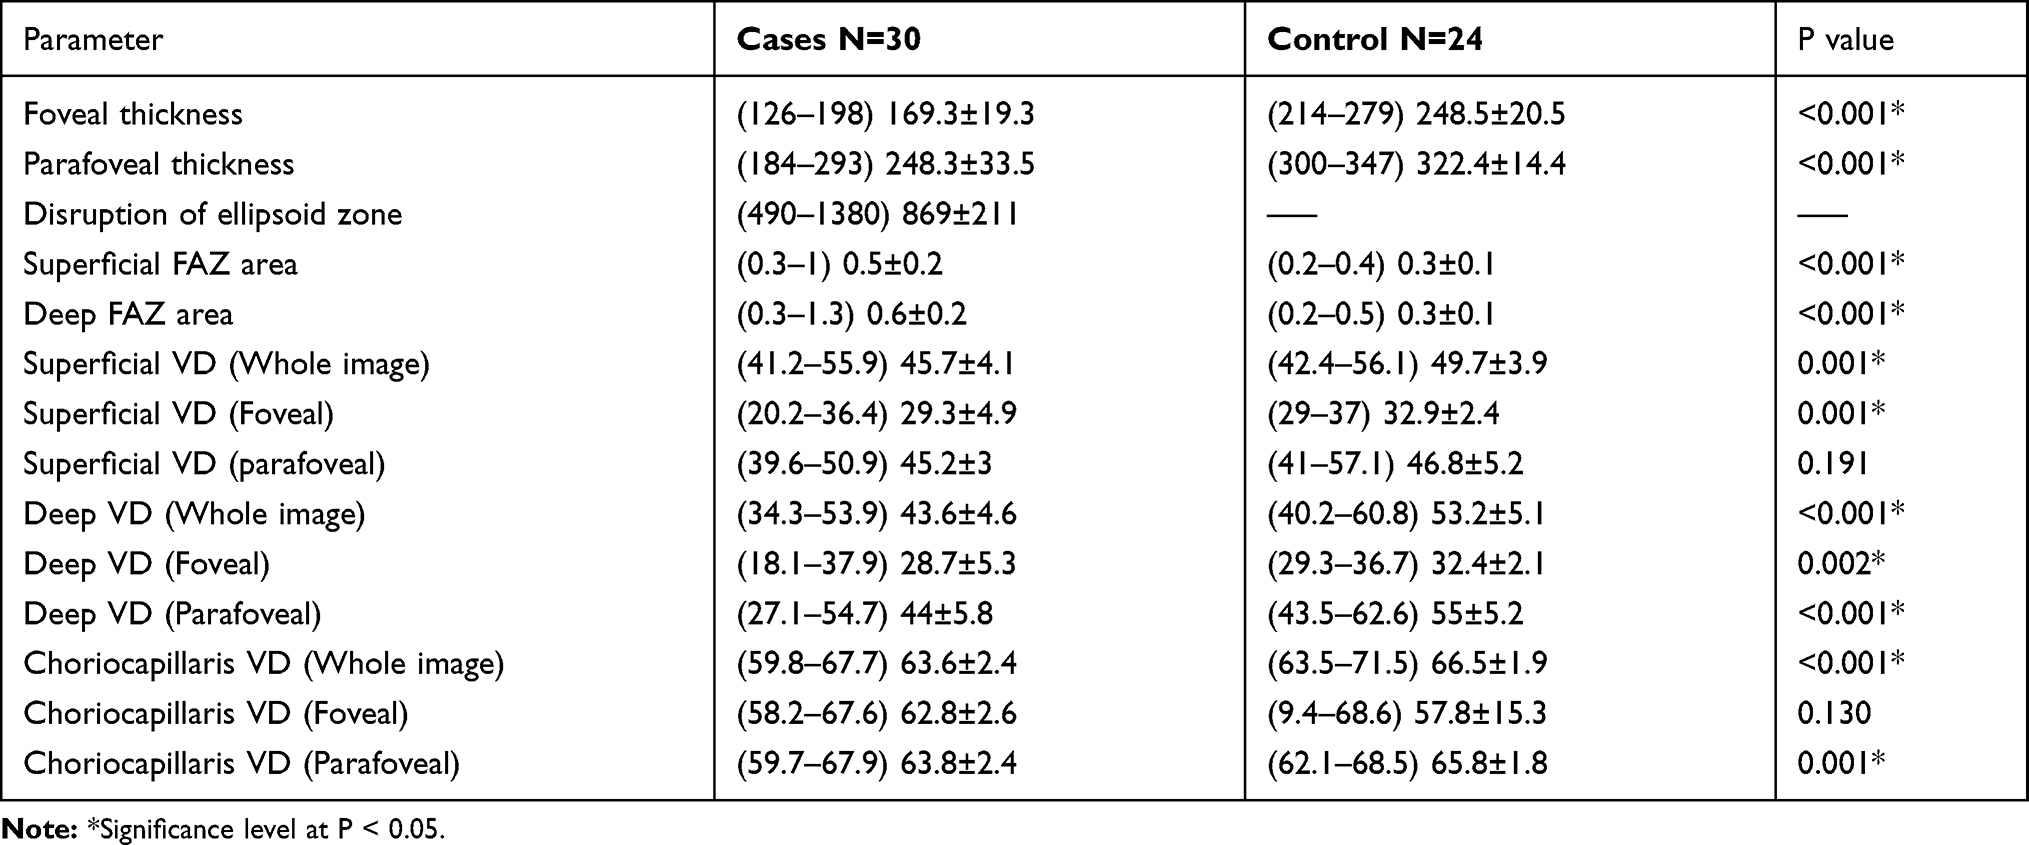 |
Table 2 OCT and OCTA Quantitative Parameters in Both Groups |
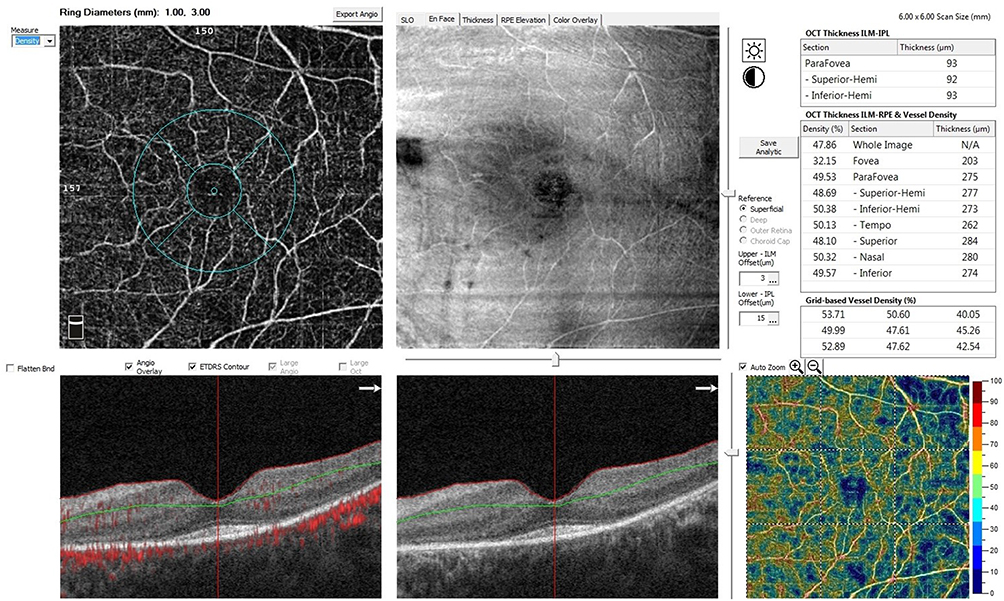 |
Figure 1 The OCTA Angio Retina scan (6x6-mm2) of the left eye of a patient with retinitis pigmentosa centered on the macula at the level of the superficial retinal plexus. Vessel density is calculated by an automated software algorithm and is presented on the OCT thickness ILM-RPE & Vessel Density map (middle right), and on Grid-based Vessel Density (%) with color-coded flow density map (lower right), where areas with warm colors has greater flow. |
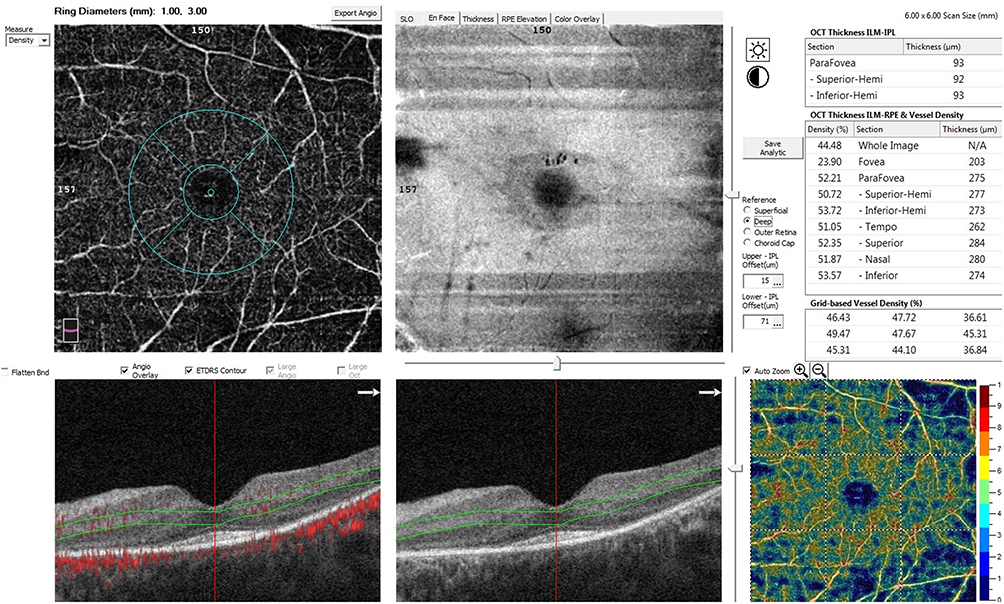 |
Figure 2 The OCTA Angio Retina scan (6x6-mm) of the left eye of a patient with retinitis pigmentosa centered on the macula at the level of the deep retinal plexus. Vessel density is calculated by an automated software algorithm and is presented on the OCT thickness ILM-RPE & Vessel Density map (middle right), and on Grid-based Vessel Density (%) with color-coded flow density map (lower right). |
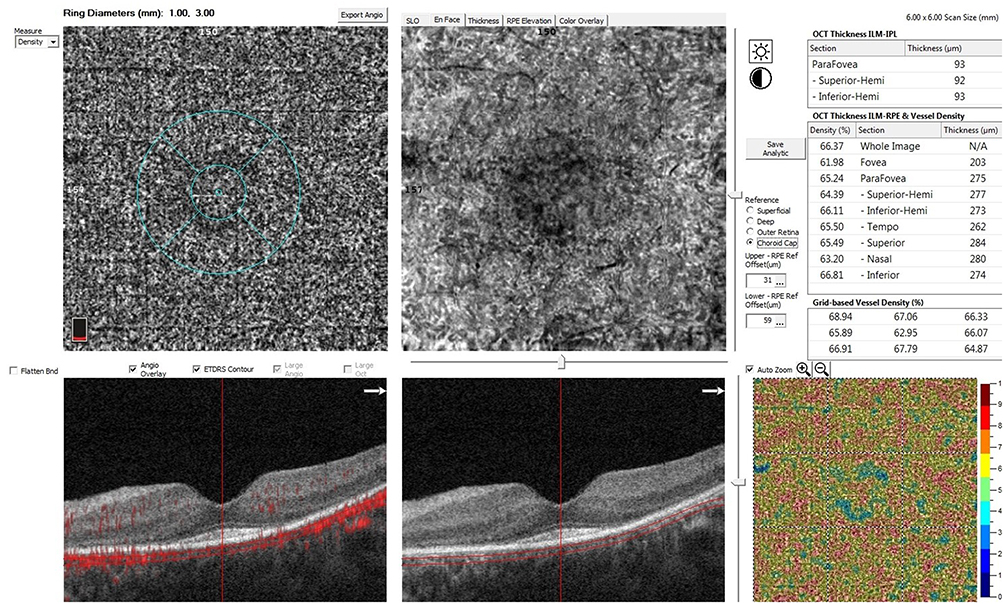 |
Figure 3 The OCTA Angio Retina scan (6x6-mm) of the left eye of a patient with retinitis pigmentosa centered on the macula at the level of the choriocapillaris. Vessel density is calculated by an automated software algorithm and is presented on the OCT thickness ILM-RPE & Vessel Density map (middle right), and on Grid-based Vessel Density (%) with color-coded flow density map (lower right). |
Correlation Analyses in RP Group
Decreased foveal thickness in RP eyes was associated with decreased superficial foveal VD, as there was a positive moderate correlation between foveal thickness and superficial foveal VD (r=0.627, P<0.001) (Table 3). Parafoveal thickness was not correlated with VA, OCT or OCTA parameters.
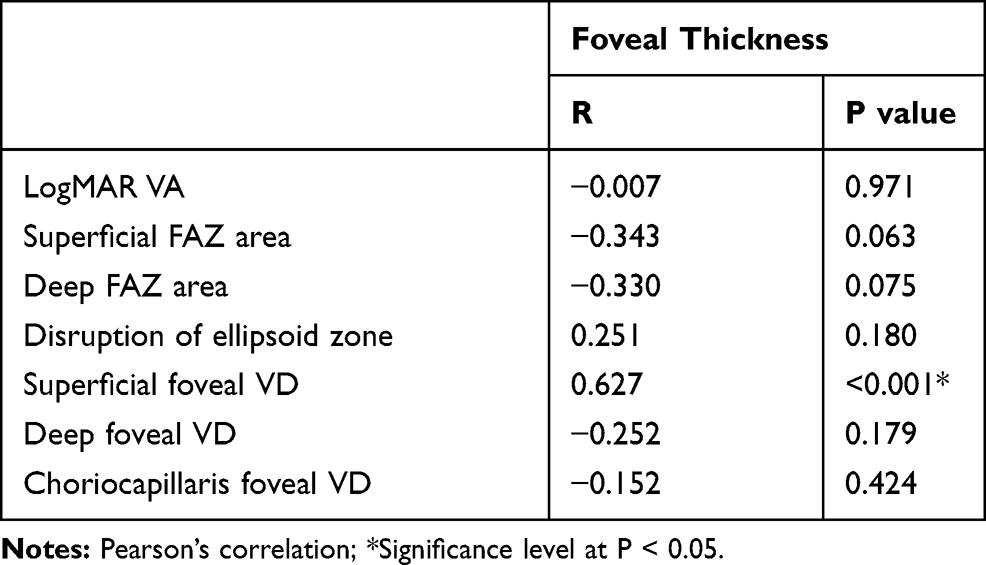 |
Table 3 Correlation Between Foveal Thickness and LogMAR VA, OCT and OCTA Quantitative Parameters in RP Group |
Visual acuity was significantly worse in eyes with EZ disruption. A moderate positive correlation was found between EZ disruption and LogMAR VA (r=−0.568, P=0.001) (Table 4). Eyes with EZ disruption had lower deep parafoveal VD (r=−0.463, P=0.01). Decreased vessel density in choriocapillaris layer (whole, foveal and parafoveal) was also associated with EZ disruption (r= −0.58, −0.57, and −0.57, respectively, p=0.001 for all) (Table 5).
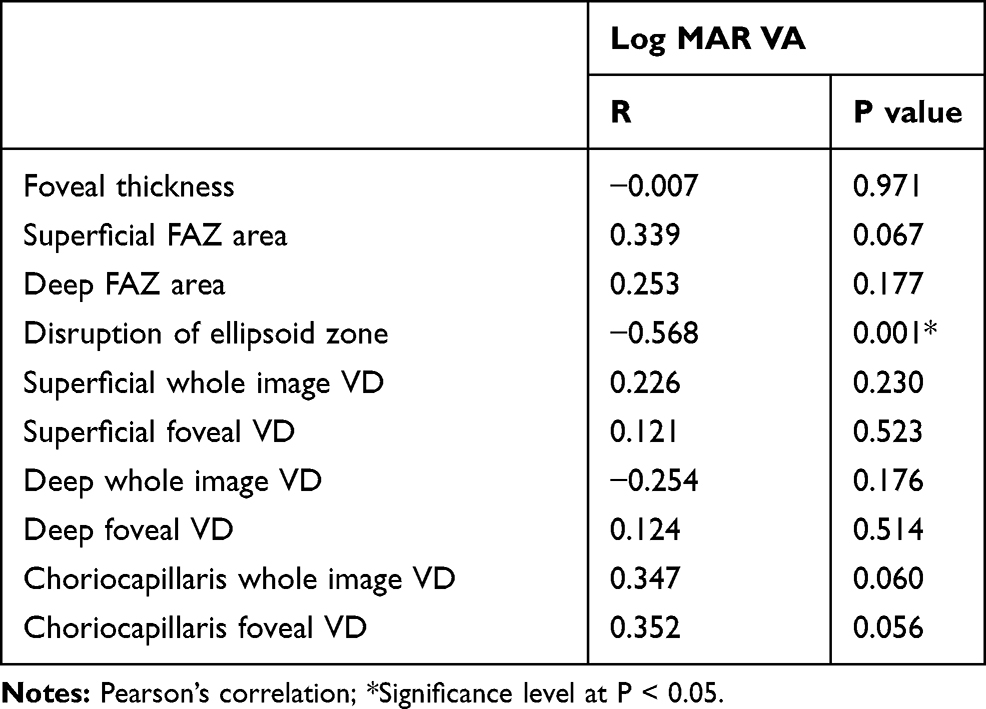 |
Table 4 Correlation Between LogMAR VA and OCT and OCTA Quantitative Parameters in RP Group |
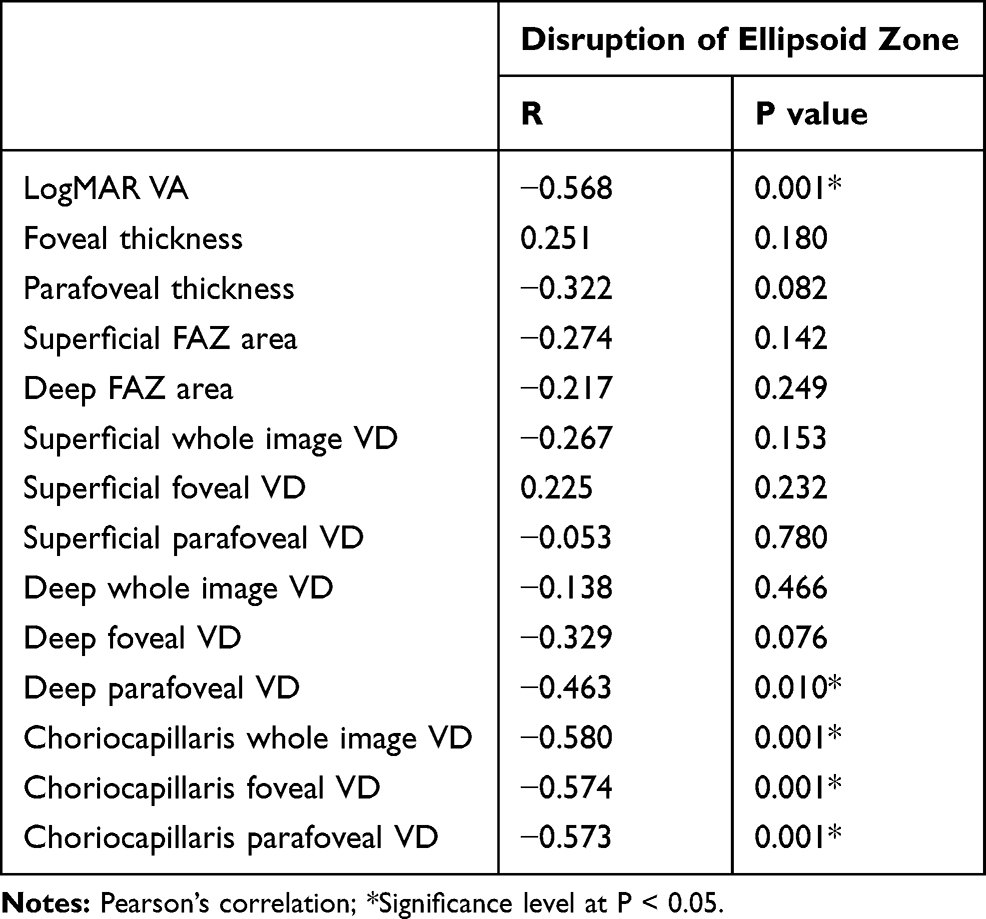 |
Table 5 Correlation Between the Extent of Ellipsoid Zone Disruption and OCT and OCTA Quantitative Parameters in RP Group |
Discussion
Both study groups were balanced as regards age and sex, but BCVA was significantly worse in RP patients. Our cohort of RP patients had a mean LogMAR VA of 0.9, as we did not exclude cases with advanced disease unless VA was too poor to permit proper fixation during OCTA image acquisition. Macular function in RP patients can be assessed using a variety of other methods such as perimetry and multifocal electroretinography (mfERG).12 BCVA remains a reliable and fairly sensitive tool to assess disease severity and follow the progression of RP in a clinical setting.15
Several studies have described OCT findings in RP. Disruption of photoreceptor layers and macular thinning are characteristic features.12,16–18 SD-OCT has shown good reproducibility in assessing macular thickness in RP.17 Disruption of the photoreceptor ellipsoid zone (EZ) was observed in all our RP cases in the parafoveal region and both central subfoveal and parafoveal thickness were significantly reduced in cases compared to controls (p<0.001). RP cases with macular cysts were excluded from our study to avoid segmentation errors in OCTA. Even though RP is primarily a photoreceptor disorder, secondary disorganization of the inner retinal elements usually develops as the disease progresses.19 Retinal ganglion cell (RGC) loss and thinning of the nerve fiber layer contribute to parafoveal thinning in these patients, while photoreceptor atrophy is responsible for central foveal thinning.20
Some authors hypothesized that RGC loss in RP was due to decreased trans-synaptic signaling with secondary reduced metabolic demand and retinal vascular attenuation. Others, however, suggested that impaired retinal blood flow was a primary and early event in the course of the disease that resulted in RGC damage.20 Histopathologic findings support the latter view.21,22 It would require large longitudinal studies in order to establish a cause–effect relationship between both variables.
Neither foveal nor parafoveal thickness was correlated to LogMAR VA in our study. BCVA was rather correlated to the extent of EZ disruption. EZ loss is a more direct measure of photoreceptor damage and, hence, has been used to evaluate disease progression in RP patients.18,23 Other studies found central foveal thickness to be correlated to BCVA.16,17 The difference between our findings and theirs might be due to different OCT machines used, as thickness measurements can significantly vary according to the platform used.17 Of note, Witkin and colleagues found central foveal thickness to be a poor predictor of VA even though both parameters were fairly correlated. Instead, photoreceptor thickness in the fovea (measured manually from EZ to the inner edge of RPE band) was a likely predictor of VA and showed a strong correlation to it.16
We found a significant positive correlation between OCTA-measured superficial foveal VD and central foveal thickness. Similarly, Koyanagi et al found a strong correlation between central subfield thickness (CST) and SCP flow density.24 Furthermore, two other studies found parafoveal vessel density to be correlated to the thickness of the ganglion cell complex (GCC), a parameter that we did not assess in our study and can be variable across different OCT machines.20,25 Additionally, we demonstrated that deep parafoveal VD was correlated to EZ disruption. This is consistent with previous findings and could be explained by vasoconstriction secondary to loss of EZ line, which is formed by the photoreceptor mitochondria.15,26
The advent of OCTA has been a great addition to the retinal imaging armamentarium. The rapid acquisition time suits the poor fixation present in later stages of RP.13 However, segmentation errors and motion artifacts remain a limitation to its use in this subset of patients, as well as other macular pathologies.27 Recently, investigators have tried to assess retinal and choroidal blood flow in RP eyes utilizing this novel technology.15,20,24–26,28–32
We found that FAZ area measured at both the SCP and DCP was significantly larger in RP eyes compared to healthy controls. This comes in agreement with previous publications.15,25,26,30,32 However, in contrast to the findings of most of these studies, VA in our study was not correlated to FAZ area. Specifically, previous investigators found FAZ area in the SCP to be strongly correlated to VA and, hence, considered it a surrogate for central visual function in these patients.15,24–26 The reason for this difference might be different patient characteristics across studies. In particular, we recruited a younger cohort of RP patients with a mean age of 26.9 (±6.4) years, while previous studies recruited older patients with a mean age that was around 40 years. This correlation between the FAZ area and VA might not manifest until later in the course of the disease. Interestingly, Koyanagi and colleagues did not find a difference between RP eyes and controls regarding FAZ area, unless VA was reduced below 20/20, in which case they found a significant enlargement of the superficial, but not deep, FAZ area.24 Conversely, Battaglia Parodi et al found FAZ area to be significantly enlarged only at the level of DCP in RP eyes.30 Another aspect to be considered is the lack of genetic characterization in the aforementioned studies, including ours. Even though our cohort was younger, their mean BCVA was poor. It is well known that RP comprises a myriad of genotypic variations that can result in very different phenotypes. Finally, we relied on automated FAZ measurements by means of the AngioAnalytics software (Optovue Inc), while other studies manually selected the FAZ region and utilized other software for calculating its area.
We calculated the VD of the whole 6 X 6 mm2 image area. Because RP is primarily a rod-cone dystrophy and the maximum rod density is around 5 mm outside the fovea in the mammalian retina, we wanted to include the whole 6 X 6 mm2 area in our analysis of macular microvasculature in order to capture any changes that might be missed in the foveal or parafoveal regions at any of the 3 levels of capillary plexuses.
Reduction of macular microvascular density has been a consistent finding in studies evaluating OCTA parameters in RP patients.15,20,24-26,28–32 Some studies demonstrated more significant reduction in the DCP.30,32 We found both superficial and deep VD to be significantly reduced in our patients, but the reduction in deep VD was more pronounced in that both foveal and parafoveal areas were involved, while the parafoveal superficial VD did not show significant reduction. It has been suggested that blood vessel attenuation in RP is caused by regulatory vasoconstriction secondary to RGC loss and decreased metabolic demand.5 Increased levels of endothelin-1, a potent vasoconstrictor, in RP eyes supports this hypothesis.33,34 Alternatively, impaired retinal blood flow might be a primary event in the pathogenesis of RP.20
Choriocapillaris VD, both in whole image and parafoveal zone, was significantly reduced in RP eyes compared to healthy eyes in our study. This finding has not been consistent among other studies evaluating OCTA parameters. While Anawaiseh et al and Toto et al demonstrated a significant reduction in choriocapillaris vessel density in RP eyes,20,32 Battaglia Parodi et al and Sugahara et al found no difference between diseased and control eyes.25,30 In their study to evaluate the progression of OCTA parameters in RP, Jaurengi and colleagues found no progression rate at the choriocapillaris over an average period of 1.3 years and no correlation between flow density at the choriocapillaris and EZ width.15 In contrast to their findings, decreased VD at the choriocapillaris level was correlated to EZ disruption in our study. To the best of our knowledge, this correlation has not been previously reported and might be explained by secondary vasoconstriction, similar to what happens in the DCP.15,26
Several studies demonstrated the alteration of choroidal circulation in RP. Ocular pulse amplitude indirectly measures choroidal blood flow and was found to be reduced in RP eyes.20 Enhanced-depth imaging (EDI) SD-OCT showed a reduction of choroidal thickness in RP patients.35 However, choroidal blood flow changes were shown to occur much later than alteration of retinal blood flow in murine models of RP.36 Therefore, it is possible that different disease stages of patients included in different studies might have resulted in this inconsistency. Another possibility is that RPE atrophy in these patients results in enhanced penetration of the OCT signal into the choriocapillaris which could mask subtle choriocapillaris flow impairment.28
In conclusion, we report OCTA findings in a relatively young Egyptian cohort of RP patients. Reduction in vessel density spanned the SCP, DCP and choriocapillaris. Superficial VD correlated with central foveal thickness, while deep VD correlated with EZ line disruption. We also demonstrated a positive correlation between VD reduction at the choriocapillaris level and the extent of EZ loss which, to the best of our knowledge, was not previously reported. We believe that the characterization of retinal blood flow in these patients is important, as gene and stem cell therapies under trial require intact inner retinal neural elements. A healthy choroidal blood supply is essential for the regenerated photoreceptor survival.
Limitations of our study include its cross-sectional design and relatively small number of cases. Exclusion of patients with poor fixation precluded evaluation of retinal microvasculature in the advanced stage of the disease. Lack of genetic characterization of our patients is another limitation. Larger longitudinal studies of genetically characterized RP patients with long follow-up periods are needed. A strength of our study is the use of OCTA to accurately define microvascular changes in different retinal layers and the use of automated quantification capabilities of the machine.
Disclosure
The authors declare that they have no conflict of interest.
References
1. Chizzolini M, Galan A, Milan E, Sebastiani A, Costagliola C, Parmeggiani F. Good epidemiologic practice in retinitis pigmentosa: from phenotyping to biobanking. Curr Genomics. 2011;12(4):260–266. doi:10.2174/138920211795860071
2. Hartong DT, Berson EL, Dryja TP. Retinitis pigmentosa. Lancet (London, England). 2006;368(9549):1795–1809. doi:10.1016/s0140-6736(06)69740-7
3. Krill AE, Archer D, Newell FW. Fluorescein angiography in retinitis pigmentosa. Am J Ophthalmol. 1970;69(5):826–835. doi:10.1016/0002-9394(70)93421-5
4. Hyvarinen L, Maumenee AE, Kelley J, Cantollino S. Fluorescein angiographic findings in retinitis pigmentosa. Am J Ophthalmol. 1971;71(1):17–26. doi:10.1016/0002-9394(71)91089-0
5. Grunwald JE, Maguire AM, Dupont J. Retinal hemodynamics in retinitis pigmentosa. Am J Ophthalmol. 1996;122(4):502–508. doi:10.1016/S0002-9394(14)72109-9
6. Konieczka K, Flammer AJ, Todorova M, Meyer P, Flammer J. Retinitis pigmentosa and ocular blood flow. EPMA J. 2012;3(1):17. doi:10.1186/1878-5085-3-17
7. Zhang Y, Harrison JM, Nateras OS, Chalfin S, Duong TQ. Decreased retinal-choroidal blood flow in retinitis pigmentosa as measured by MRI. Doc Ophthalmol. 2013;126(3):187–197. doi:10.1007/s10633-013-9374-1
8. Turksever C, Valmaggia C, Orgul S, Schorderet DF, Flammer J, Todorova MG. Retinal vessel oxygen saturation and its correlation with structural changes in retinitis pigmentosa. Acta Ophthalmol (Copenh). 2014;92(5):454–460. doi:10.1111/aos.12379
9. Zong Y, Lin L, Yi C, et al. Retinal vessel oxygen saturation and vessel diameter in retinitis pigmentosa at various ages. Albrecht Von Graefes Arch Klin Exp Ophthalmol. 2016;254(2):243–252. doi:10.1007/s00417-015-3039-6
10. Falsini B, Anselmi GM, Marangoni D, et al. Subfoveal choroidal blood flow and central retinal function in retinitis pigmentosa. Invest Ophthalmol Vis Sci. 2011;52(2):1064–1069. doi:10.1167/iovs.10-5964
11. Murakami Y, Ikeda Y, Akiyama M, et al. Correlation between macular blood flow and central visual sensitivity in retinitis pigmentosa. Acta Ophthalmol (Copenh). 2015;93(8):e644–648. doi:10.1111/aos.12693
12. Smith HB, Chandra A, Zambarakji H. Grading severity in retinitis pigmentosa using clinical assessment, visual acuity, perimetry and optical coherence tomography. Int Ophthalmol. 2013;33(3):237–244. doi:10.1007/s10792-012-9678-2
13. Spaide RF, Fujimoto JG, Waheed NK, Sadda SR, Staurenghi G. Optical coherence tomography angiography. Prog Retin Eye Res. 2018;64:1–55. doi:10.1016/j.preteyeres.2017.11.003
14. McCulloch DL, Marmor MF, Brigell MG, et al. ISCEV Standard for full-field clinical electroretinography (2015 update). Doc Ophthalmol. 2015;130(1):1–12. doi:10.1007/s10633-014-9473-7
15. Jauregui R, Park KS, Duong JK, Mahajan VB, Tsang SH. Quantitative progression of retinitis pigmentosa by optical coherence tomography angiography. Sci Rep. 2018;8(1):13130. doi:10.1038/s41598-018-31488-1
16. Witkin AJ, Ko TH, Fujimoto JG, et al. Ultra-high resolution optical coherence tomography assessment of photoreceptors in retinitis pigmentosa and related diseases. Am J Ophthalmol. 2006;142(6):945–952. doi:10.1016/j.ajo.2006.07.024
17. Garcia-Martin E, Pinilla I, Sancho E, et al. Optical coherence tomography in retinitis pigmentosa: reproducibility and capacity to detect macular and retinal nerve fiber layer thickness alterations. Retina (Philadelphia, Pa). 2012;32(8):1581–1591. doi:10.1097/IAE.0b013e318242b838
18. Hariri AH, Zhang HY, Ho A, et al. Quantification of ellipsoid zone changes in retinitis pigmentosa using en face spectral domain-optical coherence tomography. JAMA Ophthalmol. 2016;134(6):628–635. doi:10.1001/jamaophthalmol.2016.0502
19. Jones BW, Pfeiffer RL, Ferrell WD, Watt CB, Marmor M, Marc RE. Retinal remodeling in human retinitis pigmentosa. Exp Eye Res. 2016;150:149–165. doi:10.1016/j.exer.2016.03.018
20. Toto L, Borrelli E, Mastropasqua R, et al. Macular features in retinitis pigmentosa: correlations among ganglion cell complex thickness, capillary density, and macular function. Invest Ophthalmol Vis Sci. 2016;57(14):6360–6366. doi:10.1167/iovs.16-20544
21. Li ZY, Possin DE, Milam AH. Histopathology of bone spicule pigmentation in retinitis pigmentosa. Ophthalmology. 1995;102(5):805–816. doi:10.1016/S0161-6420(95)30953-0
22. Milam AH, Li ZY, Fariss RN. Histopathology of the human retina in retinitis pigmentosa. Prog Retin Eye Res. 1998;17(2):175–205. doi:10.1016/s1350-9462(97)00012-8
23. Birch DG, Locke KG, Wen Y, Locke KI, Hoffman DR, Hood DC. Spectral-domain optical coherence tomography measures of outer segment layer progression in patients with X-linked retinitis pigmentosa. JAMA Ophthalmol. 2013;131(9):1143–1150. doi:10.1001/jamaophthalmol.2013.4160
24. Koyanagi Y, Murakami Y, Funatsu J, et al. Optical coherence tomography angiography of the macular microvasculature changes in retinitis pigmentosa. Acta Ophthalmol (Copenh). 2018;96(1):e59–e67. doi:10.1111/aos.13475
25. Sugahara M, Miyata M, Ishihara K, et al. Optical coherence tomography angiography to estimate retinal blood flow in eyes with retinitis pigmentosa. Sci Rep. 2017;7:46396. doi:10.1038/srep46396
26. Inooka D, Ueno S, Kominami T, et al. Quantification of macular microvascular changes in patients with retinitis pigmentosa using optical coherence tomography angiography. Invest Ophthalmol Vis Sci. 2018;59(1):433–438. doi:10.1167/iovs.17-23202
27. Lauermann JL, Woetzel AK, Treder M, et al. Prevalences of segmentation errors and motion artifacts in OCT-angiography differ among retinal diseases. Albrecht Von Graefes Arch Klin Exp Ophthalmol. 2018;256(10):1807–1816. doi:10.1007/s00417-018-4053-2
28. Zhang Q, Lee CS, Chao J, et al. Wide-field optical coherence tomography based microangiography for retinal imaging. Sci Rep. 2016;6:22017. doi:10.1038/srep22017
29. Rezaei KA, Zhang Q, Chen CL, Chao J, Wang RK. Retinal and choroidal vascular features in patients with retinitis pigmentosa imaged by OCT based microangiography. Albrecht Von Graefes Arch Klin Exp Ophthalmol. 2017;255(7):1287–1295. doi:10.1007/s00417-017-3633-x
30. Battaglia Parodi M, Cicinelli MV, Rabiolo A, et al. Vessel density analysis in patients with retinitis pigmentosa by means of optical coherence tomography angiography. Br J Ophthalmol. 2017;101(4):428–432. doi:10.1136/bjophthalmol-2016-308925
31. Mastropasqua R, Borrelli E, Agnifili L, et al. Radial peripapillary capillary network in patients with retinitis pigmentosa: an optical coherence tomography angiography study. Front Neurol. 2017;8:572. doi:10.3389/fneur.2017.00572
32. Alnawaiseh M, Schubert F, Heiduschka P, Eter N. Optical coherence tomography angiography in patients with retinitis pigmentosa. Retina (Philadelphia, Pa). 2017;Publish Ahead of Print. doi:10.1097/iae.0000000000001904.
33. Cellini M, Strobbe E, Gizzi C, Campos EC. ET-1 plasma levels and ocular blood flow in retinitis pigmentosa. This article is one of a selection of papers published in the two-part special issue entitled 20 years of endothelin research. Can J Physiol Pharmacol. 2010;88(6):630–635. doi:10.1139/Y10-036
34. Finzi A, Cellini M, Strobbe E, Campos EC. ET-1 plasma levels, choroidal thickness and multifocal electroretinogram in retinitis pigmentosa. Life Sci. 2014;118(2):386–390. doi:10.1016/j.lfs.2014.04.004
35. Dhoot DS, Huo S, Yuan A, et al. Evaluation of choroidal thickness in retinitis pigmentosa using enhanced depth imaging optical coherence tomography. Br J Ophthalmol. 2013;97(1):66–69. doi:10.1136/bjophthalmol-2012-301917
36. Li G, De La Garza B, Shih -Y-YI, Muir ER, Duong TQ. Layer-specific blood-flow MRI of retinitis pigmentosa in RCS rats. Exp Eye Res. 2012;101:90–96. doi:10.1016/j.exer.2012.06.006
 © 2020 The Author(s). This work is published and licensed by Dove Medical Press Limited. The
full terms of this license are available at https://www.dovepress.com/terms
and incorporate the Creative Commons Attribution
- Non Commercial (unported, 3.0) License.
By accessing the work you hereby accept the Terms. Non-commercial uses of the work are permitted
without any further permission from Dove Medical Press Limited, provided the work is properly
attributed. For permission for commercial use of this work, please see paragraphs 4.2 and 5 of our Terms.
© 2020 The Author(s). This work is published and licensed by Dove Medical Press Limited. The
full terms of this license are available at https://www.dovepress.com/terms
and incorporate the Creative Commons Attribution
- Non Commercial (unported, 3.0) License.
By accessing the work you hereby accept the Terms. Non-commercial uses of the work are permitted
without any further permission from Dove Medical Press Limited, provided the work is properly
attributed. For permission for commercial use of this work, please see paragraphs 4.2 and 5 of our Terms.