Back to Journals » Psychology Research and Behavior Management » Volume 11
Psychometric evaluation of the Arabic version of the nomophobia questionnaire: confirmatory and exploratory factor analysis – implications from a pilot study in Kuwait among university students
Authors Al-Balhan EM ![]() , Khabbache H, Watfa A
, Khabbache H, Watfa A ![]() , Re TS, Zerbetto R, Bragazzi NL
, Re TS, Zerbetto R, Bragazzi NL
Received 2 April 2018
Accepted for publication 30 August 2018
Published 16 October 2018 Volume 2018:11 Pages 471—482
DOI https://doi.org/10.2147/PRBM.S169918
Checked for plagiarism Yes
Review by Single anonymous peer review
Peer reviewer comments 2
Editor who approved publication: Dr Igor Elman
Eisa M Al-Balhan,1 Hicham Khabbache,2 Ali Watfa,3 Tania Simona Re,4 Riccardo Zerbetto,5 Nicola Luigi Bragazzi4,6
1Department of Educational Psychology, College of Education, Kuwait University, Kuwait City, Kuwait; 2Faculty of Literature and Humanistic Studies, Sais, Sidi Mohamed Ben Abdellah University, Fez, Morocco; 3Faculty of Education, Kuwait University, Kuwait City, Kuwait; 4UNESCO Chair “Health Anthropology Biosphere and Healing Systems”, University of Genoa, Genoa, Italy; 5GESTALT Study Center (CSTG), Milano, Italy; 6Department of Health Sciences (DISSAL), Postgraduate School of Public Health, University of Genoa, Genoa, Italy
Background: In the past decades, thanks to the widespread use of the new information and communication technologies, nomophobia has emerged as a contemporary psychological disorder. More in detail, it has been defined as the modern fear of feeling disconnected, being out of mobile phone contact, and being unable to access information and/or communicate with others. Few authors have used an Arabic version of the Nomophobia Questionnaire, even though its psychometric properties are not well known and have been poorly investigated from a formal rigorous standpoint.
Materials and methods: Our research objective was to develop and validate the Arabic version, administering it to a sample of adolescents and young adults in a country characterized by a high mobile network coverage. A total of 512 subjects (aged 21.62±4.33 years, median 20 years), equally distributed between males and females, and based in Kuwait, volunteered to take part in the study.
Results: The confirmatory factor analysis did not show a completely satisfactory fitting with the original factor structure. The exploratory factor analysis showed that four factors had 57.24% variance. Overall Cronbach’s alpha coefficient was 0.879. However, the coefficient increased from 0.645 to 0.849 with respect to the original factor structure. Scores (and mean scores) were 4.25±1.59 (21.23±7.95), 2.95±1.33 (17.68±7.97), 4.48±1.78 (8.96±3.56), and 4.98±1.52 (34.84±10.67) for factors I, II, III, and IV, respectively, whereas the overall score (and mean overall score) was 4.14±1.13 (82.71±22.68).
Conclusion: In our sample, no subject (0.0%) was without nomophobia, with 92 (18.0%) and 288 individuals (56.2%) reporting mild and moderate nomophobia levels, respectively. Approximately a quarter of the recruited sample (132 subjects, 25.8%) had severe nomophobia level.
Keywords: Nomophobia, questionnaire, psychometric properties, Arabic language, confirmatory factor analysis, exploratory factor analysis
Introduction
In the past decades, thanks to the widespread use of the new information and communication technologies (ICTs), nomophobia has emerged as a contemporary psychological disorder. More in detail, it has been defined as the modern fear of feeling disconnected, being out of mobile phone contact, and being unable to access information and/or communicate with others.1,2
Nomophobia, as psychological construct, can be quantitatively assessed and measured using the Nomophobia Questionnaire (NMP-Q), a scale developed by Yildirim and Correia,2 later translated and available in different languages, including Turkish,3 Spanish,4,5 Italian,6 and Persian.7 Currently, the NMP-Q is the only psychological instrument to specifically investigate the construct of nomophobia.1
Different surveys have led to different percentages of nomophobic behaviors and attitudes among the population. A study8 carried out in India among dental students found that problematic use of mobiles dramatically impacted on academic performance. Approximately 39.5% of students agreed that they would score low marks during their professional exams if they spend more time on their mobile devices. In particular, the percentage of students who frequently checked their cell phone during their classes or while doing clinical work was 24.7%. Approximately a quarter of the sample (a total of 24.12% of the students) were found to be nomophobic. This percentage was higher (40.97%), when considering all those at risk of nomophobia. A statistically significant difference was found among preclinical and clinical students, interns, and postgraduates in terms of the usage of mobiles and the effect of such utilization on their health.
Some authors have used an Arabic version of the NMP-Q, even though its psychometric properties are not well known and have been poorly investigated from a formal rigorous standpoint. A study9 carried out in Saudi Arabia found that, out of 2,367 subjects, 27.2% spent more than 8 hours per day on their mobiles, with 75% using at least four applications per day, mainly for social networking and keeping themselves updated (ie, watching news). A percentage of students ranging from 25% to 43% perceived an impact of mobile utilization on health (in terms of decreased sleeping hours and energy the next day) and on academic achievements.
Another study10 performed in Saudi Arabia recruited a sample of King Saud University students. Authors found that smartphone addiction among participants was 48%. Predictors were found to be gender, social status, monthly income, and daily use of mobile device.
A third study11 performed in Saudi Arabia collected data from a sample of 622 undergraduate health sciences colleges students aged 21.8±2.0 years. The authors found that approximately one-fourth of the students (22.2%) suffered from severe nomophobia. Students’ age groups (P=0.032), type of college (P=0.003), as well as Internet use, and those who use their smartphones for 4 hours or more daily had significantly higher prevalence of severe nomophobia.
In a fourth study carried out in Saudi Arabia, Kateb12 distributed an anonymous self-reported survey among 1,800 potential candidates, and 355 undergraduate students returned complete questionnaires. Of the candidates who participated, 81.2% were female, 18.8% male, and 53.7% aged less than 24 years. Mean scores were 3.20±0.97 for overall questionnaire, 3.39±1.05 for factor I (“not being able to communicate”), 3.31±1.15 for factor III (“not being able to access information”), 2.92±1.19 for factor II (“losing connectedness), and 3.24±1.02 for factor IV (“giving up convenience”). Correlations among the subscales ranged from 0.62 to 0.75, whereas correlations of overall scores ranged from 0.86 to 0.89. A high level of mobile phone involvement was found, especially among females.
Our research objective was to develop and validate the Arabic version, administering it to a sample of adolescents and young adults in a country characterized by a high mobile network coverage. According to the latest data available, in Kuwait, smartphones are found, indeed, in 99.7% of households.13
A field study conducted by Hashemi-Al Zakia14 of the Kuwait University on a sample of 500 participants aged 20–21 years found that the use of mobile devices in the university campus was quite widespread (reported by 57.2% of the interviewees), irrespective of time. A gender-specific utilization of smartphones was detected: for females, the use of mobiles was associated with willingness and feelings of freedom, whereas for males, the use of mobiles was mainly for social exchange and communication purposes. Furthermore, three-quarters of the sample reported to use their mobiles even while driving, despite having met with previous accidents (90.8% of the subjects).
However, despite the relevance of such an issue, there is a dearth of information concerning the nomophobic behavior and attitudes in Kuwait, besides the lack of a formally validated instrument. Therefore, our study was aimed at filling this gap of knowledge.
Materials and methods
Psychological instrument
The NMP-Q by Yildirim and Correia2 was translated from English into Arabic language using a classical three-stage “backward and forward” procedure. In the first step, two bilingual translators, whose mother tongue was Arabic, independently translated the NMP-Q from English into Arabic language (the so-called forward translation). During the second stage, the two translators and a third person (a recording observer) compared and synthesized the two translations, producing a unique merged version (the so-called interim Arabic version). In the third final phase, the interim Arabic version was then translated back into English independently by other two translators (the so-called backward translation). It should be emphasized that all the translators involved in this procedure were not aware of the original English version and had no specific medical/psychiatric skills or a psychological background.
During a subsequent step, specialists in psychology (EMAB, HK, AW), psychiatry (RZ), and clinical anthropology (TSR, NLB) were involved in the validation of the translated questionnaire, who provided their feedback as experts in the field.
The instrument was then administered, along with a general questionnaire, which included basic sociodemographic information (age and gender). The administration was pilot-tested in a small sample of 20–30 subjects to verify the readability and understandability of the questionnaire.
NMP-Q is a 20-item questionnaire using a 7-point Likert scale ranging from 1 (“strongly disagree”) to 7 (“strongly agree”), with good psychometric properties.2–7 The total score ranges from 20 to 140; the higher the score, the more severe the nomophobia level.
Ethical clearance
All the procedures carried out in the present study have been conducted in accordance with the ethical standards of the 1964 Helsinki declaration and its subsequent amendments. Furthermore, the study protocol of the present research was reviewed and approved by the institutional research committee of the College of Education, Department of Educational Psychology, Kuwait University, Kuwait City, Kuwait.
All participants were informed about the aims of the present study; they fully understood the study purpose and all provided written, informed consent. Participation was on a voluntarily basis.
Statistical analysis
As a first step, descriptive statistics was performed in order to characterize the collected data, which, before any statistical handling and processing, were visually inspected for potential outliers. More in detail, continuous data were computed as means and SDs, while categorical data were expressed as percentages, where appropriate. Asymmetry/skewness and kurtosis were also computed for each item score. In particular, asymmetry/skewness and kurtosis values were deemed acceptable if they ranged from −2 to +2, in case of normal univariate data distribution.15
In order to investigate the factor structure of the translated questionnaire, first a confirmatory factor analysis (CFA) was performed in order to verity the fit of the original four-factor structure solution found by Yildirim and Correia.2 EQS software (version 6.3 for Windows; Multivariate Inc., Temple City, CA, USA) was utilized. A wide range of fit indices were calculated and reported and are as follows:
- Absolute indices or discrepancy indices (including the chi-squared and the maximum-likelihood [ML] chi-squared functions, the Bayesian Information Criterion [BIC])
- Residuals-based indices (the root mean square residual or RMR, the standardized RMR or SRMR, and the Steiger–Lind’s root mean square error of approximation or RMSEA)
- Tests comparing the target model with the null model or relative/incremental indices (like the Bentler–Bonett’s normed fit index or NFI; the Bentler–Bonett’s non-normed fit index or NNFI, known also as the Tucker–Lewis’s index or TLI; the Bentler’s comparative fit index or CFI; the Bollen’s incremental fit index or IFI)
- Information theory goodness-of-fit measures or predictive fit indices (like the Akaike information criterion or AIC [both of the models are based on log likelihood], the Joreskog’s goodness-of-fit index or GFI, and the Joreskog’s adjusted GFI or AGFI).
Concerning the cutoff and threshold values for discrepancy indices, the P-value associated with the chi-squared test and the ML chi-squared function should exceed 0.05 (that is to say, it should not be statistically significant). Further, the chi-squared values divided by the degrees of freedom value should be ideally less than 2.0. As far as the RMSEA is concerned, scholars like MacCallum et al16 and Steiger17 have suggested to use 0.01, 0.05, and 0.08 to indicate excellent, good, and mediocre fits, respectively. In general, values higher than 0.10 indicate poor fitting models. Hu and Bentler18 have recommended a value of RMSEA less than 0.06. For tests that compare the target model with the null model, the cutoff and threshold values of NFI should exceed 0.90 according to Byrne19 or 0.95 according to Schumacker and Lomax.20 The NNFI/TLI21 should be above 0.95 according to Hu and Bentler.18 A similar behavior should be observed for the Bollen’s IFI as well.22 CFI should exceed 0.95 according to Bentler23 and Hu and Bentler18 or 0.90 according to other scholars. For information theory goodness-of-fit measures, the cutoff and threshold values of GFI should be higher than 0.90 according to Byrne.19 Acceptable values of AIC should be ideally close to 0.
In case of unsatisfactory fit indices, an exploratory factor analysis (EFA) was carried out, using the principal component analysis (PCA) approach with varimax rotation with Kaiser normalization.24–27 Differently from CFA, “EFA relies on more flexible assumptions”.28 More in detail, EFA, in the case of culturally adapted tests, can be used “with three questions in mind: whether the adapted form of the test generates the same number of factors as the original version, whether the same scales load on the same factors, and whether the same variance is extracted … if the same number of factors gets approximately the same loadings from the same scales, and approximately the same variance is extracted, this is usually taken for evidence that the adapted form is equivalent to the original”.28 This approach was performed on the 20 items of the questionnaire. Varimax rotation was chosen because this technique minimizes factor complexity and at the same time maximizes the variance of factor loadings.
Different PCA runs were conducted. First, an exploratory PCA was performed on all items of the questionnaire without carrying out any rotation to 1) check whether PCA could be considered as an appropriate technique for the matrix by examining if the correlations among items were >0.30 and 2) control the factorability of the correlation matrix using Bartlett’s test of sphericity.29 In case of statistical significance, this test enables scholars to reject the null hypothesis (that is to say, all the correlations in the correlation matrix are zero and the matrix is an identity matrix).
The Kaiser–Meyer–Olkin (KMO) measure24,25 was calculated in order to quantitatively assess the sampling adequacy. Ideally, the KMO should be greater than 0.60 and is considered excellent if greater than 0.90. The likely number of factors was determined both 1) by computing the number of factors with eigenvalues greater than 1 and ii) by visually inspecting the scree plot.30
After checking the factor loadings, the items were deleted in cases of unsatisfactory loading (eg, values less than 0.45) or loading that conflicted with a sound and clear theoretical explanation. Different PCAs runs with varimax rotation with Kaiser normalization were, therefore, carried out iteratively until convergence was attained and a satisfactory, clearly interpretable solution was finally achieved.
Furthermore, cases of cross-loading were interpreted according to the criteria of salience and total amount of explained variance, with theoretical considerations also being taken into account.
Internal consistency and reliability were computed by calculating the Cronbach’s alpha coefficient for the scale and for each subscale/factor. In order to properly interpret the magnitude of the alpha coefficient, the following rule of thumb was used: the reliability/consistency was deemed excellent if the coefficient was greater than 0.9, good if the coefficient was in the range 0.8–0.9, acceptable if in the range 0.7–0.8, questionable or adequate if in the range 0.6–0.7, poor if in the range 0.5–0.6, and unacceptable if the coefficient was less than 0.5.
Overall score and all scores of each subscale were computed. Based on the overall score and considering the cutoff values proposed by Yildirim and Correia,2 participants were subdivided into subjects without nomophobia (NMP-Q score equal to 20), with mild (NMP-Q score in the range 21–60), and with moderate (NMP-Q score in the range 60–100) nomophobia, respectively. Finally, nomophobia level was considered severe if NMP-Q score was in the range 100–140.
Both univariate and multivariate regression analyses31 were conducted to shed light on the psychological/sociodemographic predictors of nomophobia.
All statistical analyses were performed using the commercial “Statistical Package for the Social Sciences” (SPSS for Windows, version 23.0; IBM, Armonk, NY, USA).
Correlation among subscales and the overall score was performed with Pearson’s correlation. The strength of correlation was measured using the rule of thumb proposed by Hinkle and collaborators: the correlation was deemed negligible if the r coefficient was in the range 0.00–0.30, low if 0.30–0.50, moderate if 0.50–0.70, high if 0.70–0.90, and very high if 0.90–1.00.
For all analyses, P-values less than 0.05 were considered to be statistically significant.
Results
A total of 530 subjects volunteered to take part in the study, equally distributed between males and females, and was based in Kuwait. Only 18 did not return complete data (96.6% completion rate) and, as such, 512 questionnaires were analyzed. The age of the participants was 21.62±4.33 years, whose median age was 20 years.
Scores reported for each item are shown in Table 1, while their means with SDs, kurtosis, and skewness are shown in Table 2. As it can be seen, asymmetry/skewness and kurtosis values were acceptable.
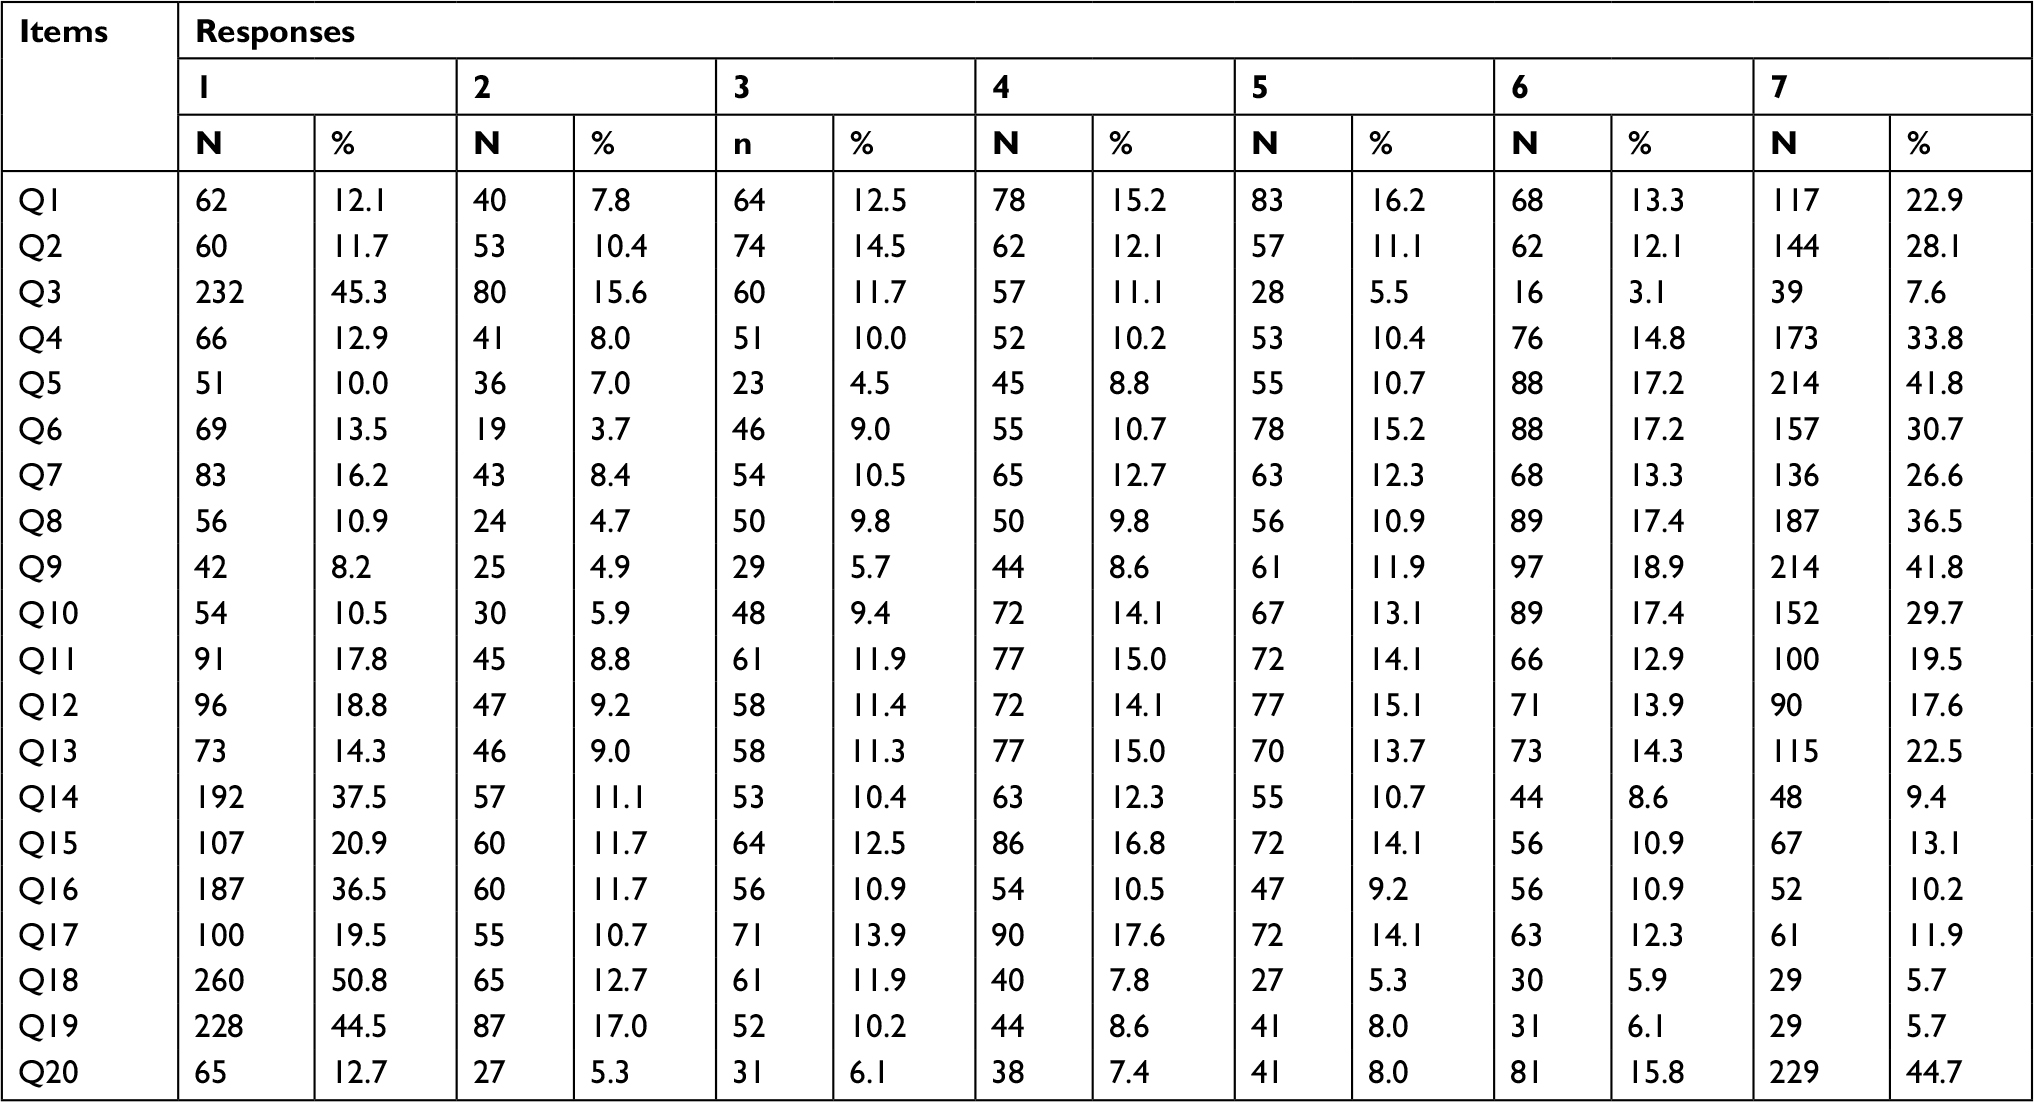 | Table 1 Nomophobia Questionnaire item-level summary statistics (n=512) Note: 1–7 refers to the 7-Likert scale of the questionnaire. |
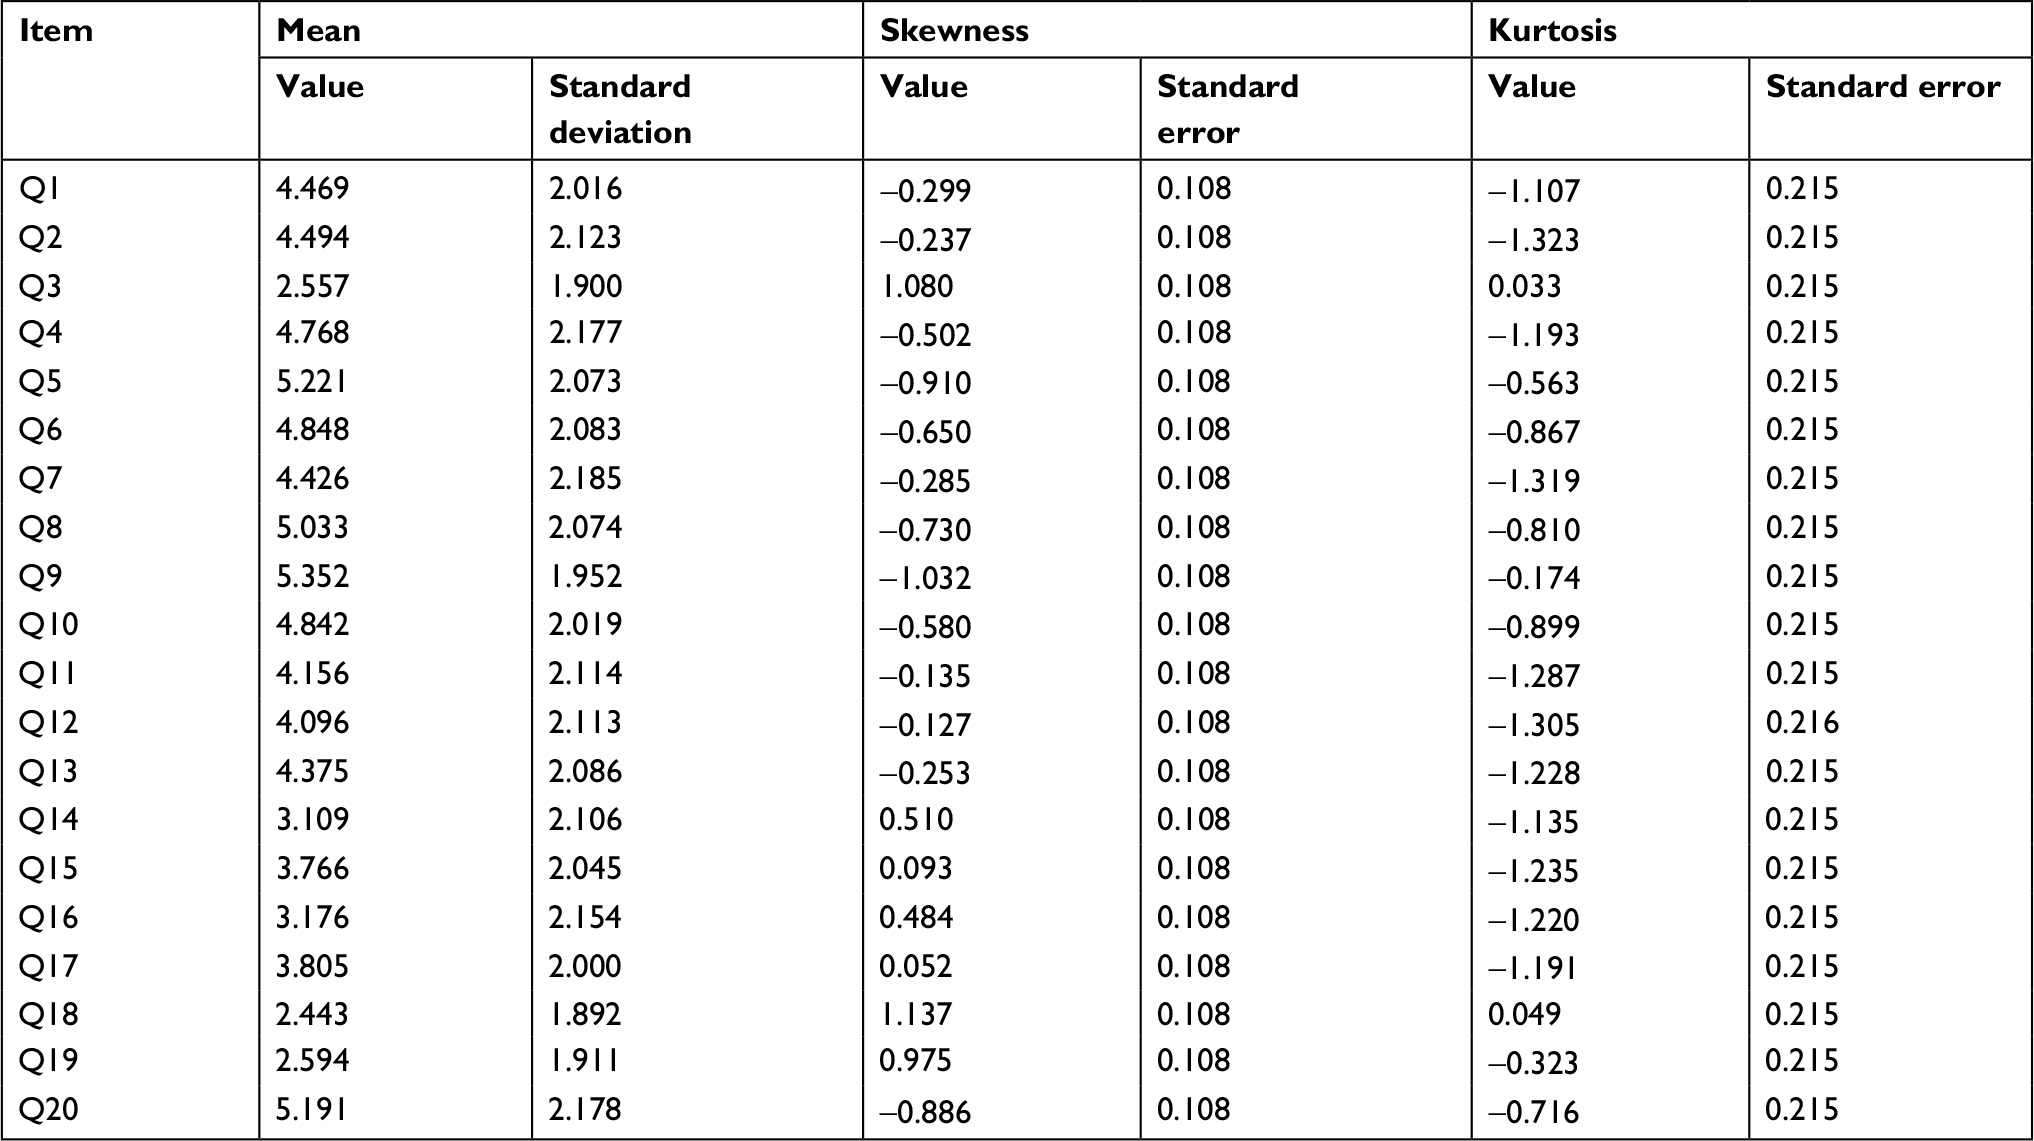 | Table 2 Descriptive statistics for each item of the Nomophobia Questionnaire |
As shown in Table 3 and as reported in Figures 1 and 2 (not standardized and standardized estimates, respectively), the fitting with the original solution found by Yildirim and Correia2 was not completely satisfactory. Therefore, we proceeded to the EFA.
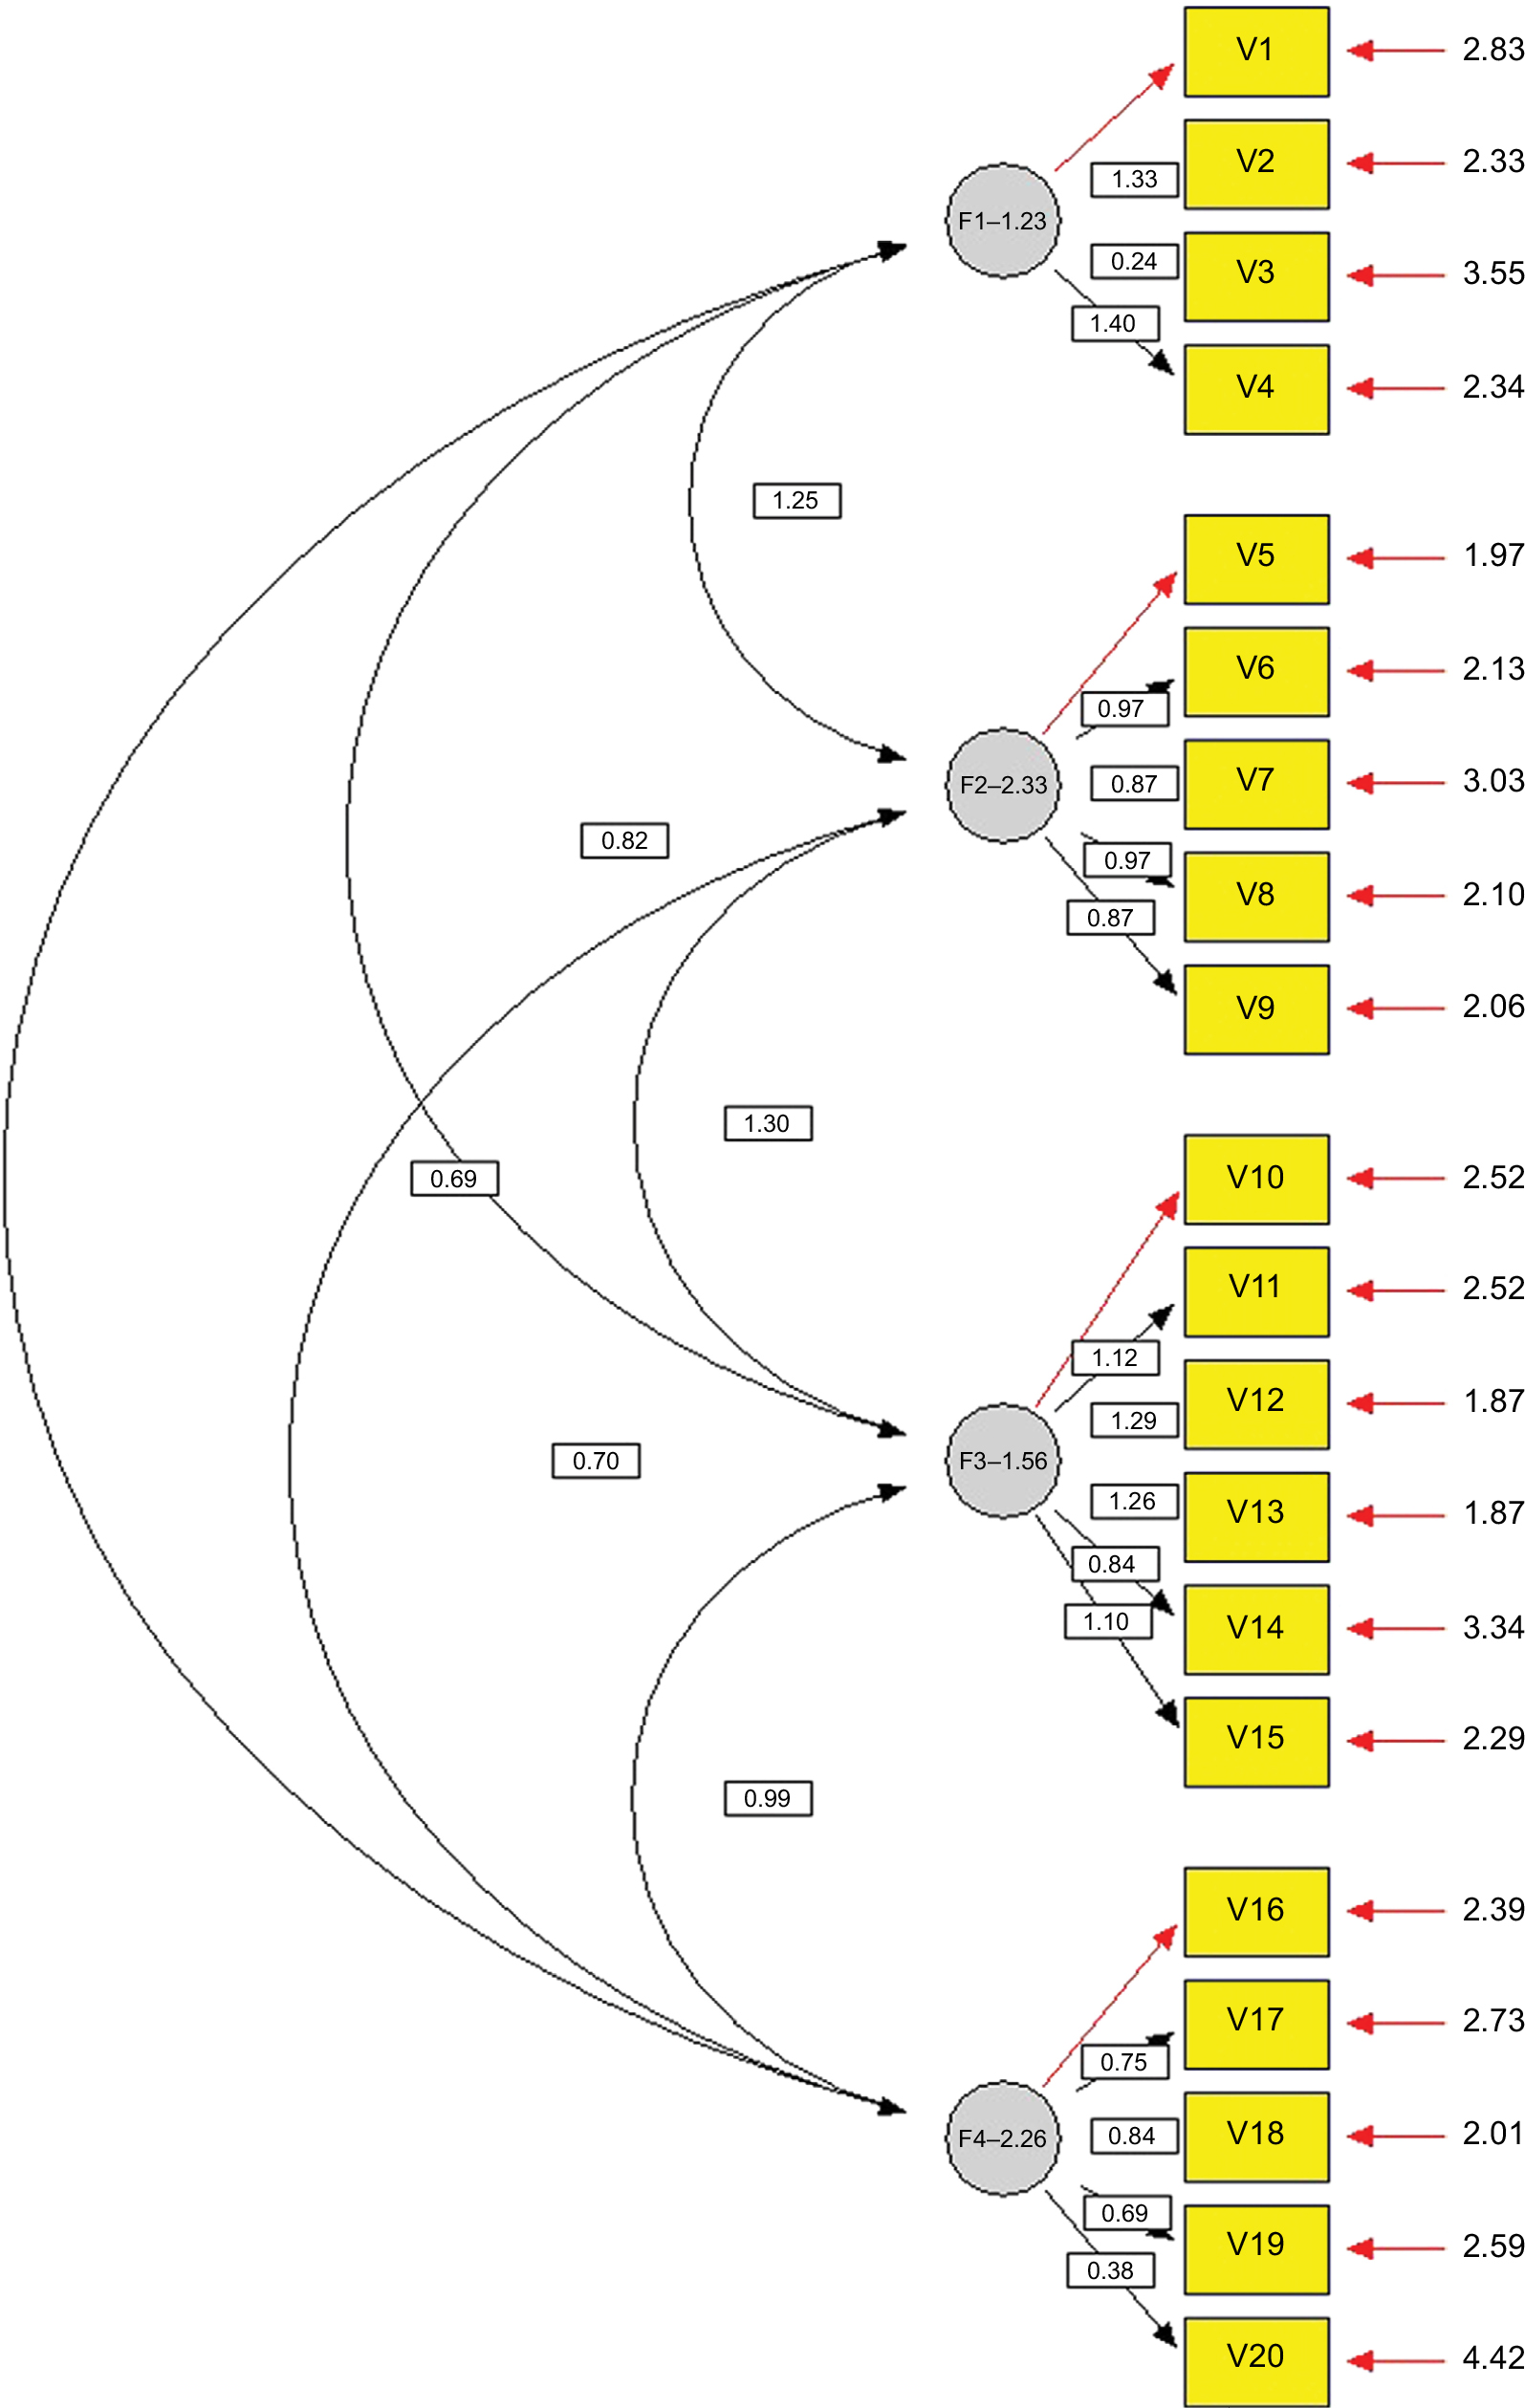 | Figure 1 Results from the confirmatory factor analysis: non-standardized estimates. |
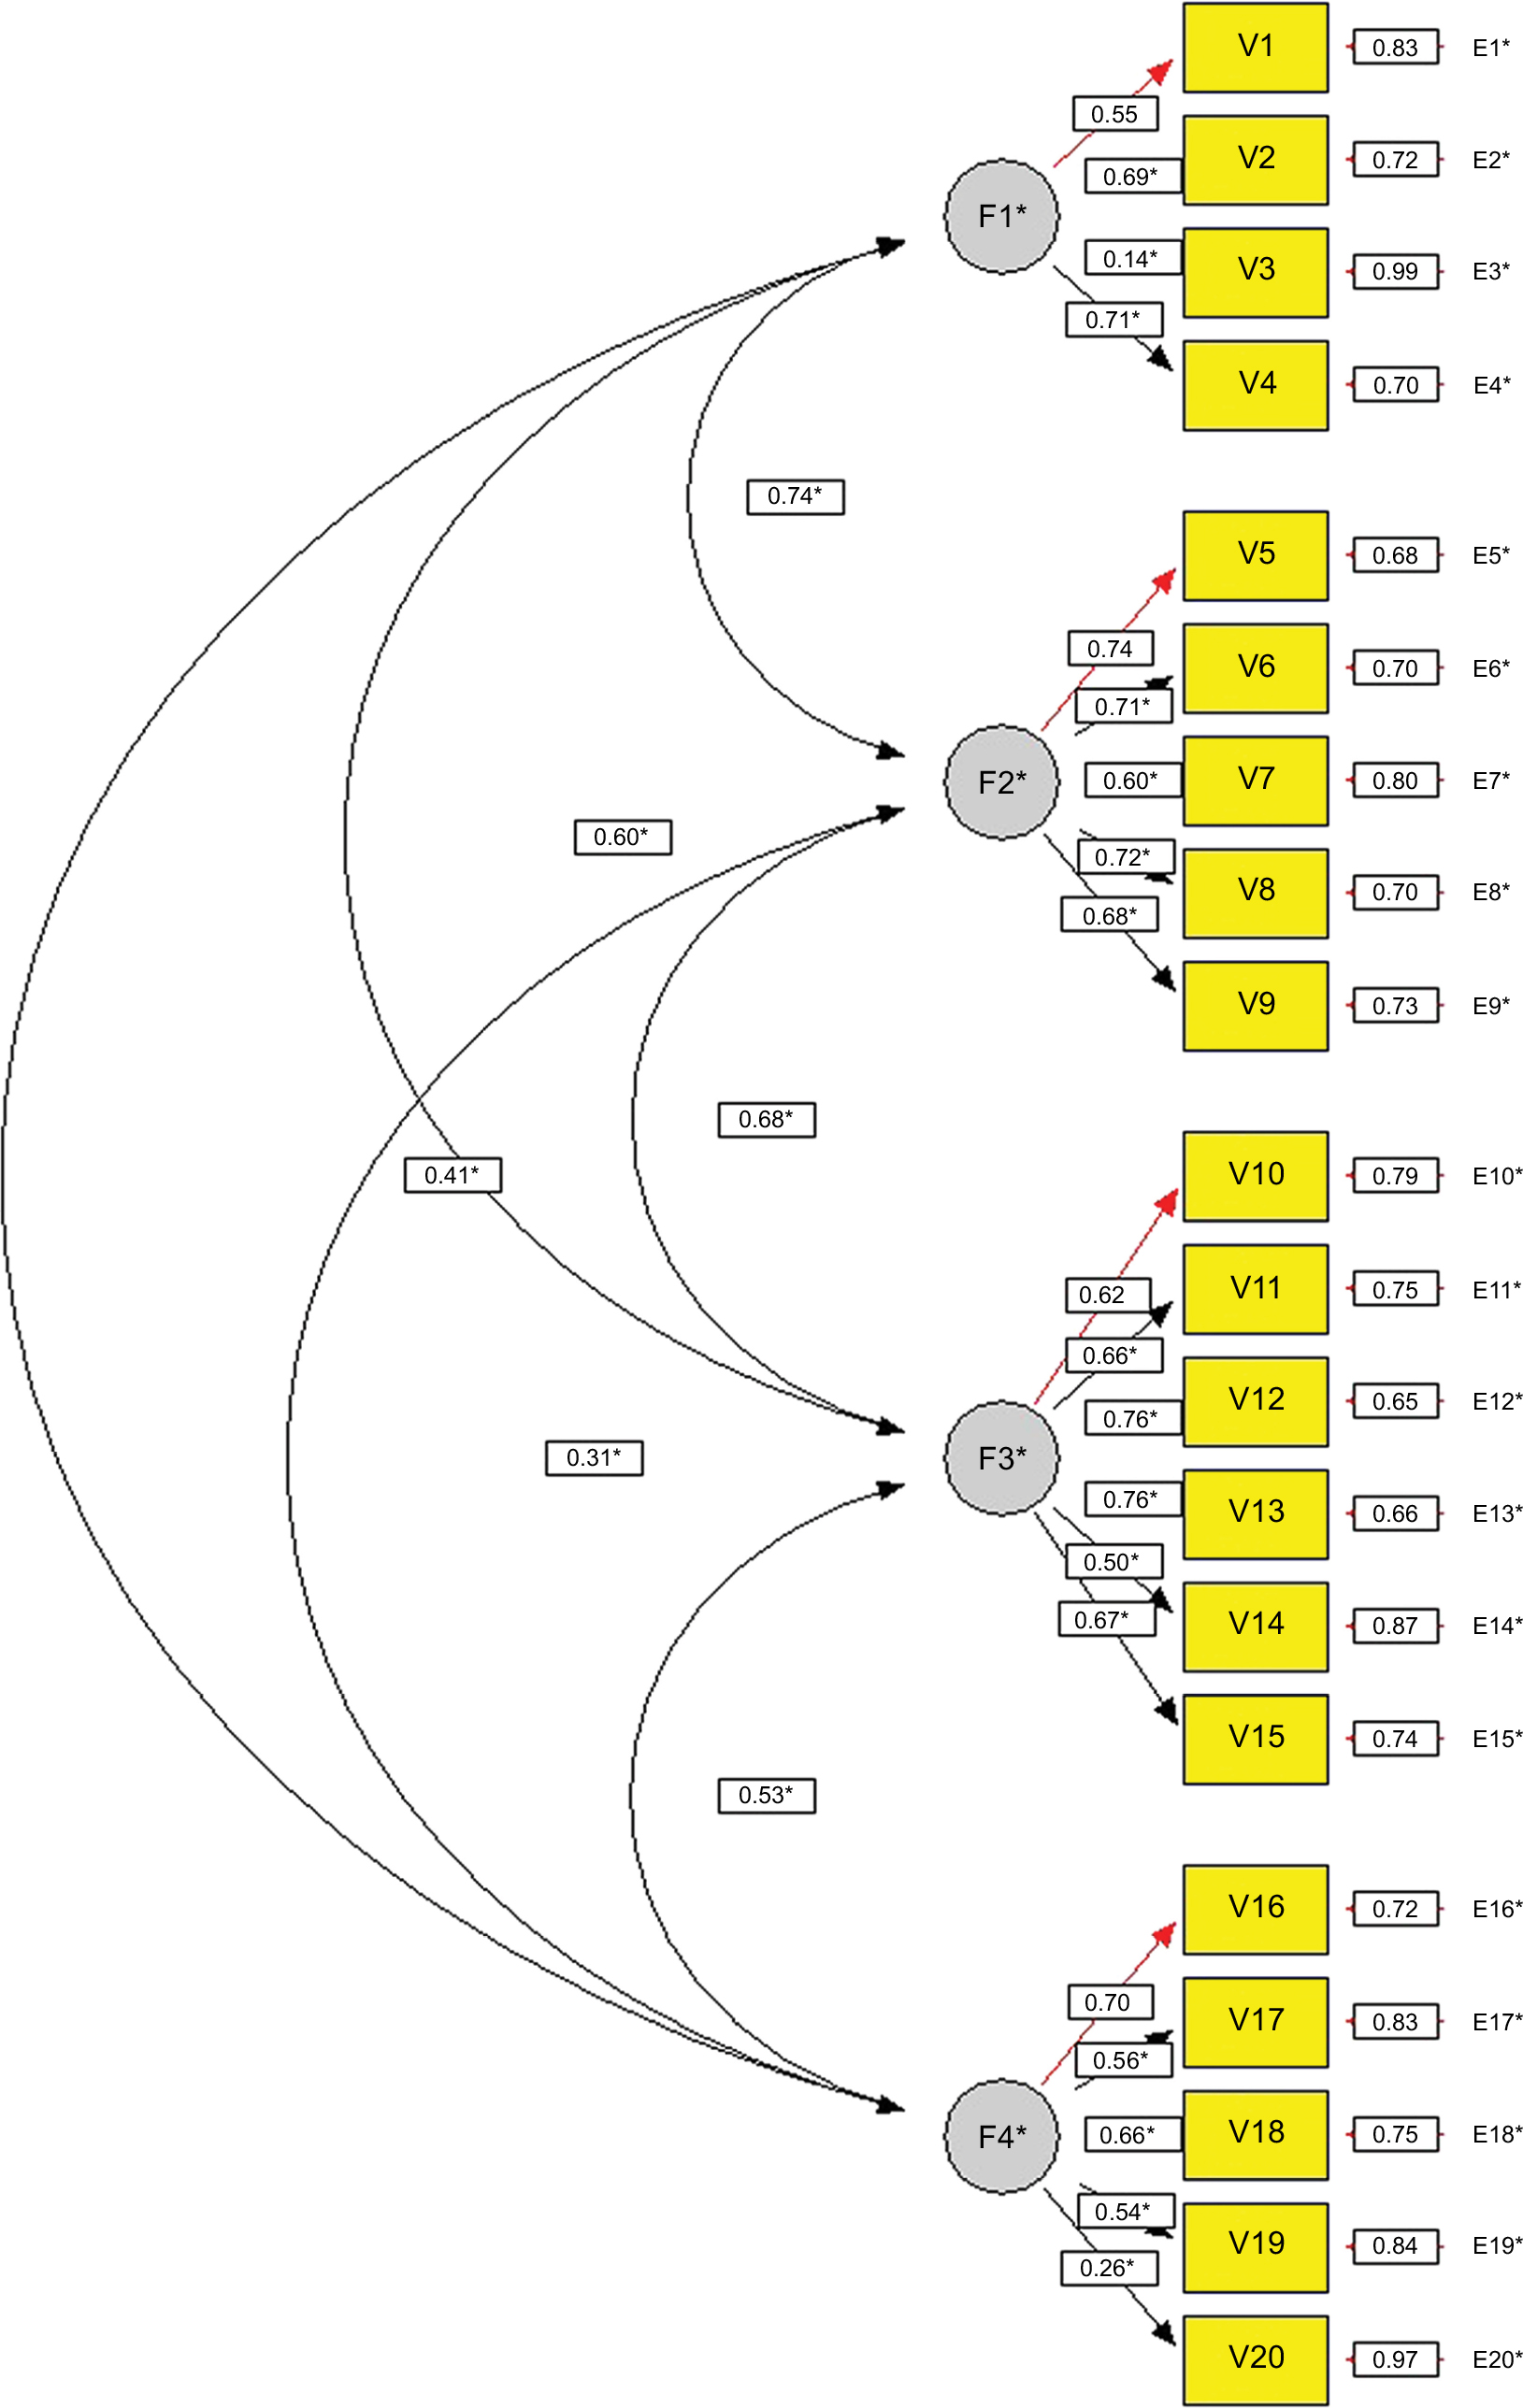 | Figure 2 Results from the confirmatory factor analysis: standardized estimates. Note: *Reference to the first item of the factor. |
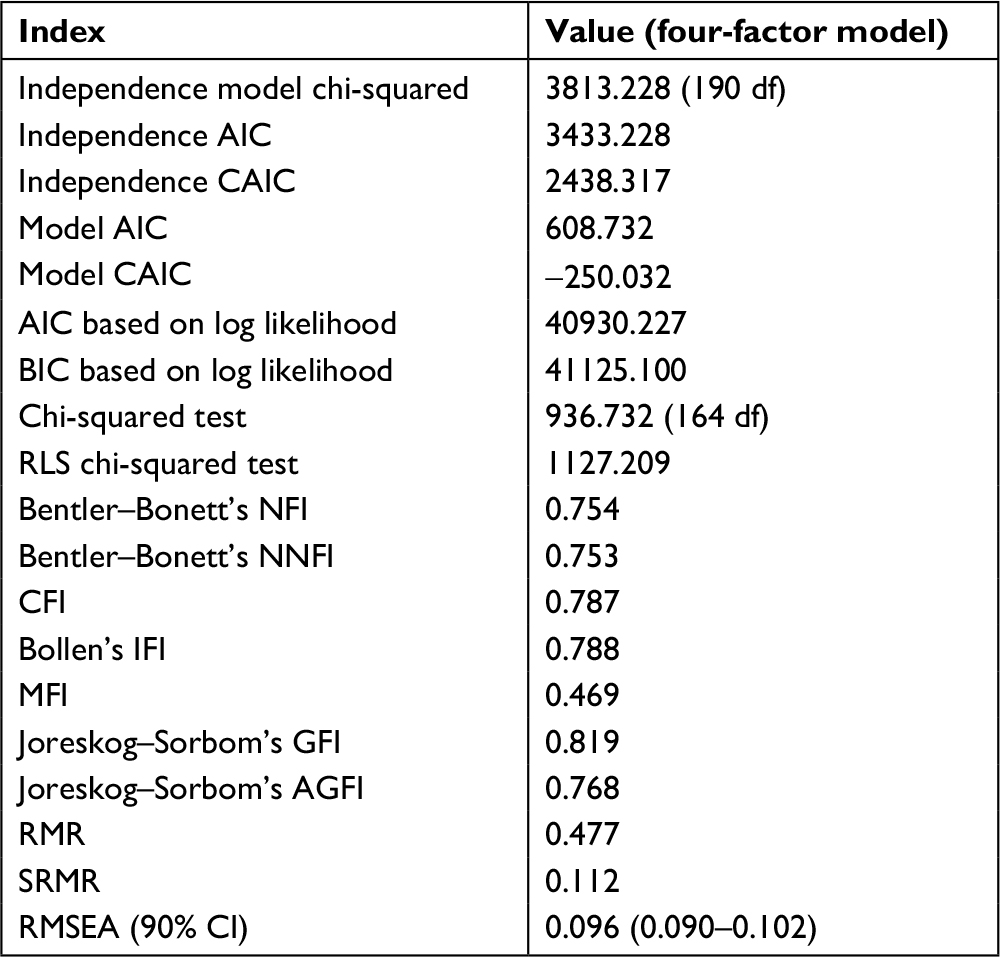 | Table 3 Confirmatory factor analysis (CFA) of the Nomophobia Questionnaire Abbreviations: AIC, Akaike information criterion; AGFI, adjusted goodness-of-fit index; BIC, Bayesian information criterion; CI, confidence interval; CFI, comparative fit index; CAIC, consistent Akaike information criterion; df, degrees of freedom; GFI, goodness-of-fit index; IFI, incremental fit index; MFI, Mcdonald’s fit index; NFI, normed fit index; NNFI, non-normed fit index; RLS, recursive least squares; RMR, root mean square residual; RMSEA, root mean square error of approximation; SRMR, standardized root mean square residual. |
Sampling adequacy as assessed by the KMO measure was 0.900 (excellent), with a statistically significant Bartlett’s sphericity test (chi-square=3,757.151, df=190). Taking into account the sample size and the KMO, we proceeded to the factor analysis.
From the EFA, both considering eigenvalues greater than 1.0 and visually inspecting the scree plot (Figure 3), four factors emerged explaining up to 57.24% of the variance: factor I, which comprised items 10, 11, 12, 13, and 15 (similar to factor I of the original version “not being able to communicate”, items 10, 11, 12, 13, 14, and 15); factor II, made up of items 3, 14, 16, 17, 18, and 19 (similar to original factor II “losing connectedness”, items 16, 17, 18, 19, and 20); factor III, comprising items 1 and 2 (similar to original factor III “not being able to access information”, items 1, 2, 3, and 4); and factor IV, comprising items 4, 5, 6, 7, 8, 9, and 20 (whereas the original factor IV “giving up convenience” comprised items 5, 6, 7, 8, and 9).
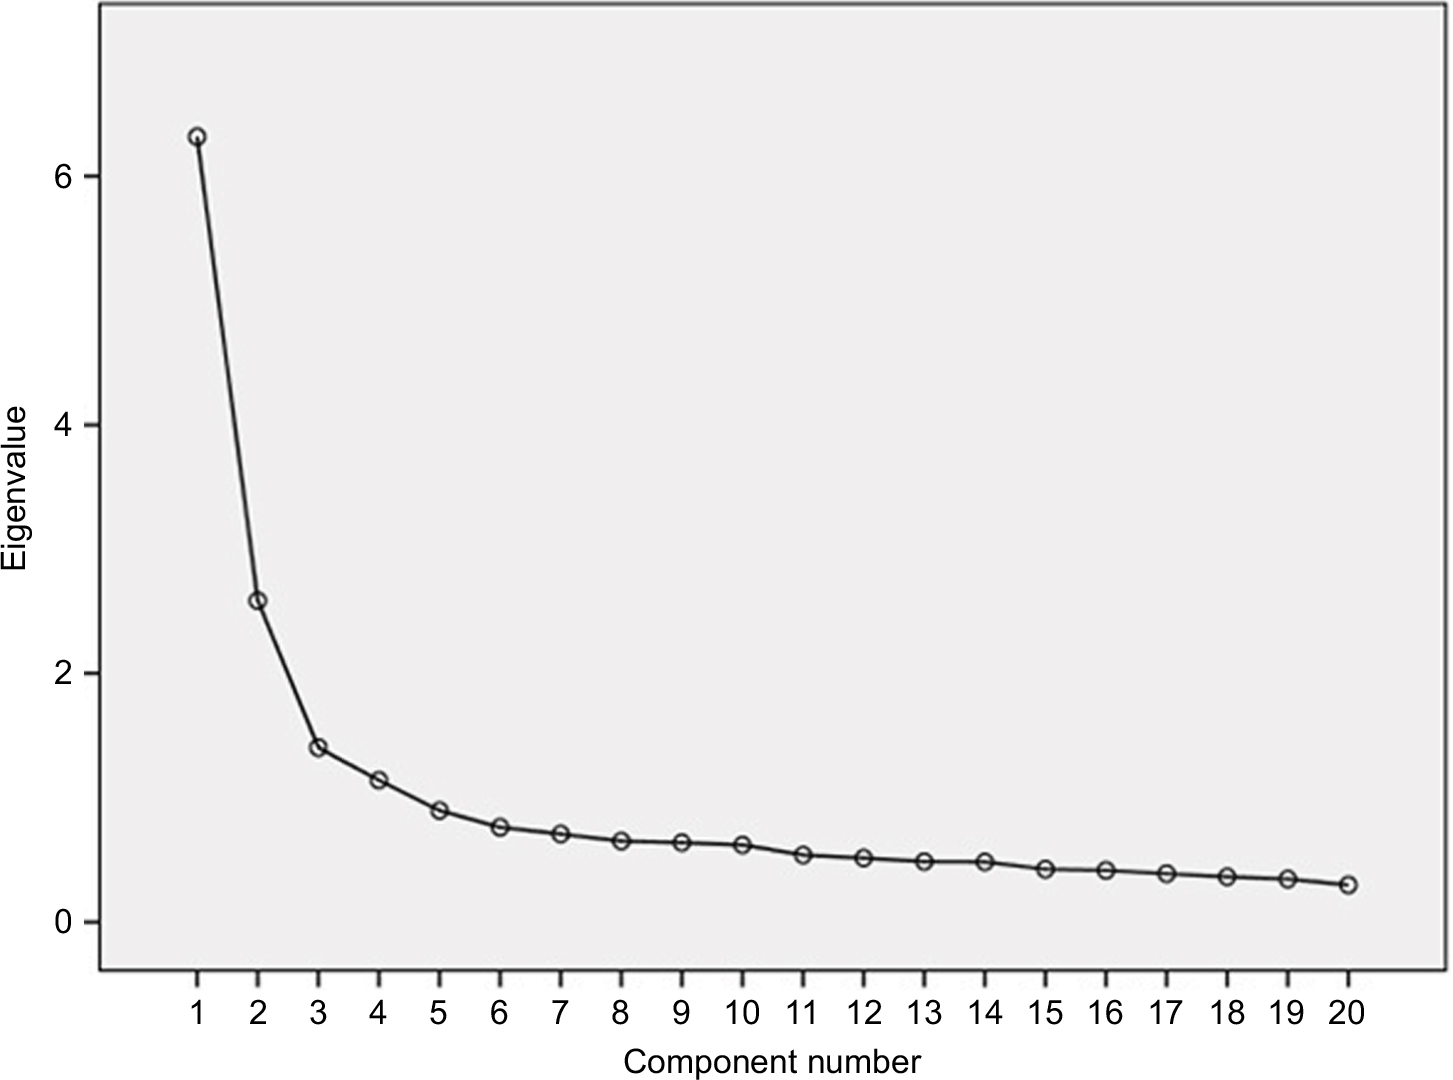 | Figure 3 Cattel’s scree plot of eigenvalues and factors. |
Before the rotation, factors I, II, III, and IV showed 31.59%, 12.92%, 7.02%, and 5.71% of variance, respectively. After the rotation, the same factors explained 18.73%, 15.58%, 14.24% and 8.68% of variance, respectively. Iteration was achieved after six runs of PCA.
Overall Cronbach’s alpha coefficient was 0.879 (good vs 0.945 [excellent] in the version by Yildirim and Correia).2 The coefficient increased from 0.645 (questionable or adequate for factor III vs 0.827 [good] in the original version) to 0.849 (good for factor IV vs 0.819 [good] in the original version). The coefficients of factors I and II were 0.821( good) and 0.749 (acceptable), respectively (vs 0.939 [excellent] and 0.874 [good] in the original version).
The effect of dropping an item on Cronbach’s alpha coefficient is shown in Table 4 for each item of the NMP-Q.
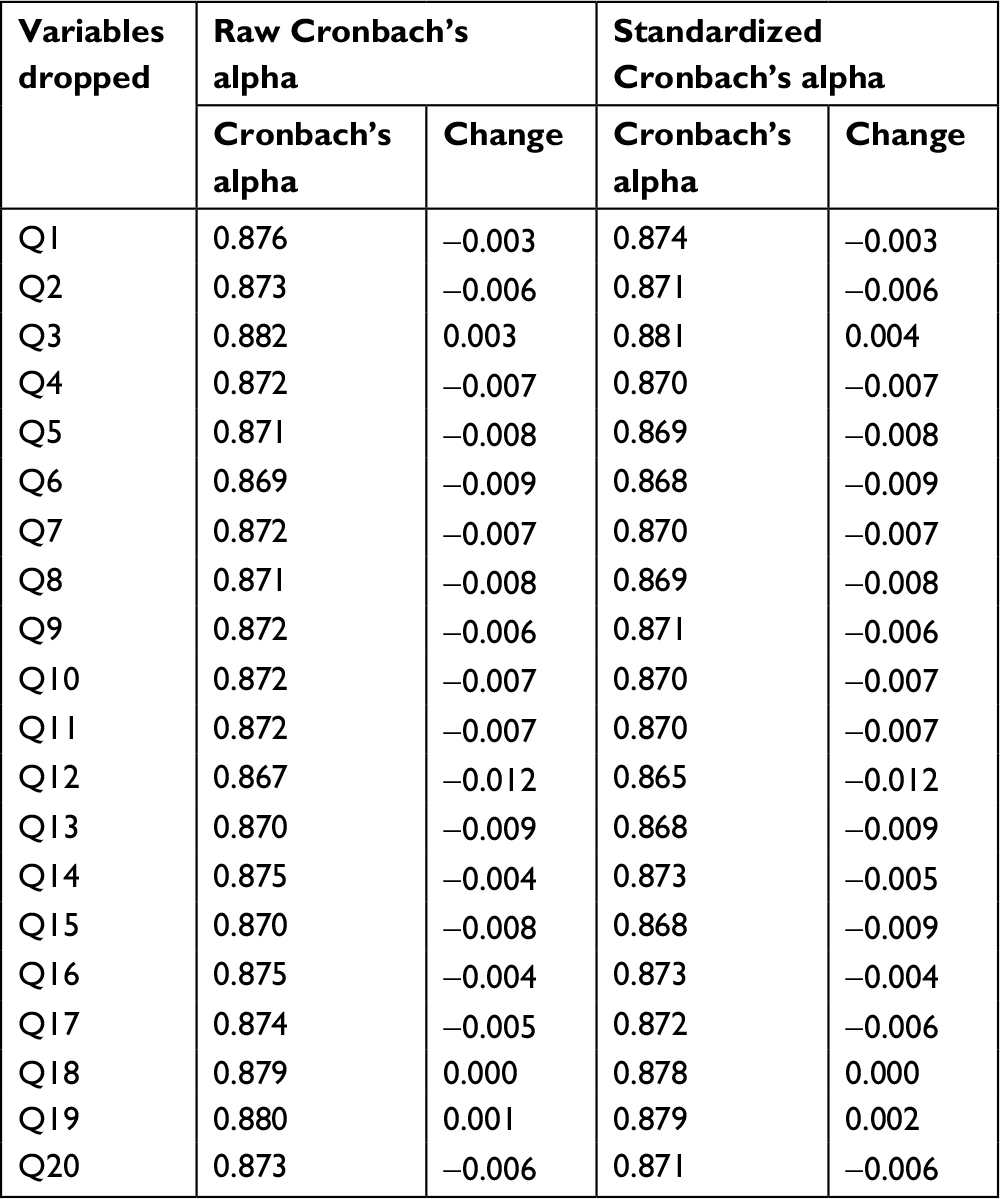 | Table 4 Effect of dropping an item on the Cronbach’s alpha coefficient |
Factor loadings were generally satisfactory (ie, values greater than 0.45), with the exception of two borderline loadings: items 3 “Being unable to get the news (eg, happenings, weather, etc.) on my smartphone would make me nervous” and 17 “If I did not have my smartphone with me, I would be uncomfortable because I could not stay up to date with social media and online networks” (Table 5).
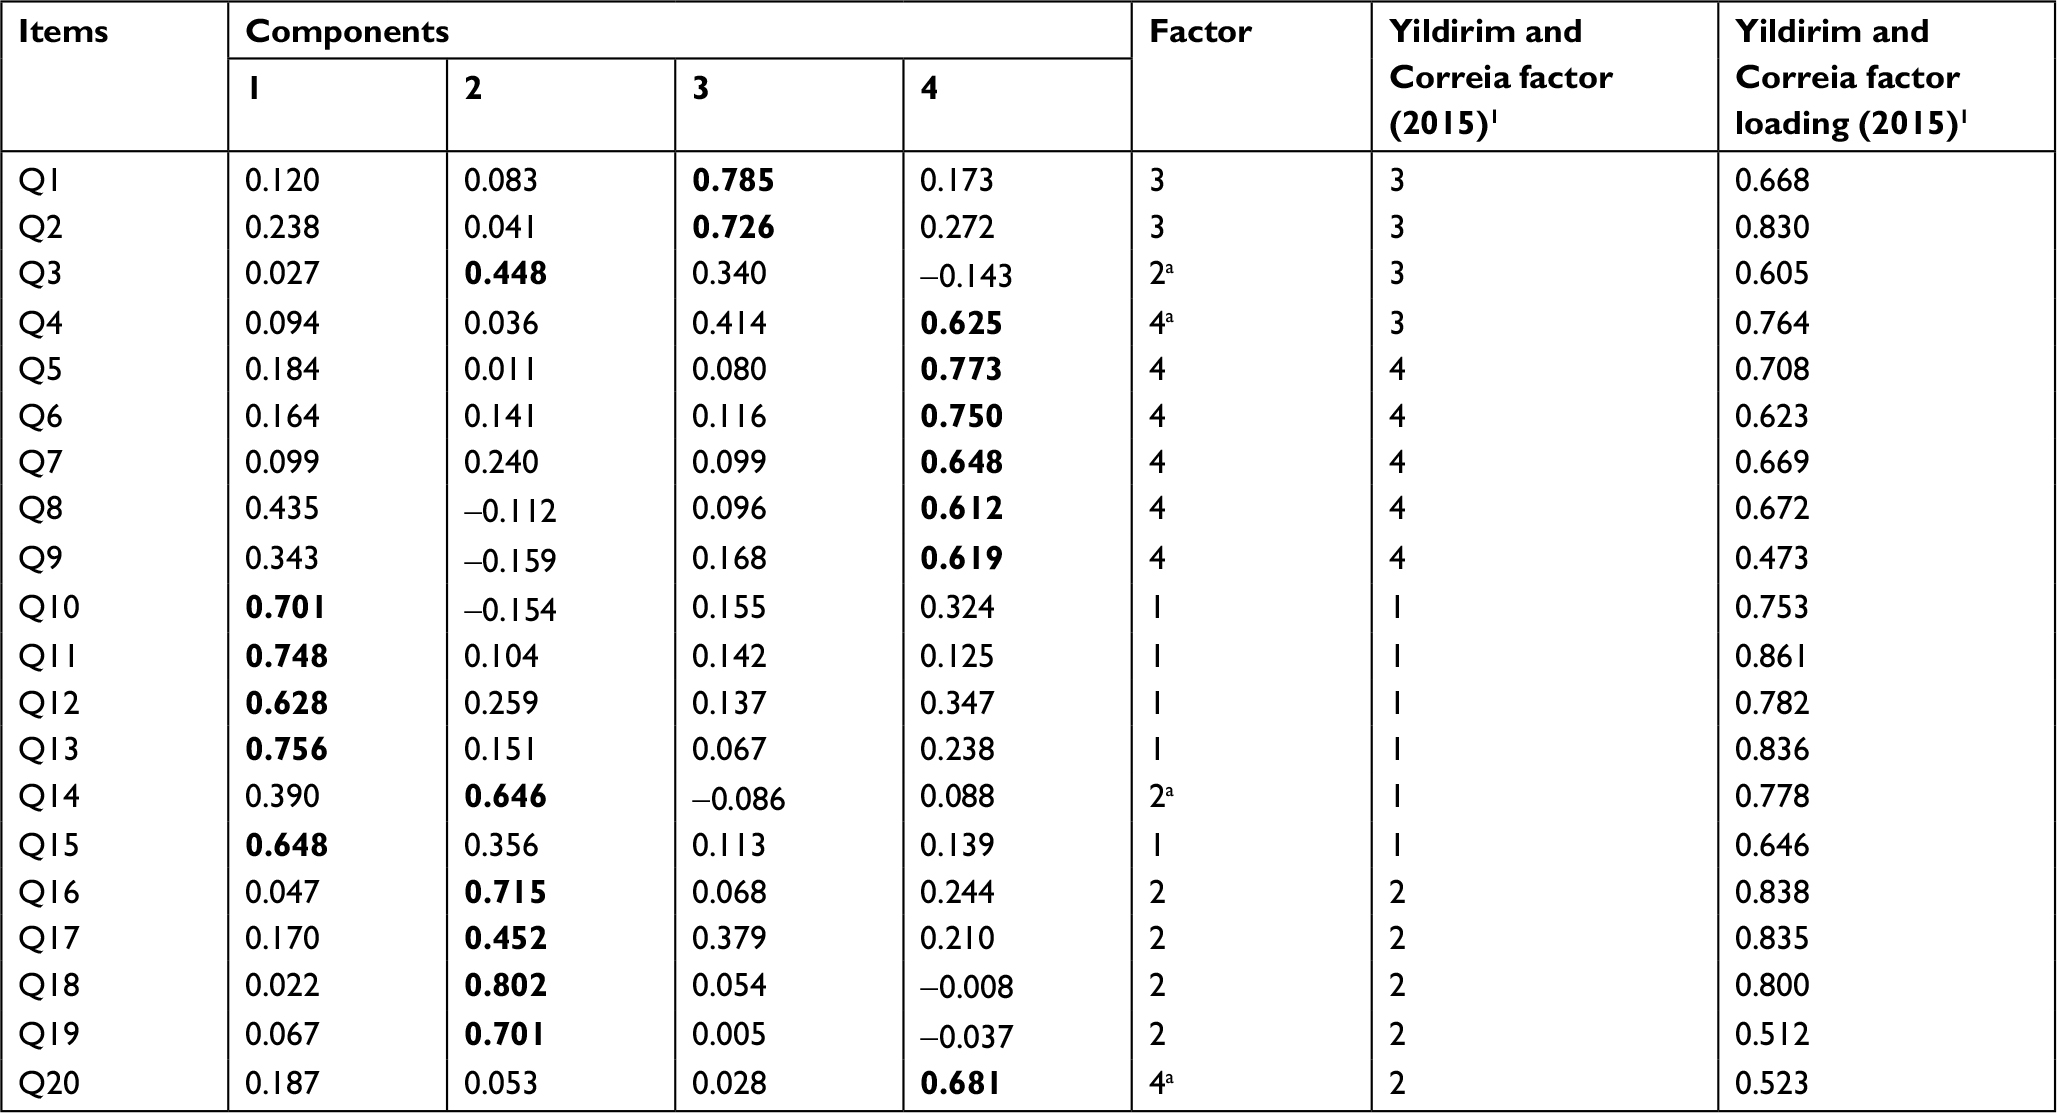 | Table 5 Exploratory factor analysis of the Nomophobia Questionnaire Notes: aItem inconsistencies between the adapted and original versions. Bold text represents the highest factor loading values. |
Scores (and mean scores) were 4.25±1.59 (21.23±7.95), 2.95±1.33 (17.68±7.97), 4.48±1.78 (8.96±3.56), and 4.98±1.52 (34.84±10.67) for factors I, II, III, and IV, respectively, whereas the overall score (and mean overall score) was 4.14±1.13 (82.71±22.68). Distribution of the overall scores reported by the participants is shown in Figure 4.
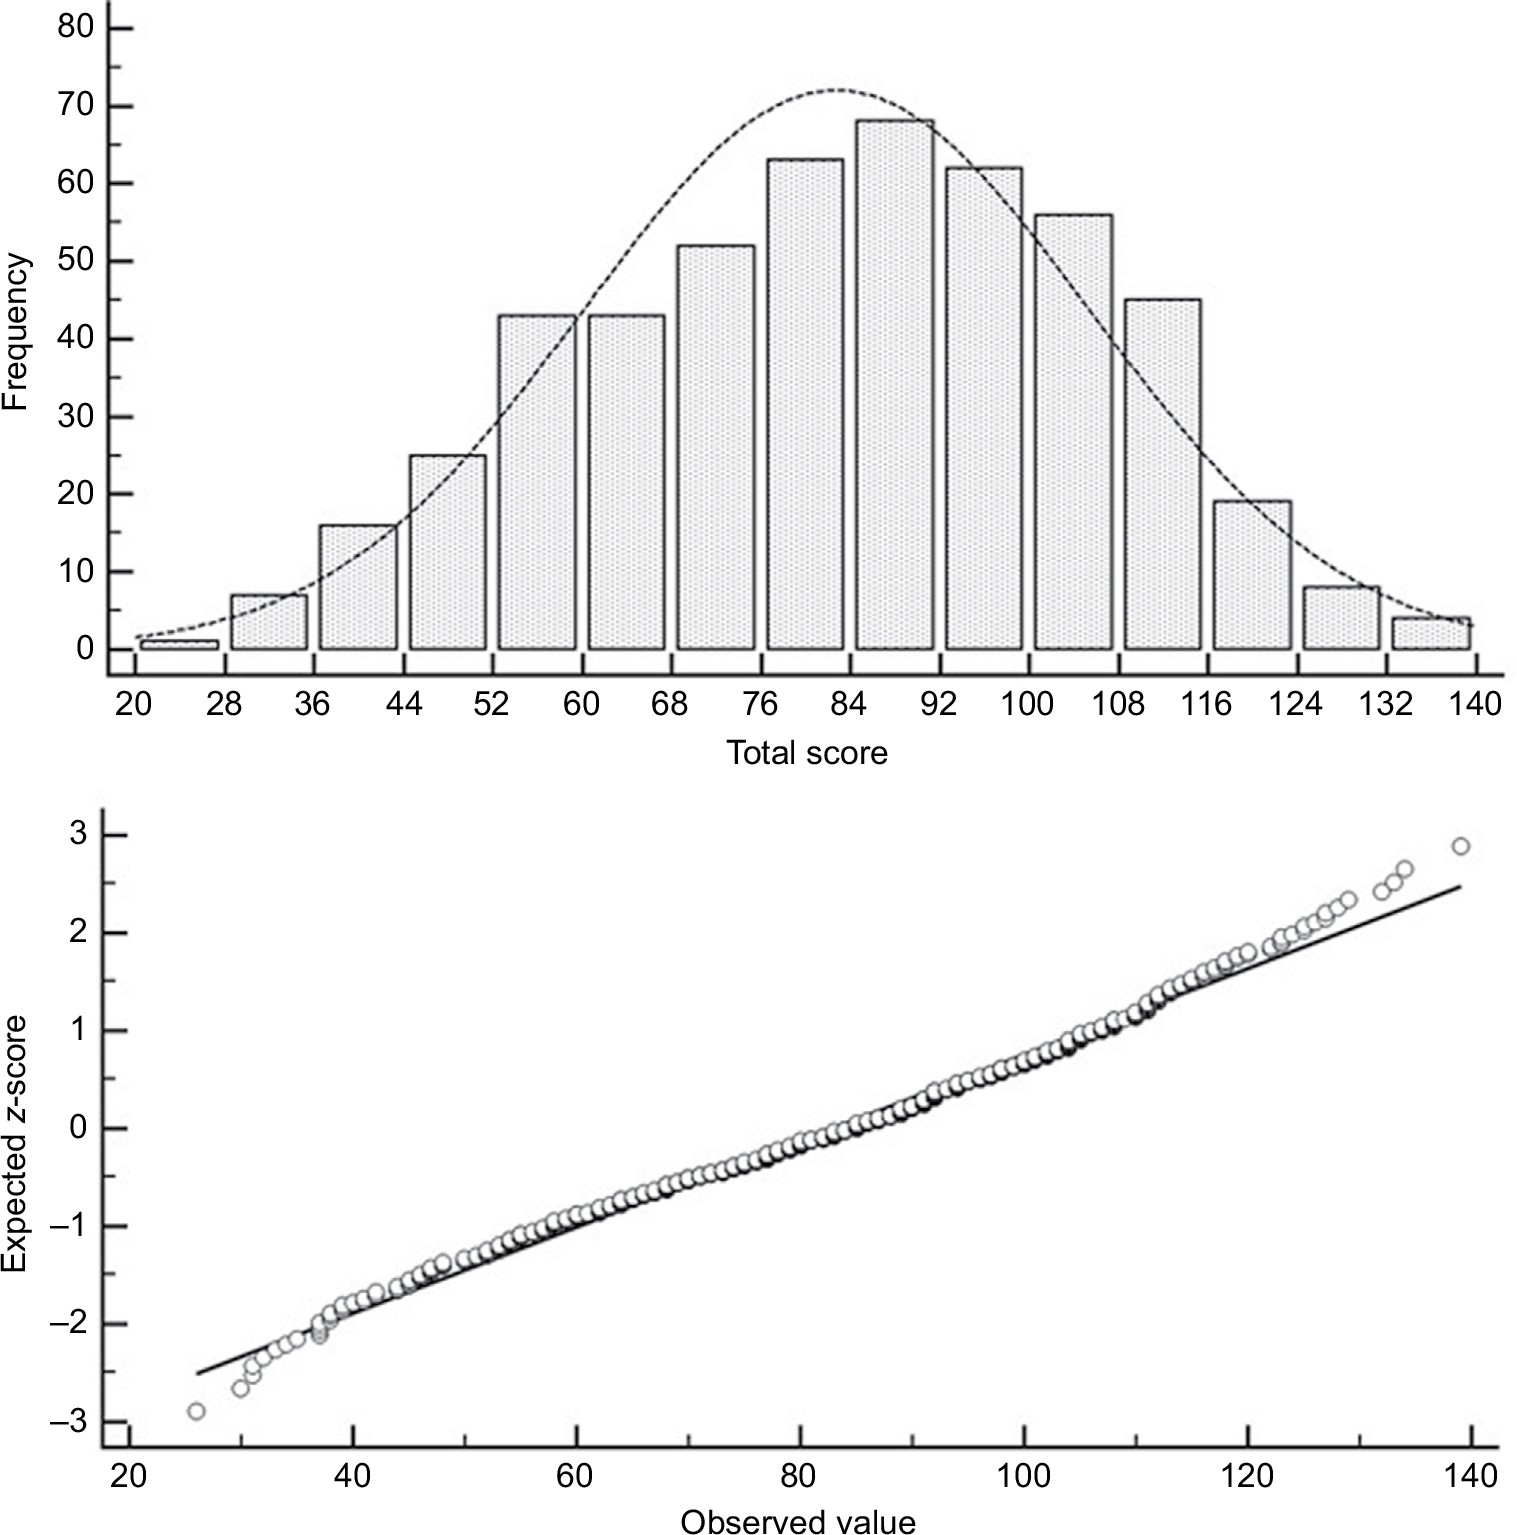 | Figure 4 Distribution of total score. |
Correlational analysis showed that correlations between factor I and factor II (r=0.391, P<0.0001) and factor III (r=0.415, P<0.0001) were low and moderate for factor IV (r=0.583, P<0.0001). Correlations between factor II and factor III (r=0.262, P<0.0001) and factor IV (r=0.228, P<0.0001) were negligible. Correlation between factor III and factor IV was found to be low (r=0.463, P<0.0001), whereas correlations between the subscales and the overall score were high for factor I (r=0.827, P<0.0001) and factor IV (r=0.828, P<0.0001) and moderate for factor II (0.637, P<0.0001) and factor III (r=0.613, P<0.0001).
With regard to the cutoff values proposed by Yildirim and Correia,2 in our sample, no subject (0.0%) was without nomophobia, with 92 (18.0%) and 288 individuals (56.2%) reporting mild and moderate nomophobia levels, respectively. Approximately a quarter of the recruited sample (132 subjects, 25.8%) had severe nomophobia level.
Multivariate regression analysis showed that age (coefficient =0.070, standard error =0.233, rpartial =0.013, t=0.300, P=0.764) and gender (coefficient =7.963, standard error =22.754, rpartial =0.016, t=0.350, P=0.727) were not significant predictors of nomophobia (total score of the NMP-Q).
Similar results were obtained for each subscale, as well as for the univariate regression analyses.
Discussion
Using both CFA and EFA, our study has preliminarily validated the Arabic version of the NMP-Q and has shown that nomophobia results to be quite widespread among adolescents and young adults in Kuwait. To the best of our knowledge, this is the first study exploring nomophobic behavior and attitudes in Kuwait and is one of the few investigations performed in Arab countries.
While CFA did not show a completely satisfactory fitting with the original structure found by Yildirim and Correia,2 EFA enabled us to obtain a factor structure comparable with the original one. Even though there were some discrepancies, it reflected cultural issues underlying the phenomenon of nomophobia.
Generally, our scores were comparable with findings obtained by other scholars in similar or comparable contexts/settings9–12,14: our epidemiological figure of 25.8% subjects with severe nomophobia level is similar to the value (22.2%) found in the literature,11 even though our mean scores were significantly higher than those reported in the studies briefly mentioned in the introduction (P<0.0001), which warrants further investigations.
An important difference with respect to the literature is that we could not find any age- or gender-specific effect on nomophobia. As such, further studies are needed to replicate in a systematic and thorough way the predictors of nomophobia among Arabic subjects.
Limitations of the study
Our study, despite some strengths (including the novelty, the formal statistical rigor, and the sample size utilized), has some shortcomings that should be properly acknowledged. The major drawbacks include the nonrandom nature of the sample and the cross-sectional study design. A longitudinal survey could capture the psychological determinants underlying the nomophobic behavior and attitudes in a more refined and unbiased way, instead of taking a static snapshot of the context.
Finally, despite our confirmation of the similar structure of the two models found with CFA and EFA, respectively, and discrepancies/inconsistencies with the original structure concerning few items (potentially due to cultural issues), this still remains an exploratory study relying on the survey research method and data-driven aspects. In order to overcome these shortcomings and to acquire the features of predictability and validity, prospective studies should be performed with the gold standard of factors identification, stability, and replicability. If so, factor structures of different populations/groups can be better compared and the diagnostic/prognostic value of the questionnaire can be discussed more.
Conclusion
In the digital era of ICTs, nomophobia is a modern, emerging, situational, mobile phone-related phobia. The Arabic version of the NMP-Q by Yildirim and Correia2 was validated and its psychometric properties were examined in depth. A four-factor structure emerged, well reproducing factor structure found in the original study.
Even though some inconsistencies were found compared with the original solution, the Arabic NMP-Q proved to be consistent and reliable and, as such, can be utilized by researchers. Further studies are needed to assess the consistency of the NMP-Q in other samples (either general or clinical), and to investigate comorbidities and psychosocial predictors of nomophobia using a confirmatory approach (such as a Rasch model) to obtain statistically more robust and predictive results.
Moreover, the relationship of nomophobia with other psychopathologies and ICT-related psychological disorders (such as phubbing, surfing the Internet, or smartphone addiction) also warrants further investigations, as well as the potential impact of nomophobia on mobile learning and education, given the importance of these educational techniques and approaches in the Arab countries.
Disclosure
The authors report no conflicts of interest in this work.
References
Yildirim C, Correia A.P. Exploring the dimensions of nomophobia: development and validation of a self-reported questionnaire. Comput Human Behav. 2015;49:130–137. | ||
Bragazzi NL, del Puente G. A proposal for including nomophobia in the new DSM-V. Psychol Res Behav Manag. 2014;7:155–160. | ||
Yildirim C, Sumuer E, Adnan M, Yildirim S. A growing fear: prevalence of nomophobia among Turkish college students. Information Development. 2016;32(5):1322–1331. | ||
Gutiérrez-Puertas L, Márquez-Hernández VV, Aguilera-Manrique G. Adaptation and Validation of the Spanish Version of the Nomophobia Questionnaire in Nursing Studies. Comput Inform Nurs. 2016;34(10):470–475. | ||
González-Cabrera J, León-Mejía A, Pérez-Sancho C, Calvete E. Adaptation of the Nomophobia Questionnaire (NMP-Q) to Spanish in a sample of adolescents. Actas Esp Psiquiatr. 2017;45(4):137–144. | ||
Adawi M, Bragazzi NL, Argumosa-Villar L, et al. Translation and Validation of the Nomophobia Questionnaire in the Italian Language: Exploratory Factor Analysis. JMIR Mhealth Uhealth. 2018; 6(1):e24. | ||
Lin CY, Griffiths MD, Pakpour AH. Psychometric evaluation of Persian Nomophobia Questionnaire: differential item functioning and measurement invariance across gender. J Behav Addict. 2018;7(1):100–108. | ||
Prasad M, Patthi B, Singla A, et al. Nomophobia: A Cross-sectional Study to Assess Mobile Phone Usage among Dental Students. J Clin Diagn Res. 2017;11(2):ZC34–ZC39. | ||
Alosaimi FD, Alyahya H, Alshahwan H, Al Mahyijari N, Shaik SA. Smartphone addiction among university students in Riyadh, Saudi Arabia. Saudi Med J. 2016;37(6):675–683. | ||
Aljomaa SS, Al.Qudah MF, Albursan IS, Bakhiet SF, Abduljabbar AS. Smartphone addiction among university students in the light of some variables. Comput Human Behav. 2016;61:155–164. | ||
Alahmari MS, Alfaifi AA, Alyami AH. Prevalence and Risk Factors of Nomophobia among Undergraduate Students of Health Sciences Colleges at King Khalid University, Abha, Saudi Arabia. Int J Med Res Prof. 2018;4(1):429–432. | ||
Kateb SA. The prevalence and psychological symptoms of nomophobia among university students. Journal of Research in Curriculum Instruction and Educational Technology. 2017;3(3):155–182. | ||
The Central Agency for Information Technology. Consolidated Kuwait national ICT indicators report; 2016. Available from: https://www.e.gov.kw/sites/kgoarabic/Forms/FinalConsolidatedEnglishReportSinglePages.pdf | ||
Field survey of 500 students. Mobile phone uses for Kuwait University students. Moible phones use directly increases traffic accidents. 2008. Available from: https://www.moi.gov.kw/portal/varabic/storage/other/7-%20traffic%20study.pdf. | ||
George D, Mallery M. SPSS for Windows Step by Step: A Simple Guide and Reference, 17.0 Update. 10th ed. Boston, MA: Pearson; 2010. | ||
Maccallum RC, Browne MW, Sugawara HM. Power analysis and determination of sample size for covariance structure modeling. Psychol Methods. 1996;1(2):130–149. | ||
Steiger JH. Point Estimation, Hypothesis Testing, and Interval Estimation Using the RMSEA: Some Comments and a Reply to Hayduk and Glaser. Structural Equation Modeling: A Multidisciplinary Journal. 2000;7(2):149–162. | ||
LT H, Bentler PM. “Evaluating model fit”. In: Hoyle RH, editor. Structural Equation Modeling: Concepts, Issues, and Applications. Thousand Oaks, CA: Sage; 1995:76–99. | ||
Byrne BM. Structural Equation Modeling with EQS and EQS/Windows. Thousand Oaks, CA: Sage; 1994. | ||
Schumacker RE, Lomax RG. A Beginner’s Guide to Structural Equation Modeling. 2nd ed. Mahwah, NJ: Lawrence Erlbaum Associates; 2004. | ||
Tucker LR, Lewis C. A reliability coefficient for maximum likelihood factor analysis. Psychometrika. 1973;38(1):1–10. | ||
Bollen KA. Structural Equations with Latent Variables. New York: Wiley; 1989. | ||
Bentler PM. Comparative fit indexes in structural models. Psychol Bull. 1990;107(2):238–246. | ||
Childs D. The Essentials of Factor Analysis. Holt: Rinehart and Winston; 1970. | ||
Hinkle DE, Wiersma W, Jurs SG. Applied Statistics for the Behavioral Sciences. 5th ed. Boston, MA: Houghton Mifflin; 2003. | ||
Fleming JS. Computing measures of simplicity of fit for loadings in factor-analytically derived scales. Behav Res Methods Instrum Comput. 2003;35(4):520–524. | ||
Fleming JS, Kaiser HF. Computing measures of simplicity of fit for loadings in factor-analytically derived scales. Behav Res Methods Instrum Comput. 2003;35(4):520–524. | ||
Iliescu D. Adapting Tests in Linguistic and Cultural Situations. New York: Cambridge University Press; 2017. | ||
Bartlett MS. A note on multiplying factors for various chi square approximations. J R Stat Soc. 1954;16(Series B):296–298. | ||
Cattell RB. The scree test for the number of factors. Multivariate Behav Res. 1966;1(2):245–276. | ||
Tabachnick BG. Using Multivariate Statistics. London: Pearson; 2013. |
 © 2018 The Author(s). This work is published and licensed by Dove Medical Press Limited. The
full terms of this license are available at https://www.dovepress.com/terms
and incorporate the Creative Commons Attribution
- Non Commercial (unported, 3.0) License.
By accessing the work you hereby accept the Terms. Non-commercial uses of the work are permitted
without any further permission from Dove Medical Press Limited, provided the work is properly
attributed. For permission for commercial use of this work, please see paragraphs 4.2 and 5 of our Terms.
© 2018 The Author(s). This work is published and licensed by Dove Medical Press Limited. The
full terms of this license are available at https://www.dovepress.com/terms
and incorporate the Creative Commons Attribution
- Non Commercial (unported, 3.0) License.
By accessing the work you hereby accept the Terms. Non-commercial uses of the work are permitted
without any further permission from Dove Medical Press Limited, provided the work is properly
attributed. For permission for commercial use of this work, please see paragraphs 4.2 and 5 of our Terms.