Back to Journals » International Journal of Nanomedicine » Volume 13
Protection of silver nanoparticles using Eysenhardtia polystachya in peroxide-induced pancreatic β-Cell damage and their antidiabetic properties in zebrafish
Authors Garcia Campoy AH ![]() , Perez Gutierrez RM
, Perez Gutierrez RM ![]() , Manriquez-Alvirde G, Muñiz Ramirez A
, Manriquez-Alvirde G, Muñiz Ramirez A ![]()
Received 25 January 2018
Accepted for publication 3 March 2018
Published 1 May 2018 Volume 2018:13 Pages 2601—2612
DOI https://doi.org/10.2147/IJN.S163714
Checked for plagiarism Yes
Review by Single anonymous peer review
Peer reviewer comments 2
Editor who approved publication: Dr Thomas Webster
Abraham Heriberto Garcia Campoy,1 Rosa Martha Perez Gutierrez,1 Gabriela Manriquez-Alvirde,2 Alethia Muñiz Ramirez3
1Laboratorio de Investigación de Productos Naturales, Escuela Superior de Ingenieria Quimica e Industrias extractivas IPN, Unidad Profesional Adolfo Lopez Mateos, Mexico City, Mexico; 2Universidad Autonoma Metropolitana, Mexico City, Mexico; 3CONACYT-IPICYT/CIIDZA, San Luis Potosí, México
Background: The aim was to explore the efficacy of extract of Eysenhardtia polystachya-loaded silver nanoparticles (EP/AgNPs) on pancreatic β cells, INS-1 cells, and zebrafish as a valuable model for the study of diabetes mellitus.
Materials and methods: EP/AgNPs were synthesized using methanol/water bark extract of E. polystachya and characterized using various physicochemical techniques.
Results: Immersion of adult zebrafish in 111 mM glucose solution resulted in a sustained hyperglycemic, hyperlipidemic state, and serum insulin levels decreased. The synthesized EP/AgNPs showed an absorption peak at 413 nm on ultraviolet–visible spectroscopy, revealing the surface plasmon resonance of the nanoparticles. Transmission electron microscopy indicated that most of the particles were spherical, with a diameter of 10–12 nm, a polydispersity index of 0.197, and a zeta potential of -32.25 mV, suggesting high stability of the nanoparticles. EP/AgNPs promote pancreatic β-cell survival, insulin secretion, enhanced hyperglycemia, and hyperlipidemia in glucose-induced diabetic zebrafish. EP/AgNPs also showed protection of the pancreatic β-cell line INS-1 against hydrogen peroxide-induced oxidative injury.
Conclusion: The results indicate that EP/AgNPs have good antidiabetic activity and therefore could be used to prevent the development of diabetes.
Keywords: Eysenhardtia polystachya, zebrafish, silver nanoparticles, diabetes, insulin, hyperlipidemia
Introduction
The control of glucose plays an important role in the management of diabetes.1,2 The main causes of variations in postprandial hyperglycemia include tissue insulin sensitivity, available insulin response, absorption rate, and gut digestion.3 Current therapies such as insulin and oral agents such as α-glucosidase inhibitors, biguanides, sulfonylureas, and gliptins have several undesirable effects,4 and the treatment of diabetes is still a challenge. The β cells are very sensitive to pathological and physiological stressors, leading to a loss of insulin resulting from apoptotic cell death, which is the main problem in diabetes mellitus.5
For several decades, the treatment of type 1 diabetes has been waiting for the development of an oral insulin pill. Thus, in the past few years, a variety of nanocarriers has been investigated for the oral delivery of insulin. Oral administration of nanoparticles improves bioavailability and hypoglycemia in comparison with insulin solution administered subcutaneously.6–8 In addition, a large proportion of drugs (about 40%) are poorly soluble. Subsequently, the enhancement of their oral bioavailability is the most important challenge in their development. Hypoglycemic drugs immobilized by nanoparticles are attracting attention in the treatment of diabetes. Glibenclamide, which is widely used in the treatment of type 2 diabetes, is practically insoluble in water; when it is immobilized by nanoparticles, this increases its retention and bioavailability because it is protected from possible inactivation by the biological surroundings.9 The synthesized nanoparticles of metformin generated mucoadhesive properties and exhibited controlled release of metformin.10
Phytofabricated nanoparticles using different plant extracts for applications in diabetes have been reported; among these, ZnO nanoparticles synthesized using plant extracts of Moringa oleifera and Tamarindus indica exhibited higher antidiabetic activity, inhibiting α-amylase and α-glucosidase, which are the important enzymes in carbohydrate metabolism.11 Green synthesized-silver nanoparticles (AgNPs) using Musa paradisiaca stem extract were also a potent drug against diabetes in the streptozotocin (STZ)-induced diabetes rat model.12 In another study, AgNPs using ethanolic extract of ginger rhizome (Zingiber officinale) had a notable effect on blood glucose lowering in rats with STZ-induced diabetes.13
The biosynthesis of AgNPs is a promising alternative to physicochemical methods, which limit the use of hazardous and toxic substances and are energy consuming. Currently, literature on the synthesis of AgNPs using plant extracts is receiving attention, because they act as both capping and stabilizing agents. Furthermore, it involves the reduction of silver ions (Ag+) to silver atoms (Ag0), resulting in colloidal nanoparticles.14,15
Bioactivity screening is a predominant part of the development of new drugs for diabetes, and several in vivo biological models are now available for this purpose. Among them, zebrafish (Danio rerio) is emerging as an important in vivo model because this fish regulates glucose metabolism via the same enzymes and pathways as in humans and mice. In zebrafish, exposure to high glucose levels stimulates insulin expression16 and negatively regulates gluconeogenesis.16 Previous studies have determined that zebrafish respond markedly to antidiabetic drugs which lower blood glucose levels;16 this is due to the zebrafish pancreas consisting of two types of endocrine and exocrine tissues which are responsible for the regulation of glucose metabolism through secretion of glucagon, somatostatin, and insulin directly into the bloodstream.17 Consequently, zebrafish would make a suitable model for examining type 2 diabetes and its complications. In addition, the zebrafish body is transparent during early embryonic development, so it is easy to observe in vivo toxicity, fluorescence probes, transport, and biocompatibility of the nanoparticles.18 zebrafish provide an attractive model for human diseases and are widely utilized for toxicology studies and drug development because of their anatomic and genetic correlations with humans.19 Adult zebrafish easily absorb molecules from water, owing to their ability to regulate total solute concentrations and internal water.20 In this study, zebrafish were immersed in a glucose solution, which is capable of generating diabetes.21
Currently, the zebrafish model is used to study several topics in toxicological research, such as the persistence of xenobiotic-induced epigenetic alterations through the generations, developmental origins of health and disease, mechanisms of action, environmental toxicants, evaluating ecotoxicity, and developmental neurotoxicity;22 it is also used to evaluate antioxidant and antigenotoxic effects,23 vascular development,24 and cancer,25 among other things.
Type 2 diabetes is widely studied in both non-obese and obese rodent models with β-cell failure and varying degrees of insulin resistance. These models include monogenic obesity models (Lep ob/ob mice), obesity-induced hyperglycemia (Lep rdb/db mice), polygenic obesity models (KK mice), and obesity-induced hyperglycemia (OLETF rat). In non-obese models, diabetes is induced with alloxan or STZ, amyloid deposition in islets (AKITA mice), and genetically induced models of β-cell dysfunction (hIAPP mice). Some models analyze diabetic complications, obesity-induced hyperglycemia, and treatments to improve insulin resistance, to prevent diet-induced hyperglycemia induced by insufficient β-cell function/mass, and to improve β-cell function or survival and β-cell destruction due to endoplasmic reticulum stress.26
The tree Eysenhardtia polystachya (Ortega) Sarg, which belongs to the family Leguminosae, is known as “palo azul” and has been widely used as an antirheumatic and in the treatment of nephrolithiasis and bladder disorders that occur in diabetes.27 Phytochemical studies indicate that E. polystachya contains polyphenols.28 In another study, isoflavans displayed the moderate cytotoxic activity against KB cell lines.29 A methanol–water extract of the bark of E. polystachya showed antioxidant potential, hypoglycemic effects, and inhibition of the formation of advanced glycation end products (AGEs).30 The effect of flavonoids isolated from the bark of E. polystachya on oxidative stress in STZ-induced diabetes mellitus in mice was also examined.31 In other research, we determined that dihydrochalcones inhibit the formation of AGEs.32 The aim of the present study was to evaluate the effects of E. polystachya-loaded silver nanoparticles (EP/AgNPs) on glucose-induced diabetic zebrafish and peroxide-induced pancreatic INS-1 cell damage.
Materials and methods
Chemicals
Silver nitrate (AgNO3), sodium borohydride (NaBH4), polyvinyl pyrrolidone (PVP), 2,2-diphenyl-1-picrylhydrazyl (DPPH), methanol, DMEM, glucose, HEPES, bovine serum albumin (BSA), DMSO, MTT, dithiothreitol (DTT), glutamine, and fetal bovine serum (FBS) used in this study were all of reagent grade and were purchased from Sigma-Aldrich (St Louis, MO, USA); streptomycin was purchased from Gibco BRL Life Technologies (Grand Island, NY, USA).
Plant material
Bark of E. polystachya was collected in October 2016 near Tula in the State of Mexico. A voucher specimen (No 49584) has been deposited at the Herbarium of the Universidad Autonoma Metropolitana-Xochimilco, Ciudad de Mexico, Mexico.
Preparation of bark extract (EP)
The dried bark of E. polystachya (1 kg) was milled and macerated in Milli-Q® (Millipore, Billerica, MA, USA) water and methanol (1:1) for 15 days. The extract was filtered using Whatman No 5 filter paper and evaporated under reduced pressure at 40°C, yielding 95 g of extract.
Synthesis of EP/AgNPs
In brief, AgNO3 solution was prepared by dissolving 0.003 moles in 50 mL of Milli-Q water. AgNPs were synthesized by adding 30 mL of 0.002 M NaBH4 solution in an ice bath at a rate of approximately one drop per second, followed by the addition of 10 mL of a solution of 0.001 M EP. Then, 30 mL of 0.3% PVP solution was added to prevent aggregation. The solution of EP/AgNPs was centrifuged at 15,000 rpm for 30 min to collect the nanoparticles. As a control, AgNPs without EP were prepared using the same method.
Characterization of EP/AgNPs
The characteristic surface plasmon resonance peaks of the synthesized nanoparticles were determined by ultraviolet–visible (UV-vis) spectroscopy. The absorbance of the nanoparticles at wavelengths of 200–800 nm was measured using a UV-vis spectrophotometer (UV-1800; Shimadzu, Kyoto, Japan). The chemical composition of AgNPs with and without EP was characterized by Fourier transform infrared spectroscopy (FTIR) using a PerkinElmer spectroscope (L1280044; PerkinElmer, Waltham, MA, USA). The surface morphology of AgNPs was observed by transmission electron microscopy (TEM) using an H-600 instrument (Hitachi, Tokyo, Japan). For TEM imaging, a drop of aqueous solution containing EP/AgNPs was placed on a carbon-coated copper grid (Agar Scientific, London, UK). The grid was allowed to dry overnight at room temperature prior to TEM analysis. The distribution, size, and stability of the synthesized nanoparticles were determined by dynamic light scattering analysis on a Malvern Zetasizer Nano ZS90 compact scattering spectrometer (Malvern Instruments, Malvern, UK) at 25°C. Each sample was diluted with Milli-Q water (40% v/v) before analysis. The reported hydrodynamic diameters are the mean values obtained from four determinations.
The hydrodynamic diameter of the nanocomposites was measured at 110±5 nm and 25°C in a Nicomp 380 particle size analyzer (Nicomp Particle Sizing Systems, Port Richey, FL, USA).
FTIR spectroscopy was used to identify the organic functional groups present in the synthesized EP/AgNPs. The FTIR spectrum was recorded in the infrared region of 400–4,000 cm−1 using the attenuated total reflectance method (L1280044; PerkinElmer, Waltham, MA, USA). The spectrum was recorded in the transmittance mode.
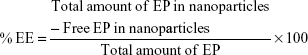
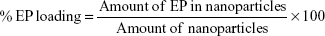
EP loading ratio and encapsulation efficiency
The EP loading efficiency of the AgNPs was measured by extracting EP from the nanoparticles. In brief, 20 mg of EP-loaded nanoparticles was placed in 50 mL of Milli-Q water, and the mixture was stirred vigorously for 48 h to extract EP from the nanoparticles. The mixture was then centrifuged for 15 min at 14,000 rpm. The supernatant was assayed by UV spectrophotometry at 328 nm. Nanoparticles prepared without EP were measured using the same procedure. The encapsulation efficiency (EE) was calculated as follows:
|
|
Stability of AgNPs in aqueous solution
The stability of EP/AgNPs in aqueous solution was determined over 6 months by the size distribution and plasmonic properties on UV-vis measurements. After this time, nanoparticles did not show aggregation.
In vitro EP release profile
The measured release profile of EP from EP/AgNPs was determined in gradient pH media, simulating the conditions found in the gastrointestinal system (simulated gastric fluid [SGF] at pH 1.2 and simulated intestinal fluid [SIF] at pH 6.6, 7.0, and 7.4) with mild agitation at 37°C. At specific time intervals, aliquots of the samples were removed and centrifuged at 8,000 rpm. The concentration of EP in the supernatant was determined by UV spectrophotometry at 328 nm. To deduce the EP release mechanism, the data were fitted to the Korsmeyer–Peppas model:18
|

where Mt and M∞ are the absolute amounts of EP released at time t and at infinite time, respectively; K is a constant related to the structural characteristics of the particles; and n is the release exponent reflecting the diffusion mechanism.
Cell cultures
The RAW 264.7 cell line was obtained from the American Type Culture Collection (Rockville, MD, USA). The cells were cultured in DMEM supplemented with 100 U/mL penicillin, 2 mM glutamine, and 10% FBS at 37°C in a humidified incubator in a 5% carbon dioxide (CO2) atmosphere. The EP extract was dissolved in DMSO.
Cell viability test
The murine macrophage cell line RAW 264.7 is widely used in in vitro studies related to the selection of natural products or biomolecules for bioactivity and their possible toxic effect on cells, and to predict their potential activity on primary cells or in vivo. The RAW 264.7 response is considered to reflect the potential human de novo response, and consequently this cell line is used to evaluate the viability of the product.33,34 Therefore, in this study, the viability of AgNPs was determined using the RAW 264.7 cell line.
RAW 264.7 cells were seeded in 96-well plates in DMEM supplemented with 10% FBS and incubated for 1 h in the presence of various concentrations of EP/AgNPs (140, 280, 420, and 560 μg/mL); the cells were then stimulated for 4 h with 20 ng/mL lipopolysaccharide (LPS). Subsequently, the relative cell viability was evaluated by the addition of MTT at 0.5 mg/mL. For this assay, the cell culture supernatants were replaced with culture medium containing MTT reagent and incubated overnight. Cell viability was measured by absorbance at 570 nm using a microplate reader.35
Experiments using an adult zebrafish model
Adult zebrafish of length 3–5 cm of both sexes were acclimated during 10 days. They were then accommodated in groups of 20 fish in 5 L thermostated (28°C±2°C) tanks, kept under constant biological, mechanical, and chemical water filtration and aeration (7.19 mg O2/L). The fish were maintained under a 14 h/10 h day/night photoperiod cycle and fed three times a day with commercial flakes. This study was conducted in accordance with the recommendations of the Guide for the Care and Use of Laboratory Animals of the National Institutes of Health. The protocol was reviewed and approved by the Institutional Ethics Committee of Escuela Nacional de Ciencias Biológicas–IPN.
Induction of hyperglycemia
Groups of 20 adult animals were placed in 5 L aquaria containing 111 mM glucose solution and maintained for 14 days. The solutions of glucose were interchanged four times per week to avoid contamination by microorganisms. The zebrafish were placed in glucose solution and closely monitored for signs of stress, including excessive gill movement and difficulty swimming.36 The 111 mM glucose-treated groups did not show signs of stress during treatment and had a low mortality rate of 25%. Control group animals were maintained in 5 L aquaria under the same conditions as the glucose-treated groups.
Experimental design
Zebrafish were assigned randomly to five groups of 20 animals each. The control group received only vehicle (Tween 20). Each sample was dissolved in the vehicle and administered at doses of 5 and 10 μg/mL glucose or 5 μg/mL glibenclamide once daily for 2 weeks.
- Group I (control): normal fish, with administration of Tween 20
- Group II (glucose): glucose-induced diabetic fish, with administration of 111 mM glucose
- Group III: glucose-induced diabetic fish, with administration of EP/AgNPs (5 μg/mL)
- Group IV: glucose-induced diabetic fish, with administration of EP/AgNPs (10 μg/mL)
- Group V: glucose-induced diabetic fish, with administration of glibenclamide (5 μg/mL).
The concentrations of AgNPs used in this study were made according to other similar investigations.11
Blood glucose, insulin, triglycerides, and total cholesterol test assays
For the measurement of blood glucose levels, before blood collection procedures, zebrafish were fasted for 12 h and transferred to an aquarium with water without glucose for 15 min to avoid contamination of the glucometer strip. The fish were killed after the induction of hypothermia, which decreases the variability of the blood glucose assay.21 Subsequently, the tail was cut and the blood glucose was taken by transferring a glucometer test strip (One-Touch Ultra, Accu Check; Roche, Ciudad de Mexico, Mexico) directly onto the docked tail. The blood glucose levels were determined throughout the 14-day treatment with 111 mM glucose.
To determine whether the hyperglycemic effect caused by 111 mM glucose treatment was persistent, a group of 10 zebrafish was kept in glucose-free water for an additional 7 days (washout group; no glucose added), maintained under the same conditions described in the section “Experiments using an adult zebrafish”. The control group was maintained in 5 L aquaria with glucose-free water for the same period and treated as a washout group.36
To measure the total cholesterol (TC) and serum triglyceride (TG) levels, the blood was centrifuged (3,000 rpm, 4°C, 20 min) in order to separate serum. The levels of serum TC and TG were determined using an Accutrend Plus monitor (Roche), and assays were performed as per the manufacturer’s protocol. Serum insulin concentrations were measured using an ultrasensitive insulin enzyme-linked immunoassay (ELISA) kit (Alpco, Ciudad de Mexico, Mexico).
Effect of AgNPs on cell damage induced by hydrogen peroxide (H2O2)
The INS-1 cell line was obtained from the American Type Culture Collection. Cells were cultured in RPMI 1640 culture medium, supplemented with 50 μM 2-mercaptoethanol, 10 mM HEPES, 1 mM sodium pyruvate, 2 mM L-glutamine, 10% fetal calf serum, 100 μg/mL streptomycin, and 100 U/mL penicillin, in a humidified 5% CO2 atmosphere at 37°C. The culture medium was changed on the day after seeding and then every other day.
INS-1 cells (5×10⁵ cells per well) were seeded in 96-well clear-bottomed, black-sided plates and allowed to grow until 70% confluent. The cells were then cultured for 24 h in Krebs–Ringer bicarbonate (KRB) buffer (5 mM NaHCO3, 2.5 mM CaCl2, 1.2 mM MgSO4, 1.2 mM KH2PO4, 4.7 mM KCl and 129 mM NaCl), containing 0.5% BSA and 2.8 mM glucose; then KRB was replaced by KRB containing 2.8 mM glucose for 1 h (basal state); later, KRB 16.7 mM glucose was added, followed by incubation for an additional 1 h (glucose-stimulated state).37 Supernatants from both basal and glucose-stimulated states were collected for insulin secretion analysis using a rat insulin ELISA kit (Millipore).
Statistical analysis
All data are expressed as mean ± SD. One-way analysis of variance was used with Tukey’s test for comparison of probability and means. Values of p<0.05 were considered statistically significant. Statistical analysis was performed using GraphPad Prism version 5.03 software. The experiments were performed in triplicate.
Results and discussion
Characterization of nanoparticles
In this study, we describe the synthesis of AgNPs using water/methanol extract (EP) of E. polystachya. Synthesized EP/AgNPs were characterized using various analytical methods. Nanoparticles did not present agglomeration and were uniform, and most of them were spherical, with a size range of 5–21 nm. Synthesized AgNPs was found to be very stable for over a year without the addition of any stabilizer. The water/methanol extract (EP) of E. polystachya was previously fractionated by several chromatographies.31,32 Then, the bioactive components were isolated, and their chemical structure determined to be chalcones, dihydrochalcones, and flavonoids (data not shown).
One of the most widely used techniques for the structural characterization of AgNPs is UV-vis spectroscopy. The reduction of AgNO3 to AgNPs using NaBH4 was confirmed by the change in color of the suspension from yellow to grayish brown, showing a surface plasmon resonance effect resulting from the collective excitation of conduction electrons in the metal in the UV-vis spectrum. UV-vis spectrometric analysis showed a peak centered at 409 nm, indicating reduction of AgNO3 and suggesting that AgNPs had been formed (Figure 1). This absorption peak indicates the presence of roughly spherical or spherical nanoparticles. The results also show the formation of a band at 413 nm corresponding to spherical EP/AgNPs. The additional band at 328 nm is due to the absorbance of the EP extract. The results indicate that the conditions used are suitable for obtaining EP/AgNPs of small particle size.
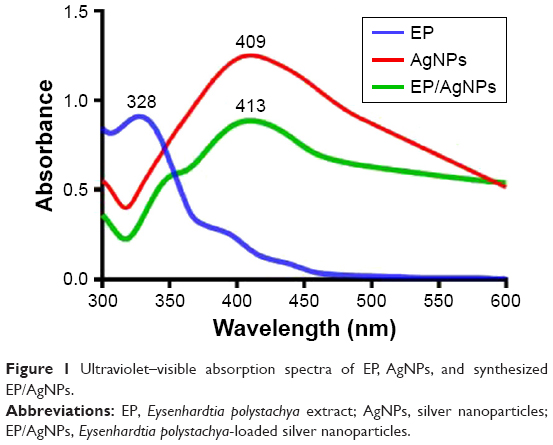 | Figure 1 Ultraviolet–visible absorption spectra of EP, AgNPs, and synthesized EP/AgNPs. |
TEM analysis of the morphology of the AgNPs and EP/AgNPs revealed that both sets of particles were spherical and did not form aggregates. The absence of agglomerated particles confirms the stability of the nanoparticle suspensions. Photomicrographs of AgNPs showed that the nanoparticles were distinct, spherical, and completely separated from each other (Figure 2A). The sizes of more than 100 particles in TEM histograms were measured; the particles were found to have an average size of 5.6–15.7 nm. Figure 2A presents TEM images showing the particle size distribution of the EP/AgNPs, and Figure 2B shows that the EP/AgNPs had an average particle size of 12±0.15 nm. These results are in agreement with the data obtained from the UV-vis spectra. The use of EP/AgNPs of 12 nm mean size may result in better antioxidant activity.
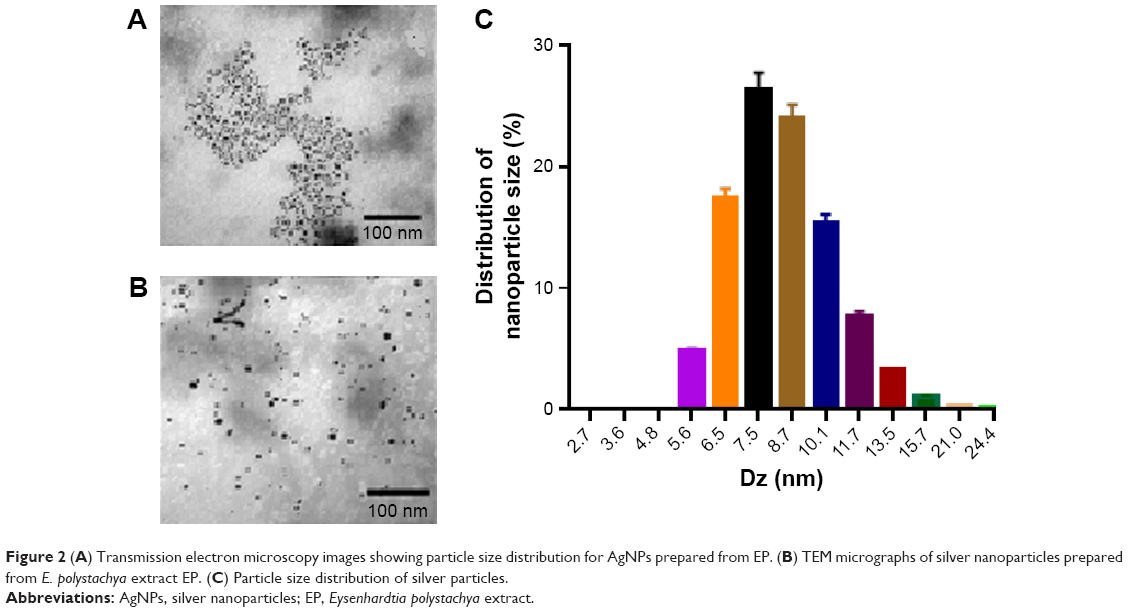 | Figure 2 (A) Transmission electron microscopy images showing particle size distribution for AgNPs prepared from EP. (B) TEM micrographs of silver nanoparticles prepared from E. polystachya extract EP. (C) Particle size distribution of silver particles. |
Zeta potential is the net surface charge of nanoparticles. Dynamic light scattering analysis was performed to measure the stability of the synthesized EP/AgNPs. The results of this analysis, which are shown in Table 1, demonstrate that the hydrodynamic diameter of the nanoparticles was 12 nm, in agreement with the results of other studies in which the hydrodynamic diameters of AgNPs synthesized using plant extracts were shown to be 10–100 nm.38 The polydispersity index (PDI) of the EP/AgNPs was 0.197 (Table 1); this value indicates the stability of the nanoparticles and is consistent with the measured PDIs of other AgNPs synthesized from plant extracts.39 Table 1 shows that the measured zeta potential of synthesized biocapped AgNPs was −32.25 mV, indicating high stability of the particles and reflecting the strong anionic conditions used during their synthesis, which probably prevented silver agglomeration. The high negative potential value may be due to the capping of the organic components present in EP. The coating of AgNPs with EP, together with the particle PDI of 0.197, is responsible for the electrostatic stabilization of EP/AgNPs in the colloidal solution. This was confirmed by the fact that no aggregation of particles was observed after several months of storage.
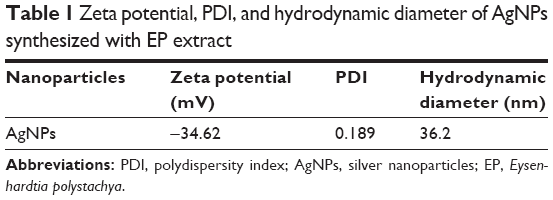 | Table 1 Zeta potential, PDI, and hydrodynamic diameter of AgNPs synthesized with EP extract |
FTIR is important for understanding the involvement of functional groups in nanoparticles. Figure 3 shows the FTIR spectra of EP/AgNPs. The sharp bands in the spectrum located at 3,456 cm−1 correspond to O−H groups (alcohol or phenols); the bands at 2,816 and 2,844 cm−1 indicate the C−H stretching vibrations of alkanes; the band at 1,512 cm−1 is produced by C−C stretching vibrations of aromatic compounds, which at 1,493 cm−1 (tension of C=C) corresponds to aromatic rings; and the band at 1,436 cm−1 (C−H bend stretching vibration) indicates the presence of alkanes. The peaks located at 1,741, 1,071, 803, and 566 cm−1 correspond to C−H groups; the signals at 1,248 and 1,042 cm−1 are produced by the tension of the C−O of an alkyl aryl ether (φ-OMe) (methoxyl group), and the presence of a flexible CH loop is indicated by the bands at 768 and 692 cm−1 (aromatics). The FTIR analysis suggests that the bioreduction of Ag+ to AgNPs is also partly due to the reduction of capping material present in the plant extract. The FTIR analysis also indicates the involvement of arylnaphthalenes, which have the ability to bind metals, suggesting that these compounds may play a vital role in capping the AgNPs, thereby preventing agglomeration and stabilizing the nanoparticles. The results suggest that the biological molecules present in EP may have dual functions in the formation and stabilization of AgNPs.40
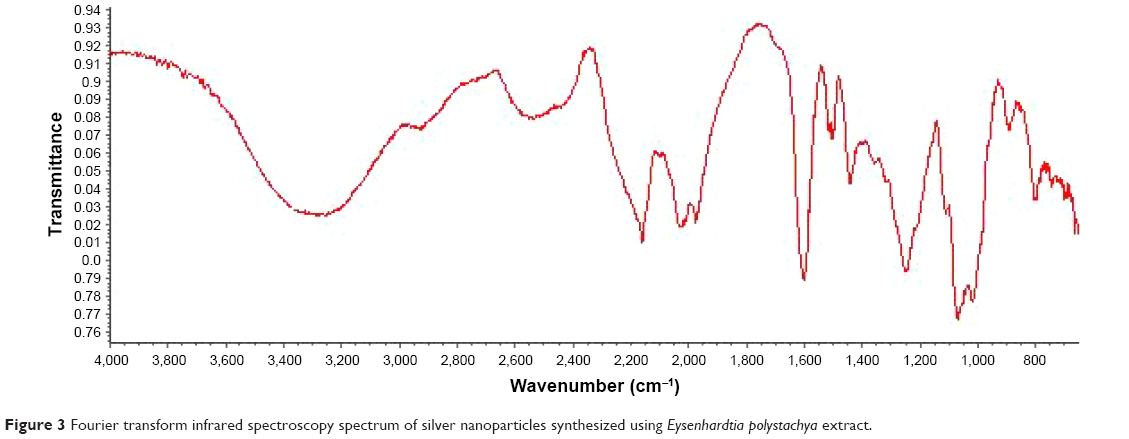 | Figure 3 Fourier transform infrared spectroscopy spectrum of silver nanoparticles synthesized using Eysenhardtia polystachya extract. |
EP loading efficiency and EE
To produce an antidiabetic effect in zebrafish, the EE of EP must be significant. When the EP extract was characterized by UV-vis spectroscopy (Figure 1), two peaks at 284 and 325 nm, which are characteristic of the flavonoid bands I and II, respectively, were observed.41 The EP encapsulation efficiency of the obtained nanoparticles was found to be 84.8%. The synthesized AgNPs displayed an incorporation efficiency of 44.34%, showing that they were effectively loaded.
In TEM images, AgNPs showed no significant changes in shape or particle size and appeared to be well dispersed without any aggregation. Their plasmonic properties were also stable, indicating good stability of the AgNPs for 6 months.
In vitro EP release profile
The ability of the prepared nanoparticles to pass through the acid pH of the stomach and release the incorporated extract in the intestine was assessed by conducting drug release assays under conditions that simulated immersion in gastric (SGF) and intestinal (SIF) fluid. The release profiles of EP from EP/AgNPs as a function of pH and time are shown in Figure 4. Initially, after 2 h in SGF at pH 1.2, a rapid release of a maximum of 16.3% of the EP was observed. The release of EP from EP/AgNPs was time dependent, reaching a maximum at 10 h and remaining constant over the next 2 h. This may be due to the weak interaction between EP and the strongly anionic AgNPs.
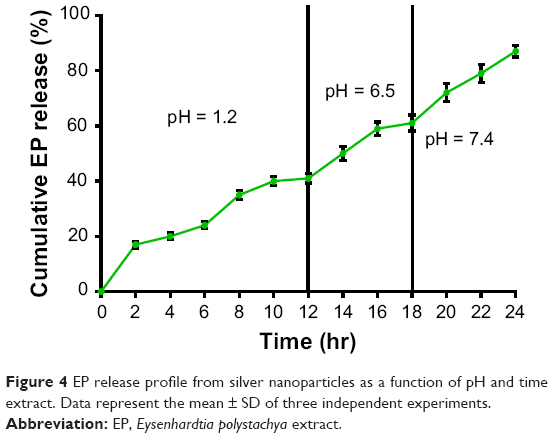 | Figure 4 EP release profile from silver nanoparticles as a function of pH and time extract. Data represent the mean ± SD of three independent experiments. |
When the EP/AgNPs were treated with SIF at pH 6.8 or 7.4, EP release was also time dependent; at 4 h, the amount of drug released was higher than that obtained at pH 1.2, and continuous prolonged release of 75%–88% of the initial amount of EP until 10 h was observed. This could be due to the interaction between the alkaline solvent and the positive charges of the EP compounds. Based on these results, we assume that sustained release is due to the diffusion of EP through the system and that release was regulated in a pH-dependent manner.
Kinetics of release
The kinetics of release of EP from the functionalized nanoparticles are shown in Table 2. A constant and rapid release at the beginning of the process, followed by later constant and controlled release, is described by the Higuchi,42 Korsmeyer–Peppas,43 and Ritger–Peppas44 models. The behavior of the functionalized nanoparticles corresponds to the profile of release of a bioactive compound, which features initial rapid desorption of the adjuvant followed by slow and prolonged diffusion of the therapeutic agent. EP release from AgNPs shows a high correlation coefficient of r2=0.853 in the Korsmeyer–Peppas release model, providing evidence for its mechanism of release. Similar to diffusion, EP release behavior shows the first-order kinetics.
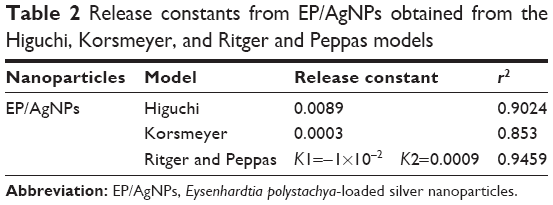 | Table 2 Release constants from EP/AgNPs obtained from the Higuchi, Korsmeyer, and Ritger and Peppas models |
Cell viability of EP/AgNPs on H2O2-treated RAW 264.7 cells
The protective effect of EP/AgNPs on cell survival in H2O2-treated RAW 264.7 cells was measured using an MTT assay, as shown in Figure 5. The results indicated that nanoparticles are nontoxic to murine macrophages. More than 90% viability was observed after 24-h exposure of the cells to EP/AgNPs at concentrations of 50 to 560 μg/mL, indicating the biocompatibility of EP/AgNPs (Figure 5A). Incubation with 200 μM of H2O2 markedly reduced cell viability (57%). Pretreatment with 50, 100, 250, 420, and 560 μg/mL of EP/AgNPs increased the viability of RAW 264.7 cells to 66%, 75%, 85%, 90%, and 96%, respectively (Figure 5B).
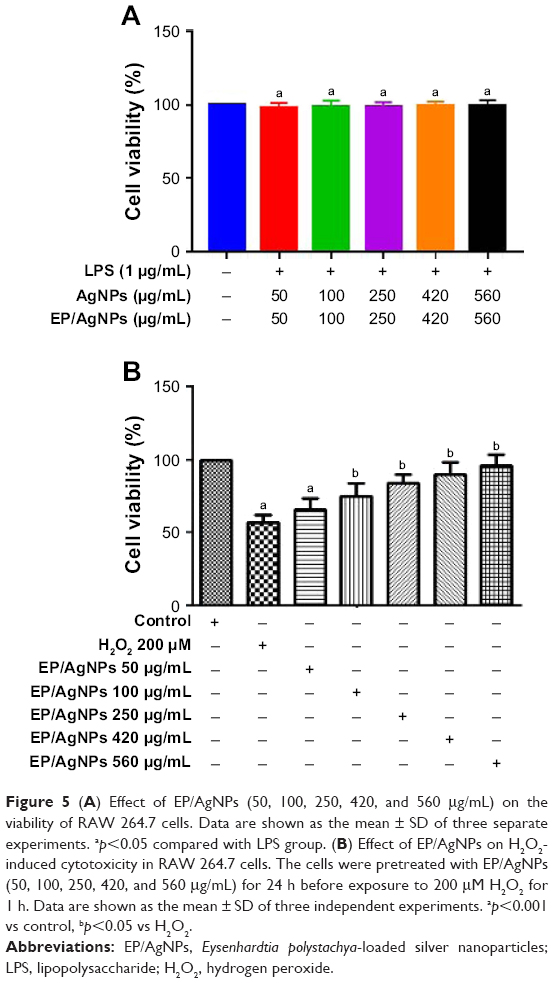 | Figure 5 (A) Effect of EP/AgNPs (50, 100, 250, 420, and 560 μg/mL) on the viability of RAW 264.7 cells. Data are shown as the mean ± SD of three separate experiments. ap<0.05 compared with LPS group. (B) Effect of EP/AgNPs on H2O2-induced cytotoxicity in RAW 264.7 cells. The cells were pretreated with EP/AgNPs (50, 100, 250, 420, and 560 μg/mL) for 24 h before exposure to 200 μM H2O2 for 1 h. Data are shown as the mean ± SD of three independent experiments. ap<0.001 vs control, bp<0.05 vs H2O2. |
Protective effect of EP/AgNPs in INS-1 cells against H2O2-induced oxidative injury
In pancreatic β cells, H2O2 is a metabolic signal for glucose-stimulated insulin secretion; however, it may induce damage with an increase in oxidative stress, as in diabetic chronic hyperglycemia. Eysenhardtia polystachya contains polyphenolic compounds that may protect insulin-secreting cells from oxidative stress. Treatment with EP/AgNPs alone or in the presence of H2O2 could ameliorate insulin sensitivity and glucose metabolism (Figure 6). EP/AgNPs promote pancreatic β-cell survival, insulin secretion-enhanced hyperglycemia, and hypolipidemia. These results confirming the effectiveness of nanoparticles in ameliorating hyperglycemia.
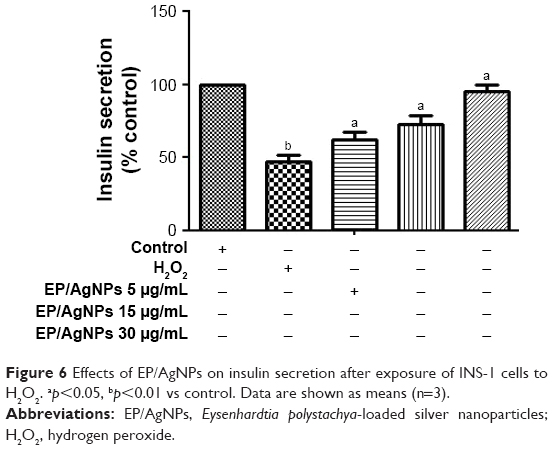 | Figure 6 Effects of EP/AgNPs on insulin secretion after exposure of INS-1 cells to H2O2. ap<0.05, bp<0.01 vs control. Data are shown as means (n=3). |
In the present study, insulin secretion was inhibited in cells that were exposed to H2O2. However, cells that had been treated with EP/AgNPs before exposure to H2O2 had a marked increase in insulin secretion (Figure 5), indicating that this result could occur through cytoprotection against oxidative injury. H2O2 has been reported to be an important factor in physiological cellular signal transduction for glucose-stimulated insulin secretion in β cells.45 However, sustained and/or excessive H2O2 production can disturb the integrity and the function of β cells, which contribute to the pathogenesis of diabetes.46 The exposure to H2O2 causes injury in islets by suppressing hyperpolarization of the mitochondrial membrane and impairs glucose-stimulated insulin. β-Cell dysfunction and insulin resistance are the characteristics of the pathogenesis of type 2 diabetes which are considered important in the disease in humans;47 therefore, EP/AgNP treatment may provide beneficial effects on the function of insulin secretion through its protective effect on pancreatic β cells.48 In addition, a zebrafish model was used to confirm the antidiabetic efficacy of EP/AgNPs on experimental diabetic animals.
Mortality in zebrafish
The zebrafish is widely used as a model organism in in vivo experiments owing to its high physiological similarity to mammals, its large clutch size, its small body size, and its low cost.49 Initially, zebrafish were used in biology and molecular genetics; nevertheless, they have important potential for use as a model in toxicological and pharmacological studies of small molecules and drugs.
Treatment of zebrafish with EP/AgNPs in the absence of glucose had no significant effect on the survival of the animals, supporting their biocompatible nature. There were no significant differences in hatching or survival rates among the treatment groups (p<0.05). In addition, there was no significant difference in the percentage of abnormalities observed in the exposure groups and the control group. The survival rates of zebrafish in the groups treated with 50 and 560 μg/mL of EP/AgNPs were 96.12% and 92.70%, respectively; these values are not significantly different (p<0.05) from the values obtained for the control group.
Treatment with glucose led to persistent hyperglycemia
Immersion of zebrafish in 111 mM glucose solution (Figure 7A) induced an increase in blood glucose levels through the 14th day of treatment compared to control animals. These results are in agreement with the hyperglycemia in a zebrafish model described by Gleeson et al.21 To determine whether the effect caused by immersion in 111 mM glucose solution for 14 days was persistent, a glucose withdrawal assay was carried out. The data indicated that after 14 days of glucose withdrawal, there was a significant (p<0.05) inhibition on blood glucose levels compared to the 111 mM glucose group. However, the glucose group remained higher than the control group (Figure 7B). These results indicate that hyperglycemia can be maintained in zebrafish.
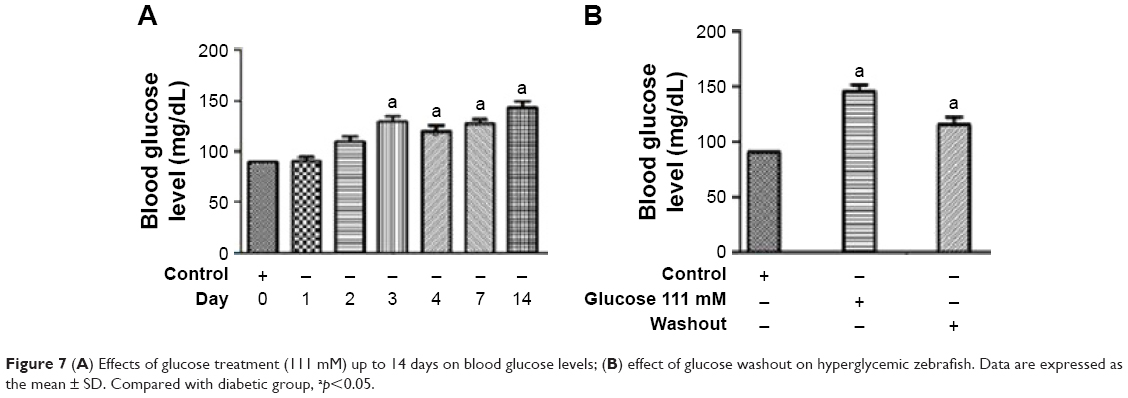 | Figure 7 (A) Effects of glucose treatment (111 mM) up to 14 days on blood glucose levels; (B) effect of glucose washout on hyperglycemic zebrafish. Data are expressed as the mean ± SD. Compared with diabetic group, ap<0.05. |
Effects of EP/AgNPs on insulin, hypoglycemic, and hypolipidemic activities in zebrafish
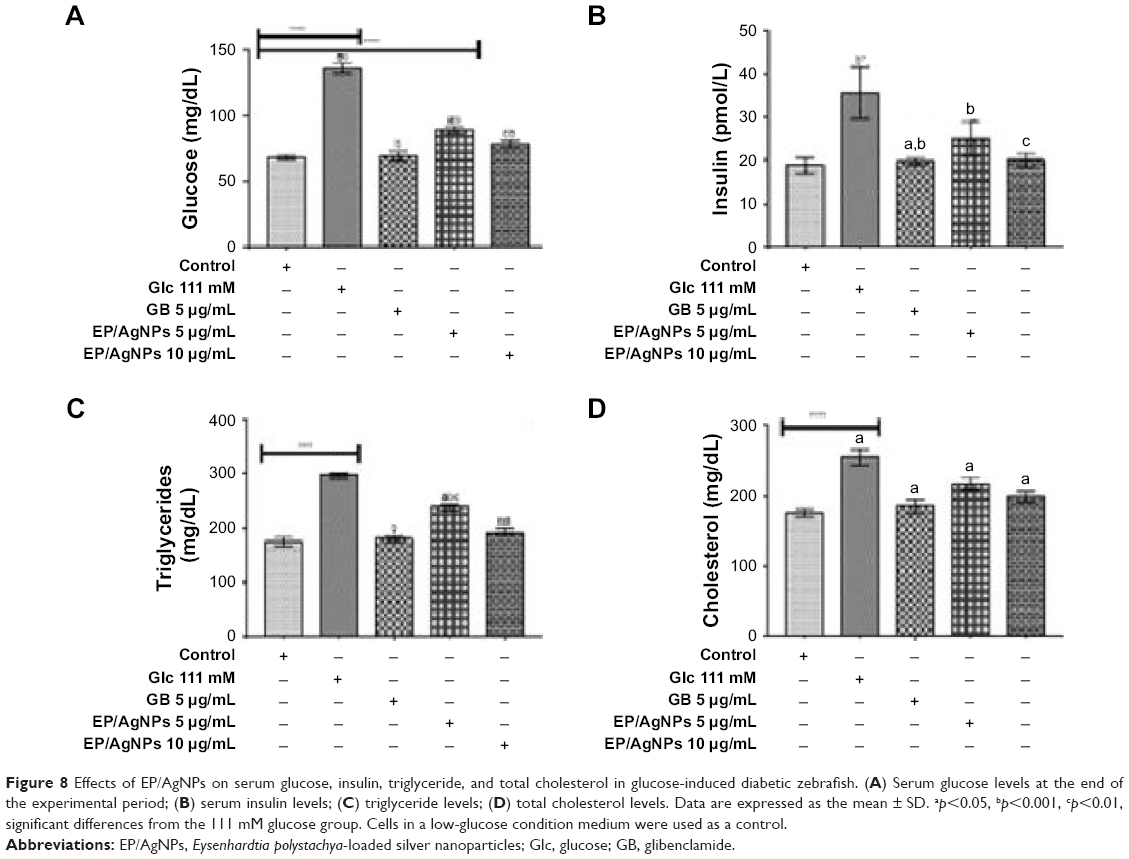
In this work, impaired glucose metabolism was seen in adult zebrafish exposed for 14 days to a 111 mM glucose solution, which developed high blood glucose levels 2–3 days after immersion. However, after glucose withdrawal for 7 days, the blood glucose levels remained slightly elevated, but lower than that in the 111 mM glucose group. Treatment with EP/AgNPs at doses of 5 and 10 μg/mL reduced the levels by 38.1% and 44.5%, respectively, of the blood glucose levels induced by 111 mM glucose treatment, and by 51% in the glibenclamide group (Figure 8A).
 | Figure 8 Effects of EP/AgNPs on serum glucose, insulin, triglyceride, and total cholesterol in glucose-induced diabetic zebrafish. (A) Serum glucose levels at the end of the experimental period; (B) serum insulin levels; (C) triglyceride levels; (D) total cholesterol levels. Data are expressed as the mean ± SD. ap<0.05, bp<0.001, cp<0.01, significant differences from the 111 mM glucose group. Cells in a low-glucose condition medium were used as a control. |
In a study on STZ-induced diabetic rats, AgNPs displayed increased insulin levels, moderate reduction of blood glucose, increased glucokinase expression, and improved levels of expression of insulin receptor isoform A and GLUT-2.50 The medical application of AgNPs synthesized from plant extracts has advanced rapidly, focusing on targeted drug delivery systems, treatment, drug development, and improving diagnosis,51 and has shown the important potential for treating major diseases such as diabetes mellitus.52 Recent trends in diabetes research indicate the potential antidiabetic effect of AgNPs synthesized using powerful antidiabetic plants as stabilizing and reducing agents.11,52,53 They can also improve drug delivery systems of current synthetic drugs to ameliorate antidiabetic treatment.54 Therefore, studies on the properties of AgNPs synthesized from Pouteria sapota,55 Andrographis paniculata,56 and Syzygium cumini57 will be further extended to investigate their probable ameliorating antidiabetic effects as promising therapeutic agents.
In this study, we evaluated the effects of EP/AgNPs in an in vivo model (glucose-induced diabetic zebrafish) and an in vitro model (INS-1 cell line). The findings demonstrated that diabetic fish had higher serum insulin concentrations than control zebrafish, suggesting pancreatic β-cell damage in this group, while EP/AgNPs at a dose of 100 μg/mL resulted in decreased plasma insulin levels (by 54%) compared with the glucose-induced diabetic fish group, which was similar to normoglycemic control zebrafish (Figure 8B). High glucose levels stimulate insulin release; nevertheless, chronic exposure of pancreatic cells to elevated glucose levels results in impairment of both insulin secretory function and viability. The results confirm the ability of EP/AgNPs to ameliorate cell viability and insulin secretion in zebrafish under high glucose concentrations. In this study, the treatments of zebrafish glucose-induced diabetes with EP/AgNPs were consistent with those reported in previous studies, confirming the effectiveness of nanoparticles in ameliorating hyperglycemia.
As shown in Figure 8C and D, the glucose-induced diabetic fish had higher serum TC and TG. However, the exposition to EP/AgNPs markedly decreased the levels of serum TG (40%) and TC (29.4%), compared with glucose-induced diabetic fish. Glibenclamide, an antidiabetic drug used as a standard, was as effective as nanoparticles. The hypertriglyceridemia and hypercholesterolemia observed in the diabetic fish resulted from the increases in TC and TG levels. However, EP/AgNPs ameliorated dyslipidemia and reversed insulin resistance, which consequently enhanced lipid metabolism.
Conclusion
The biosynthesized AgNPs from bark methanol/water extract of E. polystachya contain bioactive compounds such as chalcones, flavonoids, and dihydrochalcones, which play a determinant role in the phytofabrication of the AgNPs. EP/AgNPs promote pancreatic β-cell survival, insulin secretion-enhanced hyperglycemia, and hyperlipidemia in glucose-induced diabetic zebrafish. In addition, EP/AgNPs restore insulin secretion from INS-1 cells stimulated by H2O2, suggesting that this could result from cytoprotection against oxidative injury. These findings suggest that EP/AgNPs could be used as therapeutic nanoparticles to prevent the development of diabetes.
Disclosure
The authors report no conflicts of interest in this work.
References
Fowler MJ. Microvascular and macrovascular complications of diabetes. Clin Diabetes. 2008;26(2):77–82. | ||
Moller DE. New drug targets for type 2 diabetes and the metabolic syndrome. Nature. 2001;414:821–827. | ||
Van de Laar FA, Lucassen PL, Akkermans RP, et al. Alpha-glucosidase inhibitors for type 2 diabetes mellitus. Cochrane Database Syst Rev. 2005;18(2):CD003639. | ||
Cheng AY, Fantus IG. Oral antihyperglycemic therapy for type 2 diabetes mellitus. CMAJ. 2005;172(2):213–226. | ||
Rhodes CJ. Type 2 diabetes-a matter of beta-cell life and death? Science. 2005;307(5708):380–384. | ||
Agrawal AK, Urimi D, Harde H, Kushwah V, Jain S. Folate appended chitosan nanoparticles augment the stability, bioavailability and efficacy of insulin following oral administration. RSC Adv. 2015;5:105179–105193. | ||
Subramani K. NPDDS for the treatment of diabetes. In: Pathak Y, Thassu D, editors. Drug Delivery Nanoparticles Formulation and Characterization. New York: Informa Healthcare; 2009:117–125. | ||
Jafari B, Rafie F, Davaran S. Preparation and characterization of a novel smart polymeric hydrogel for drug delivery of insulin. Bioimpacts. 2011;1(2):135–143. | ||
You L, Li C, Le Y, Chen JF, Zou H. Stabilized amorphous glibenclamide nanoparticles by high-gravity technique. Mater Chem Phys. 2011;130:361–366. | ||
Sharma HK, Nath LK. Study of the effect of Dillenia indica fruit mucilage on the properties of metformin hydrochloride loaded spray dried microspheres. Int Sch Res Notices. 2014;19:2014:628382. | ||
Rehana D, Mahendiran D, Kumar RS, Rahiman AK. In vitro antioxidant and antidiabetic activities of zinc oxide nanoparticles synthesized using different plant extracts. Bioprocess Biosyst Eng. 2017;40(6):943–957. | ||
Anbazhagan P, Murugan K, Jaganathan A, et al. Mosquitocidal, antimalarial and antidiabetic potential of Musa paradisiaca-synthesized silver nanoparticles: in vivo and in vitro approaches. Journal of Cluster Science. 2017;28:91–107. | ||
Garg A, Pandey P, Sharma P, Shukla A. Synthesis and characterization of silver nanoparticle of ginger rhizome (Zingiber officinale) extract: synthesis, characterization and anti diabetic activity in streptozotocin induced diabetic rats. Eur J Biomed Pharm Sci. 2016;3(7):605–611. | ||
Asghari G, Varshosaz J, Shahbazi N. Synthesis of silver nanoparticle using Portulaca oleracea L. extracts. Nanomedicine Journal. 2014;1(2):94–99. | ||
Mallikarjuna K, Narasimha G, Dillip GR, et al. Green synthesis of silver nanoparticles using Ocimmum leaf extract and their characterization. Dig J Nanomater Biostruct. 2011;6(1):181–186. | ||
Elo B, Villano CM, Govorko D, White LA. Larval zebrafish as a model for glucose metabolism: expression of phosphoenolpyruvate carboxy kinase as a marker for exposure to anti-diabetic compounds. J Mol Endocrinol. 2007;38:433–440. | ||
Gnügge L, Meyer D, Driever W. Pancreas development in zebrafish. Methods Cell Biol. 2004;76:531–551. | ||
Khajuria DK, Kuma VB, Karasik D, Gedanken A. Fluorescent nanoparticles with tissue-dependent affinity for live zebrafish imaging. ACS Appl Mater Interfaces. 2017;9(22):18557–18565. | ||
Ahmad S. Engineered nanomaterials for drug and gene delivery – a review. J Nanopharm Drug Deliv. 2016;3(1):1–50. | ||
Moyle PB, Cech JJ Jr. Fishes: An Introduction to Ichthyology. 4th ed. Upper Saddle River, NJ: Prentice Hall; 2000. | ||
Gleeson M, Connaughton V, Arneson LS. Induction of hyperglycaemia in zebrafish (Danio rerio) leads to morphological change in the retina. Acta Diabetol. 2007;44(2):150–163. | ||
Horzmann KA, Freeman JL. Making waves: new developments in toxicology with the zebrafish. Toxicol Sci. Epub 2018 Feb 19. | ||
Santo GD, Grotto A, Boligon AA, et al. Protective effect of Uncaria tomentosa extract against oxidative stress and genotoxicity induced by glyphosate-Roundup® using zebrafish (Danio rerio) as a model. Environ Sci Pollut Res Int. Epub 2018 Feb 13. | ||
Matsuoka RL, Stainier DYR. Recent insights into vascular development from studies in zebrafish. Curr Opin Hematol. Epub 2018 Feb 12. | ||
Grigura V, Barbier M, Zarov AP, Kaufman CK. Feeding amount significantly alters overt tumor onset rate in a zebrafish melanoma model. Biol Open. 2018;7(1). pii: bio030726. | ||
King AJ. The use of animal models in diabetes research. Br J Pharmacol. 2012;166(3):877–894. | ||
Perez RMG, Vargas RS, Perez SG, Zavala MS. Antiurolithiatic activity of Eysenhardtia polystachya aqueous extract on rats. Phytother Res. 1998;12(2):144–145. | ||
Burns DT, Dalgarno BG, Gargan PE, Grimshaw J. An isoflavone and a coumestan from Eysenhardtia polystachya – Robert Boyle’s fluorescent acid–base indicator. Phytochemistry. 1984;23(1):167–169. | ||
Alvarez L, Rios MY, Esquivel C, et al. Cytotoxic isoflavans from Eysenhardtia polystachya. J Nat Prod. 1998;61(6):767–770. | ||
Gutierrez RM, Baez EG. Evaluation of hypoglycemic, antioxidant and antiglycating activities of the Eysenhardtia polystachya. Pharmcog Mag. 2014;10(Suppl 2);S404–S418. | ||
Perez-Gutierrez RM, Garcia-Campoy AH, Muñiz-Ramirez A. Antioxidant properties of flavonoids isolated from the bark of Eysenhardtia polystachya, and their effect on oxidative stress in streptozotocin-induced diabetes mellitus in mice. Oxid Med Cell Longev. 2016;2016:9156510. | ||
Perez Gutierrez RM, Garcia Campoy AH, Flores Mota JM. Dihydrochalcones from the bark of Eysenhardtia polystachya inhibits formation of advanced glycation end products at multiple stages in vitro studies. J Pharm Pharmacol. 2017;1(3):3–23. | ||
Makama S, Kloet SK, Piella J, et al. Effects of systematic variation in size and surface coating of silver nanoparticles on their in vitro toxicity to macrophage RAW 264.7 cells. Toxicol Sci. 2017;162(1):79–88. | ||
Merly L, Smith SL. Murine RAW 264.7 cell line as an immune target: are we missing something? Immunopharmacol Immunotoxicol. 2017;39(2):55–58. | ||
Lei RR, Hu HF, Bai F, et al. Anti-proliferative and apoptotic effects of S1, a tetrandrine derivative, in human gastric cancer BGC-823 cells. Chin J Nat Med. 2016;14(7):527–530. | ||
Eames SC, Philipson LH, Prince VE, Kinkel MD. Blood sugar measurement in zebrafish reveals dynamics of glucose homeostasis. zebrafish. 2010;7(2):205–213. | ||
Kajikawa M, Fujimoto S, Tsuura T, et al. Ouabain suppresses glucose-induced mitochondrial ATP production and insulin release by generating reactive oxygen species in pancreatic islets. Diabetes. 2002;51(8):2522–2529. | ||
Dipankar C, Murugan S. The green synthesis, characterization and evaluation of the biological activities of silver nanoparticles synthesized from Iresine herbstii leaf aqueous extracts. Coll Surf B Biointerfaces. 2012;98:112–119. | ||
Johnson P, Krishnan V, Loganathan C, et al. Rapid biosynthesis of Bauhinia variegata flower extract mediated silver nanoparticles: an effective antioxidant scavenger and α-amylase inhibitor. Artif Cells Nanomed Biotechnol. 2017. | ||
Patil SP, Kumbhar ST. Antioxidant, antibacterial and cytotoxic potential of silver nanoparticles synthesized using terpenes rich extract of Lantana camara L. leaves. Biochem Biophys Rep. 2017;10:76–81. | ||
Maybry TJ, Markham KR, Thomas MB. The ultraviolet spectra of flavones and flavonols. In: The Systematic Identification of Flavonoids. Berlin: Springer; 1970:41–164. | ||
Higuchi T. Mechanism of sustained-action medication. Theoretical analysis of rate of release of solid drugs dispersed in solid matrices. J Pharm Sci. 1963;52:1145–1149. | ||
Wilczewska AZ, Niemirowicz K, Markiewicz KH, Car H. Nanoparticles as drug delivery systems. Pharmacol Reports. 2012;64:1020–1037. | ||
Ritger PL, Peppas NA. A simple equation for description of solute release I. Fickian and non-fickian release from non-swellable devices in the form of slabs, spheres, cylinders or discs. J Control Release. 1987;5:23–36. | ||
Pi J, Bai Y, Zhang Q, et al. Reactive oxygen species as a signal in glucose-stimulated insulin secretion. Diabetes. 2007;56(7):1783–1791. | ||
Kaneto H, Matsuoka TA, Katakami N, et al. Oxidative stress and the JNK pathway are involved in the development of type 1 and type 2 diabetes. Curr Mol Med. 2007;7(7):674–686. | ||
Weyer C, Bogardus C, Mott DM, Pratley RE. The natural history of insulin secretory dysfunction and insulin resistance in the pathogenesis of type 2 diabetes mellitus. J Clin Invest. 1999;104(6):787–794. | ||
Wang T, Sun P, Chen L, et al. Cinnamtannin D-1 protects pancreatic β-cells from palmitic acid-induced apoptosis by attenuating oxidative stress. J Agric Food Chem. 2014;62(22):5038–5045. | ||
Fishman MC. Zebrafish genetics: the enigma of arrival. Proc Natl Acad Sci U S A. 1999;96(14):10554–10556. | ||
Alkaladi A, Abdelazim AM, Afifi M. Antidiabetic activity of zinc oxide and silver nanoparticles on streptozotocin-induced diabetic rats. Int J Mol Sci. 2014;15(2):2015–2023. | ||
Daisy P, Saipriya K. Biochemical analysis of Cassia fistula aqueous extract and phytochemically synthesized gold nanoparticles as hypoglycemic treatment for diabetes mellitus. Int J Nanomed. 2012;7:1189–1202. | ||
Kumar GV, Gokavarapu D, Rajeswari S, et al. Facile green synthesis of gold nanoparticles using leaf extract of antidiabetic potent Cassia auriculata. Colloids Surf B Biointerfaces. 2011;87(1):159–163. | ||
Shanker K, Mohan GK, Hussain MA, Jayarambabu N, Pravallika PL. Green biosynthesis, characterization, in vitro antidiabetic activity, and investigational acute toxicity studies of some herbal-mediated silver nanoparticles on animal models. Pharmacogn Mag. 2017;13(49):188–192. | ||
Subramania K, Pathak S, Hosseinkhani H. Recent trends in diabetes treatment using nanotechnology. Dig J Nanomater Biostruct. 2012;7(1):85–95. | ||
Prabhu S, Vinodhini S, Elanchezhiyan C, Rajeswari D. Evaluation of antidiabetic activity of biologically synthesized silver nanoparticles using Pouteria sapota in streptozotocin-induced diabetic rats. J Diabetes. 2018;10(1):28–42. | ||
Rajakumar G, Thiruvengadam M, Mydhili G, Gomathi T, Chung IM. Green approach for synthesis of zinc oxide nanoparticles from Andrographis paniculata leaf extract and evaluation of their antioxidant, anti-diabetic, and anti-inflammatory activities. Bioprocess Biosyst Eng. 2018;41(1):21–30. | ||
Atale N, Saxena S, Nirmala JG, Narendhirakannan RT, Mohanty S, Rani V. Synthesis and characterization of Sygyzium cumini nanoparticles for its protective potential in high glucose-induced cardiac stress: a green approach. Appl Biochem Biotechnol. 2017;181(3):1140–1154. |
 © 2018 The Author(s). This work is published and licensed by Dove Medical Press Limited. The
full terms of this license are available at https://www.dovepress.com/terms
and incorporate the Creative Commons Attribution
- Non Commercial (unported, 3.0) License.
By accessing the work you hereby accept the Terms. Non-commercial uses of the work are permitted
without any further permission from Dove Medical Press Limited, provided the work is properly
attributed. For permission for commercial use of this work, please see paragraphs 4.2 and 5 of our Terms.
© 2018 The Author(s). This work is published and licensed by Dove Medical Press Limited. The
full terms of this license are available at https://www.dovepress.com/terms
and incorporate the Creative Commons Attribution
- Non Commercial (unported, 3.0) License.
By accessing the work you hereby accept the Terms. Non-commercial uses of the work are permitted
without any further permission from Dove Medical Press Limited, provided the work is properly
attributed. For permission for commercial use of this work, please see paragraphs 4.2 and 5 of our Terms.